
Road Safety Manual
A manual for practitioners and decision makers
on implementing safe system infrastructure!
Road Safety Manual
A manual for practitioners and decision makers
on implementing safe system infrastructure!
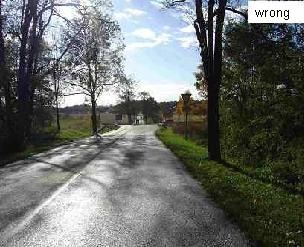
The demand of self-explaining design of Human-Machine Interfaces has produced a revolution in operating computers, machines and phones. The principles of an intuitive design that suggests users can use their mobiles or tablets reliably without further instruction are nowadays very common. In analogy to that, a self-explaining road design should be as intuitive as possible for the road user so that danger symbols, prohibition and requirement signs are not required any more in the Man-Road Interface. So, it is not only important to build up a clear system of road categories to inform the driver about the appropriate speed or to set speed limits. A road's Gestalt should also provide a clear impression of how to drive and it should pre-program driver’s expectations so that they are never surprised or encouraged to take any risk. The information presents below are findings from Germany from 1,400 crash locations. This study found the following three human factors elements essential for self-explaining roads.
The time it takes an average driver to adapt from one traffic situation to the next, or to adjust to new requirements, is much longer than what is stated in many current guidelines. Because humans are not constantly alert and searching for new information, they need more time. This is especially true when information is difficult to find or is unusual, or when the driver is confronted with complex decisions or when unusual manoeuvres are required. Instead of one or two second (simple "stimulus-reaction time") it takes the average driver at minimum 4-6 seconds to adapt to a new driving requirement ("anticipation-response time." PIARC Report 2012R36EN). Providing the driver with more time to perceive, decide and respond to the road and conditions is one of the most important means to improve safety. At 100 km/h, the distance covered before the vehicle can be brought to a complete stop is up to 300 m, allowing for braking distance (note that this may take longer if braking is slow due to a wet road or other circumstances).
A user-friendly road will give drivers the necessary time to adapt to new and unexpected situations. It will give them the time they need to safely reorganise their driving program. That is why it is not enough to provide the driver with a reaction time of 2-3 seconds (Stopping Sight Distance, SSD, with manoeuvre section and response section). The design should also provide an anticipation section with a minimum 2-3 seconds to identify an unexpected or unusual situation with more complex decision demands (Decision Sight Distance, DSD). In situations that are more complex or involve higher speeds, it is recommended to have an advance warning section with proper signing and instructions.

The usual ways to avoid this situation in practice are to:
Additional good solutions and best practice examples can be found in the PIARC Report (PIARC 2012b) "Human Factors in Road Design. Review of Design Standards in Nin Countries."
It is important to recognize teh factors that may affect the driver's ability to anticipate, perceive and react to given situations and conditions. Table XX provides examples of driver and situational/environmental conditions that can influence ability to perceive and react to a condition, which highlights the importance of the six second requirement.
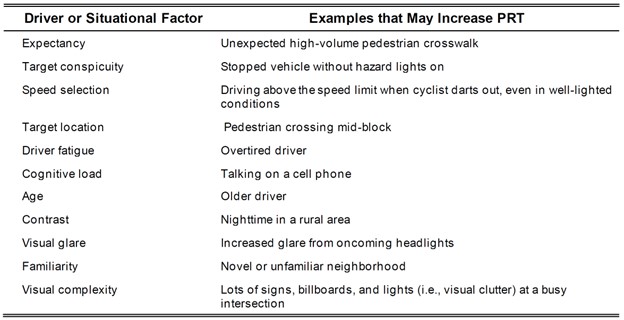
Campbell et. al, note that expectancy, conspicuity, and speed are notable factors in perception reaction.
Expectancy is important to drvier response when a road is self-explaining, the driver knows what to expect from the road, and sudden changes are reduced. Sudden changes require extra processing time (e.g., sudden curves, high volume pedestrian crossings, significant speed reductions). A designer should take time to consider what the driver is expecting to see given the past experience and adjust or inform accordingly.
Conspicuity or the ability to be seen or noticed is an important concept in road design and operation. A conspicuous object is one that the driver can detect. Falure in detection lead to crashes. Issues that reduce conspicuity to drivers include objects that are off-axis or not in the driver's line of sight, or cone of view. Items that blend in with their background or have diminished contrast make them difficulty to identify. The size of the object, such as those objects that are very small or very similar to toher surrounding items can create challenges as they beocme camoflouflaged. In some locations, visual clutter, such as multiple signs, messages, confusing information or complexity are influencers, particularly at locations requiring multiple decisions, such as intersections, interchanges or curves.
Speed is important. As has been suggessted earlier, the faster one is driving, the further they travel in a shorter timeframe before encountering a decision point or object. While speeds influence driver speed choice, orther important infrastructure elements (e.g., shoulders, lane widths, vegetation, roundabouts, and curvature) can influence driver speed choice. Drivers will view the speedometer but use other visual, auditory and tactile stimuli to select speeds. Drivers use perceptual and message cues to select speeds. Drivers can also misjudge speeds in some environment such as rural environments without trees or entering into a lower speed environment after travelling many kilometers on a high speed environment such as rural to suburban transition zones.
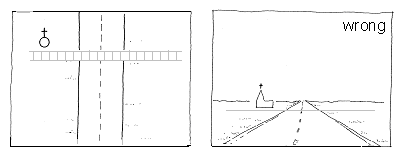
Monotonous, clouded, deceptive or distracting impressions affect the quality of driving. The road, together with its surrounding field, offers an integrated field of view. This can either stabilise or destabilise the driver; it can tire or stimulate them. It can also result in either increased or reduced speed. Speed, lane-keeping and reliability of direction are functions of the quality of the field of view.
A user-friendly road will give drivers a well-designed field of view with sufficient contrasts to increase alertness. It will provide good optical guiding and orienting facilities with symmetrical and orthogonal impression.
A good-quality field of view safeguards the driver and keeps him from drifting to the edge of the lane or even leaving it. Misleading eye-catching objects in the periphery of the field of view activate subconscious changes in direction. The most serious consequences arise from eye-catching objects that differ from the road axis. These lead in extreme cases to a horizontal swing of the complete field of view: The driver has the feeling that the road and its surroundings are moving while he is in an unmoved position. Such objects lead to gross mistakes in steering. At minimum they lead to disturbances in lane-keeping, though these can mostly be corrected (for this reason billboards near interurban roads that catch driver’s attention to a wrong direction should be forbidden like in Germany).
An experienced and Human Factors trained designer will avoid monotony in curvature and visual appearance. They will avoid optical illusions or misleading objects that destabilise drivers and negatively impact their driving and will take advantage of the optical perception to influence the driver's choice of speed.
Factors that are forming a safe field of view include the following characteristics:
a) Density of the field of view
The amount of information also influences driver’s speed. The term used for this is density of the field of view. It is a function of the number of objects that contrast with the background. The presence of very few contrasting objects leads to monotony as well as reduced performance and reactivity. To avoid monotony the driver subconsciously changes his driving activities in order to increase information input: he swerves, brakes or – in most cases – increases speed. Consequently, it is desirable to achieve an optimal level of brightness and color-contrast (optical density) to support the correct choice of speed. That is why efficient speed management relies on changing brightness and color contrasts to avoid subconscious speeding up.
b) Lateral space structure
It is proven, that the lateral field of view and its information provide the most important information to master the difficult task to hold balance on the road like on a balance beam.
If designers fail to take this fact into account, they may not make the right prediction about how the finished design will influence lane-keeping. To hold balance on the road (as on the balance beam) drivers need a clear orthogonal orientation out of objects in their periphery. Orthogonal objects or structures calibrate the equilibrioception of road users that is needed for lane-tracking. Equilibrioception is the perception of the position of an organism in the space with the help of the eyes (visual system), ears (vestibular system) and the body's sense of where it is in space (proprioception). Structures over the road like bridges, advertising, signaling and toll facilities should be symmetrical, of equal height, and the angle of skew to the own road should be less than 15° from perpendicular.
It was found at accident spots that asymmetrical posts of a bridge or pitched bridges/advertisements confuse and disorientate drivers with regard to lane-keeping and result in run-off-road accidents.
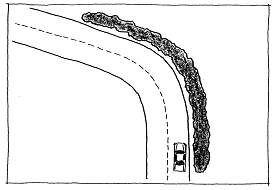
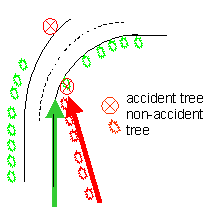
Driving reliably through a curve also critically depends on the quality of the field of view and a clear distinguishable Gestalt of the curve. Best driving results are achieved when the driver has an unobstructed view over the inner curve and the outer curve has a closed optical framing that provides with its Gestalt a clear instruction that there is a curve at all. It provides also clear information about the sharpness of the curve.
c) Depth of the field of view
The driver orientates themselves in the environment that surrounds them. To estimate their position relative to the road and to their surrounding and to other drivers, they depend on their changes of position, the changing view axis and the changing points/lines of reference in the environment. The most serious consequences arise from eye-catching objects that differ from the road axis. These lead in extreme cases to a horizontal swing of the complete field of view.
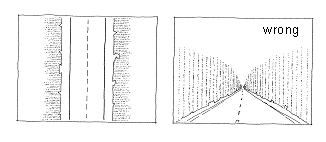
All lateral orientation clues should be parallel to the road edge, regularly spaced and equally sized to stabilise lane-tracking. This is important for markings, hard shoulders, side strips, safety barriers, snow and wildlife fences, plantings, bicycle ridings and rescue paths and also for public maintenance roads. It was found at black spots that non-parallel orientation lines lead to the impression of prolonged (if lines are converging) or shortened (if lines are diverging) distances up to critical locations. Optical illusions cause subconscious swerving, sudden driving manoeuvres and technically “unexplainable” run-of road crashes. The word illusion comes from the Latin verb illudere meaning "to mock.” Illusions are the result of the complex information processing of the brain and the visual system that tricks us into perceiving something as different from what it actually is. Thus, what we see does not correspond to physical reality.
These mistakes can be addressed by the following measures:
Additional good solutions and best practice examples can be found in the PIARC’s Report (PIARC, 2012b)“Human Factors in Road Design. Review of Design Standards in nine Countries”.
Drivers follow the road with an expectation and orientation logic formed by their experience and recent perceptions. These affect their actual perception and reactions.
The same principle applies when climbing stairs. After only a few steps the motion balance adjusts to the sequence of steps just perceived. In most cases, this is a subconscious process. However, if one step is of a different height, the motion balance will become considerably disordered - possibly resulting in a stumble or fall. Adjustment of driving programme on the road is similarly subconscious.
The perception of the lane, the edge of the lane and the lane periphery produces a general sensual impression. Drivers react to these road elements with their actions, in the same way as the person climbing stairs reacts intuitively to the height, depth and width of the steps. Unexpected objects disturb the automatic sequence of operations, possibly causing the driver to “stumble”. After several critical seconds the disturbance can be handled. Therefore, planners and designers try to keep road characteristics flowing in a logical sequence. They should introduce inevitable changes as early and clearly as possible and exclude any sudden changes that would confuse the driver.
When choosing their speed, drivers rely on their previous and recent sensory impressions of the last driven 5-10 minutes. Breaking the consistency and the experienced logic of the design causes operational mistakes which can lead to driving mistakes and accidents.
This particularly applies to five situations:
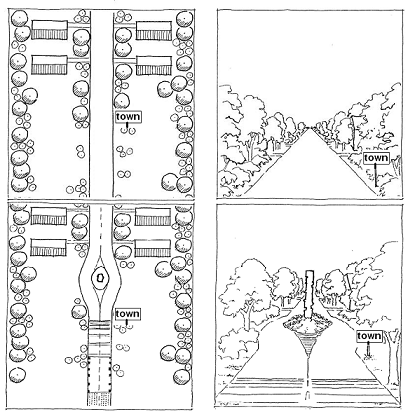
a) Change of road function without corresponding change in design and optical characteristics (e.g. town entrance)
Drivers need to adapt their driving programme when entering a built-up urban area or when road functions change significantly. They need to decrease speed and be more attentive as more decisions and reactions are required. Generally, there should be offered unambiguous visual clues to recognize the change of function, for instance by a horizontal swing of road’s course, optical sight barriers, planted central islands, special speed-reducing markings or a combination of these instructions. A clear guiding Gestalt hast to instruct the driver on how to adapt the driving programme.
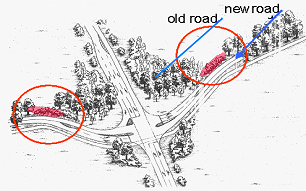
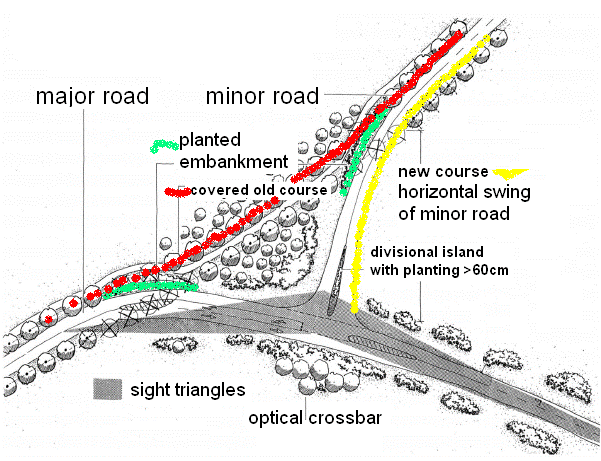
b) Change of road’s direction is contrary to eye-catching objects in another direction (e.g. city by-pass dilemma)
Drivers need eye-catching objects to realize that there is a change in road's direction despite other dominant eye-catching orientation structures or objects. The change of direction has to be supported by covering the wrong view axis or optical misguiding.
It has been found at black spots that dominant eye-catching objects such as a line of trees, buildings or straight road sections impede the correct anticipation of a road’s course even though correct signing is present. Road characteristics that mislead spatial perception cause technically “unexplainable” accidents.
c) Requirement for a new driving program recognised and changes are introduced to "re-programme" driving habits and expectations
Changing the right-of-way or altering the course of the road - such as a new alignment will challenge driver’s habits and expectations. Appropriate and timely signals or visual clues are required to inform the driver and provide an adequate time for correct anticipation. The required reaction could be significantly different from the habitual one! In order to avoid surprises, various design principles need to be considered.
It has been found at black spots that newly built intersections that are not introduced properly lead to incorrect anticipation of the situation and therefore to crashes even though correct signing is present
d) Driver's attention and ability to process information is limited
Driver’s attention and ability to process information is limited. Driving requires multiple tasks, such as control of lane tracking, anticipation and orientation as well as navigation. Drivers can focus on one piece of information at a time and multiple distractions or critical locations may result in an overload.
Too many decisions in too short time can overload the capacity for information processing and result in safety risks.
e) Deficiencies in traffic control devices
Due to higher traffic volumes, roads need to be equipped with traffic control devices for safety. Along with rules, traffic control devices organise the driving reactions of road users. Under all light conditions and within all optical backgrounds, traffic signs should be visible, legible and detectable. They should never be covered by plantings or other structures. That is because the effect of mimesis may make even bright, oversized signs invisible to the driver. Mimesis, also mimicry is the ability of organisms to adapt their coats/skin completely to their background so that they can't be detected.
![]()
Additional good solutions and best practice examples can be found in the PIARC’s Report (PIARC, 2012b) “Human Factors in Road Design. Review of Design Standards in nine Countries”.
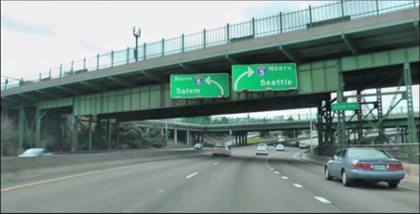
Traffic control devices need to be placed to clearly indicate necessary action. Failures in placement and changing messaging can create failures in selection and ultimately lead to emergency maneuvers taking place leading to a higher potential for crashes. The following images provide an example of such failure. First of signs shown in Figure 8.15 indicate city center and Seattle in the the same direction and lane.
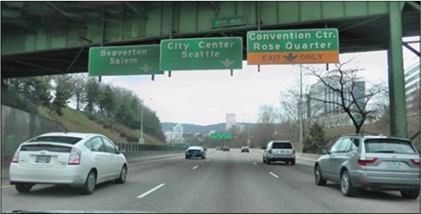
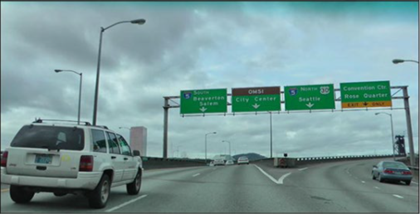
The second set of signs shown in Figure 16 are located 600 feet after the first signs and provide a different message. The second set of signs provide no mention of City Center or Beaverton, placing additonal workload demands on drivers and additional processing time. Furthermore, the Bridge obstructs the view of upcoming interchanges and horizontal curvature, and the location lacks symmetry and the offset visual opening may lead the driver to the left.
The final set of signs (Figure 8.18) are inconsistent with the previous messages. Additonal processing time is required to decipher messages. Visiblity is challenging becuase of the rise in vertical grade in comibination with horizontal curvature and the road splitting to the right and left. All of which require additonal steering input and processing time. The set up to the curve may be problematic because of confusion. The complexity may lead to sudden braking and steering due to late actions being taken.
The previous example highlights the potential for human error when expectations are violated. In the following we discuss other important human factors element to consider in reducing workload demands for drivers.
Expectations are used to help the driver prepare themselves to respond to future driving tasks, which in turn improves driver behaviours. Predicatbility allows for a lessening of cognitive efforts needed to process information. In a sense, the driver is programmed to a set of behaviours that are processed quickly and efficiently. While we often think of expections of drivers, setting and provding for clear expectations is beneficial to those walking and biking equally as it is towards the driver.
Expectations are created through design and operational consistency. Consistency allows for prediction by the road users, and it provides coded rules and relationships within the road environment (e.g., through common stop signs, or geomtery, lane markings being the same or very similar), all of which lead to improved road user response.
Expectations can be enhanced by well-designed traffic control devices based on the following principles of primacy, spreading, coding and redundancy are discussed.
Principle of Primacy -- Determine the placement of signs based on the importance of information, and by placing the information where it is most useful and beneficial.
Principle of Spreading -- Road users need time to process information. Therefore, all the information cannot be placed very closely or together. Signage needs to be placed in a manner that provides information in smaller processible parts to reduce information overload.
Principle of Coding -- Communication through multiple means is beneficial. At stop signs, one will often see stop bars, or additonal pavement markings requiring a stop. With some systems audible signals provide redundant information as to when to cross beyond just a pedestrian or bicycle crossing signal.
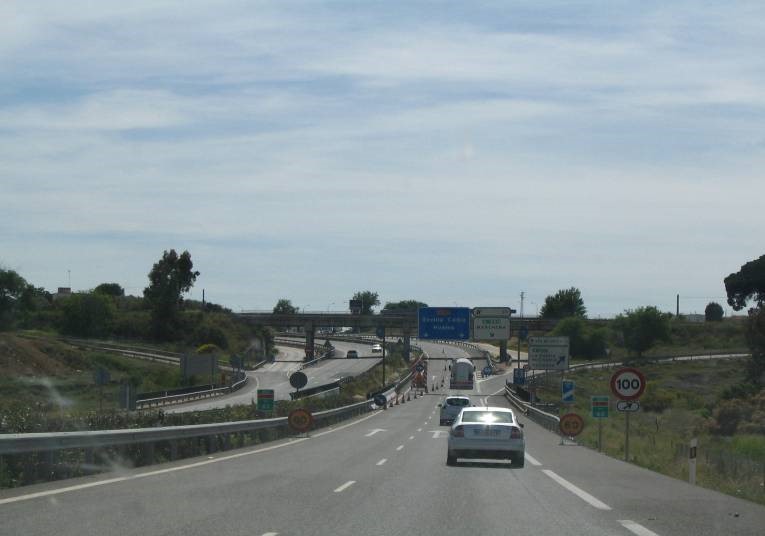
The case study from Portugal, shows the use of low cost engineering measures and law enforcement to change driver behaviours.
CASE STUDY – Portugal: Perceptual treatment - Low Cost Engineering Measures on a dangerous trunk road
The case study describes the approach used in 1998 by the Circulation and Safety Division of the Portuguese Road Administration (JAE) to improve road safety on the interchanges of a single carriageway, two lane, trunk road that connected the Portuguese coastal area and Spain (route IP 5). In a first phase, Low Cost Engineering Measures (LCEM) were applied, to improve the road characteristics; in a second step, exceptionally intense and severe law enforcement actions were employed by the police, to improve driver behaviour. Read more (485 kb).
Messages relating to regulatory requirements, warnings of hazards, directions, and other useful information can be conveyed to drivers and other road users by a number of means. These include:
The PIARC HFPSP guide discussed in Introduction includes actions to improve delineation or signage as possible remedial treatments for all of the three key requirements mentioned above, usually as a corrective measure to bring about a satisfactory resolution of the issue, or as a warning to indicate a potentially hazardous situation. Human factors considerations are critical in the design and provision of these treatments. The principal characteristics to be considered are:
Note that a Safe System is not created solely by communication with road users. However, clear indications of the expected driving actions, especially speed choice and clear warning of hazards, can do much to reduce the number of collisions and to mitigate the severity of those that do occur. Therefore, signing that matches user's needs human factors make important contributions to achieving a Safe System. It will have a critical contribution to crash reduction on road systems that fall short of Safe System requirements.
The case study from Slovenia highlights the use of human factors in road design.
How speed management works from the point of Human Factors
Speed has a significant effect on safety – it influences crash severity and reduces the anticipation and response time available for a given sight distance . The correlation between crash severity and speed is well documented. Small changes in speed have a significant effect on energy. So, it is not surprising that increased speed is considered as the biggest problem in road safety. Especially in the crash reports of the police increased or maladjusted speed is reported as the primary cause of crashes. In a lot of cases, inappropriate speed can be attributed to driver’s spatial perception on the road environment. As explained in the PIARC HFPSP the chosen speed depends on the interaction of human information processing and decision making on one hand and features of the road and its environment on the other hand. Modern science shows that the choice of speed, as well as the choice of position on the road, is mostly a subconscious process.
Most of the variables of the Human-Road Interface relate to physiological and neuronal mechanisms and affect the speed subconsciously. The following variables influence drivers speed and fatigue and therefore can also be used for an effective speed and fatigue management:
The following case studies from France, Italy, Singapore and Sweden all highlight different techniques and reasons for speed management.
CASE STUDY - Italy: Speed reduction schemes on urban collector roads
The case study describes a set of safety countermeasures in Via Pistoise (Rizenze, Italy), that is an urban collector road classified as a high accident concentration section. A detailed safety study has been undertaken to identify the possible applicable safety countermeasures. Accident analysis, road safety inspections and driving simulation studies were performed. The intervention to be implemented combines physical and perceptual treatments. Read more (PDF, 828 kb).
CASE STUDY - Singapore: Lower speed limit (40km/h) in Silver Zones
The case study covers the Silver Zone program implemented in Singapore since 2014. The program is designed to further enhance road safety of the elderly at large in the neighborhood precincts. Silver Zones aim to change the character of the street such that traffic movement is slowed down significantly and there will also be better walkability infrastructure to enhance road safety and first-and-last mile connectivity. Read more (1,177 kb).
CASE STUDY - Sweden: Bicycle passages and bicycle crossings
The project studies the consequence of a change in traffic law. On the 1st of September 2014 traffic law changed in Sweden. The change meant, among other things, that the concept of bicycle crossing was introduced and defined, with rules for the yield towards cyclists who are on or just traveling on a bicycle crossing, a new roads sign and requirements for local traffic regulations. In addition, it was stipulated that the traffic environment should be designed so it is not possible to drive vehicles at speeds higher than 30km/h. Read more (432 kb).
Traffic calming is the general term given to engineering techniques for encouraging lower speeds, and now includes a variety of well-documented treatments. The Institute of Transportation Engineers has a website that provides a comprehensive overview of traffic calming measures (ITE, 2013). Fact sheets are available for some of the most widely used types of devices, i.e.:
The website also has links to areas dealing with other types of treatments such as curb extensions, refuge islands, raised crosswalks and rumble strips; and links to topics such as speed reduction, accident frequency reduction, and reductions in cut-through traffic movements. A report from the UK’s Department for Transport provides a comprehensive summary of research on traffic calming (Department for Transport, 2007).
From the Human Factor point of view, they trigger the fixation in the nearer field of view and guide the attention to the right places, or they break the straight road axis and with this also the straight view axis that increases speed. In case of road narrowing the measures increase the difficulty of driver’s task to hold the balance on a narrower road. That’s why they have not only a physical, but first an optical stopping effect.
Traffic calming principles have been widely applied in the establishment of low-speed zones in residential areas. This concept originally emerged in the Netherlands as the ‘woonerf’ or ‘living zone’; it has since been adopted in a number of countries under various forms. The key success factors are that the road network must carry low traffic volumes, the completed scheme must not be able to be traversed quickly, and the appearance of the streets should be changed.
In the UK, the first 20 mph zones produced substantial changes in speeds and crashes. A review found that the average speed reduction was approximately 14 km/h, the number of crashes fell by 60%, the number of crashes involving children fell by 70%, and the number of crashes involving cyclists fell by 29% (Webster & Mackie, 1996). Traffic flow within the zones fell by an average of 27%, and increased on the surrounding network by 12%. Despite this shift in traffic, there was little increase in crashes on these surrounding roads.
Combinations of treatments such as pavement markings, road narrowing, and signage have been used effectively to reduce the speeds through settlements. A report from the UK’s DETR provides a comprehensive summary of research on traffic calming, including gateway treatments (Figures 8.10 and 8.18). Low-level gateway treatments were found to reduce speeds by less than 5 km/h; more substantial treatments by up to 11 km/h; and the most substantial treatments, which involved narrowing of the carriageway, by up to 16 km/h (DETR, 2007).
Makwasha and Turner (2013) found speed reductions associated with gateway treatments in New Zealand. Consistent with previous research, they found that speed reductions were greater at pinch point gateways where the roadway had been narrowed compared to gateways that consisted of signage alone. Consistent with speed reduction data, there was a 41% reduction in fatal and serious injuries at pinch point gateways, but small increases in crashes at the ‘sign only’ gateways. This agrees closely with earlier work by Taylor and Wheeler (2000) in the UK, which found a 43% reduction in fatal and serious injury crashes for gateway treatments alone, but reductions of 70% in these crashes when accompanied by downstream traffic calming treatments.

A detailed hypothetical example of how a gateway treatment might be provided is discussed in the PIARC HFPSP guide. Gateways are also used at the entry to lower-speed zones within urban areas. However, as speeds are generally low at these points anyway, their effectiveness can be hard to evaluate (DETR, 2007). The case study from Germany shows an example of bundling the motorized vehicles to help organize traffic flow.
CASE STUDY - Germany: Areal improvement of the quality of stay by bundling the motorized traffic
In this project a central square in Brandenburg an der Havel was redesigned into a three-arm junction. Brandenburg an der Havel is a city with about 71.000 inhabitants in the region Brandenburg in north-east Germany. The Nicolaiplatz is a triangular square with an important function for the local traffic, located in the city centre, nearby the historic city of Brandenburg an der Havel. The sums of the traffic volumes of all access roads to Nicolaiplatz are approximately:15.000 vehicles, 450 city busses, 360 trams, 500 cyclists (estimated) per 24 hours. Before the redesign, the function and geometry of Nicolaiplatz was significantly influenced by the traffic facilities before the remodeling (see picture 1). The Bus- and Tram stops were spread over the entire square and the whole traffic infrastructure was disordered and unclear for both, motor vehicle traffic and local public transport. Furthermore all facilities were outdated and not in a good condition. Read more (825 kb).
As mentioned in previous sections, road and traffic engineers have an effective array of techniques and devices available to provide information to the road user. If the basic road design creates a road environment and Gestalt that give consistent impressions on how to drive on that type of road the speed choice will be appropriate. This concept is generally referred to as a ‘road hierarchy’.
‘Self-explaining roads’ require a holistic approach in designing the road system and its immediate surroundings to make the required driving actions obvious to the driver. The European Commission website (EC, no date) describes self-explaining roads in the following terms:
Roads have different functions which require different traffic speeds and other driving actions, e.g. readiness to deal with cyclists and pedestrians (including young children). If these functions can be made explicit by the design and features of the road, it should be much easier to pre-programme the drivers to behave appropriately. A road that is truly self-explaining would make other aspects of driving demand obvious, such as which traffic stream should give way to another, when the driver is approaching an intersection or a curve, where pedestrians are likely to cross the road, and where the driver should position the vehicle to make a turn across a traffic stream. A self-explaining road would require few signs or line markings as the required driving actions would be conveyed intuitively by the way the road looks.
In the Netherlands, where the concept originated, four categories of road seem to be sufficient to cater for all needs (Theeuwes & Godthelp, 1995); these are:
Other countries may find that they need more categories to cover their full range of road types (e.g. rural access roads, urban collector roads). The important point is that roads can be designed to create different expectations about how road users should act on them.
A recent application of self-explaining roads principles in a suburb of Auckland, New Zealand demonstrates how appropriate design – in this case retrofitting an area with planting and other low cost measures – can pre-programme the right driving actions. After implementation, average speeds were lower on local streets but unchanged on collector roads. In both cases, the variability of speeds was reduced after implementation (Charlton et al., 2010). On local roads, vehicle numbers were reduced, vehicle lane keeping was less consistent, and signalling was less frequent. Also, pedestrian numbers increased, and pedestrians were less constrained in their movement patterns; however, these changes were not evident on the collector roads (Mackie et al., 2013). The authors interpreted these changes as indicating that a more relaxed, informal environment had been created on the local streets, consistent with the objectives of the project. These changed driving actions were accompanied by a 30% drop in crashes and an 86% reduction in crash costs.
Under a safe system, road authorities must look to establish a clear road hierarchy that effectively manages the potential conflicts between different road users. Ideally, each road should be defined as having either a function that facilitates high traffic flow or one that manages exchange between different road users, but not both. This then enables a (long term) planning and design framework that supports good neighbourhood planning, safe road layouts, and safe speeds to ensure road users are sufficiently physically protected.
Creating a clear functional hierarchy in the road network is an important planning tool and helps to define movement versus place priorities as well as appropriate Safe System infrastructure responses. Roads with a movement or flow function can accommodate higher volume, higher speed traffic but require separated facilities along the corridors if pedestrians and cyclists are preesent and intersections should be treated with roundabouts or traffic signals with raised safety platforms to manage speeds at crossing points. In areas or on roads where different road users mix, traffic calming measures wuch as lane narrowing, chicanes, speed humps, raised crossings, and landscaping are needed to create a lower speed environment. This includes establishment of large traffic-calmed areas where through traffic is kept out, or where vehicles use is discouraged except when people need to be inside this region.
The Movement and Place Framework is increasingly used to guide transport planning in delivering a more integrated transport system to impvoe customer outcomes and support a range of user groups. Work is alread underway in some jurisdictions to integrate Safe System principles and treatments within the Movement and Place Framework to safely cater for all road users and enable more proactive and lasting road safety benefits. This is particularly important for the liveabilitiy of places and vibrant streets, where greatere numbers of pedestrians and cyclists gather. They are inherently more vulnerable in crashes and, in some environments, highly exposed to the risk of crashes.
Austroads (2020) outline specific safety infrastructure measures for pedestrians and cycists aligned to Safe System principles within a Movement and Place Framework.
The implications of self-explaining roads are especially profound for LMICs. The evidence is that drivers pick up powerful messages about the appropriate way to drive from the cues in the environment. Developments affecting parts of the road system that have customarily been used for social or commercial purposes should therefore be handled with particular care. If it is possible to retain the social or commercial function, then care should be taken to separate through traffic movements from the mixed activity area and ensure that a high-speed environment is not imposed on it. If it is not possible to retain the social and commercial functions, then a suitable alternative site for these activities should be found, and the new road facility which replaces the former mixed activity area should be clearly identifiable as primarily a traffic facility.ice, to improve driver behaviour. Read more (PDF, 241 kb).
Uncontrolled access and unplanned communities can also create uncertainty and potential hazards for all road users the report: Land use and Safety: an introduction to understanding how land use decisions impact safety of the transportation system discusses how land use (e.g., density, use, mix) and typical transportation factors (functional classification, context classification, transit availability, speed and access control/management can affect safety outcomes. The report provides examples of where and how land use and transportation decisions are made and explores several tools and techniques to improve safety in transportation and land use interactions.

Addressing road-based fatigue is a key component of increasing road safety. Fatigue is well known to reduce and keep drivers from reacting to hazards. The outcome of this is the potential to increase crashes. In 2016 PIARC produced, The Role of Road Engineering in Combatting Driver Distraction and Fatigue Road Safety Risks. This important document highlights the problem with fatigue and distraction and outlines road safety countermeasure to combat this ongoing issue.
There is a clear distinction between fatigue, which occurs with time spent on a task, and drowsiness which varies according to the time of day and how much sleep a person has had. The terms are often used interchangeably as they often occur together and have similar debilitating effects on driving. A review for the UK Department for the Environment, Transport and the Regions (Jackson et al., 2011) concluded that fatigue affects driving skills in three ways:
The most effective ways of managing fatigue for professional drivers appear to be through workplace fatigue management programmes, supported by programmes to ensure that drivers come to work well-rested by addressing lifestyle issues. In-vehicle fatigue monitoring systems that analyse driver behaviour and warning signs to determine the onset of fatigue have the potential to be a highly effective tool for detecting the early stages of fatigue in drivers and minimise teh likelihood of incidents. But for common drivers in general the road design has to ensure that the basic Human Factors principles of managing speed are realised in road design.
Roberts and Turner (2008) identified specific areas where infrastructure-based countermeasures might be effective. These include:
Opportunities to rest are likely to be beneficial. It is well-established that short periods of sleep can restore the performance of fatigued drivers. However, there is uncertainty about the location of these facilities in relation to high-risk sections of road, and about the best type of facilities to be provided at different locations.
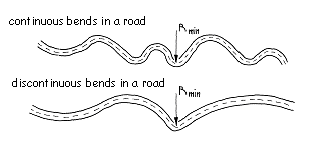
Monotony reduction was thought to be worthwhile, but there was uncertainty about what type of monotony reduction would be effective because there is a lack of empirical and experimental data until yet. But it is well known that long straight roads without sufficient curvature are creating monotony based fatigue to drivers. Note that the PIARC HFPSP guide suggests the creation of ‘sinuous, rhythmic road alignments’ (i.e. gently winding roads) to counter monotony by providing a constantly changing visual field and an activation of the equlibrioception, especially the proprioceptive system. It also suggests that the number of brightness and color contrasts in the lateral periphery of the field of view should be increased as also the fixation point should be limited in the nearer depth of the field of view (8.2.3). This can be achieved by changed height and kind of vegetation, special markings, colored pavements, changes of contrasts in the vertical scenery of buildings, in tunnels and similar optical countermeasures against monotony.
Signs and road markings increase the number of brightness and color contrasts and are supportive against road triggered fatigue. They can also draw driver's attention to areas of high risk of fatigue crashes and advising of opportunities to rest at towns or rest areas were thought to have potential.
Audible line markings are raised thermoplastic lines which create a whirring sound when driven over, alerting the driver that the vehicle is drifting onto the shoulder (when applied as an edge line) or across the centre of the road into the opposing lane (when applied as a centre line). These have proved to be highly effective in reducing crashes, but generally do not generate a sufficiently loud signal to be effective for trucks. In countries where there is widespread use of asphalt construction on rural roads, an equivalent treatment can be produced at lower cost by creating depressions in the asphalt by means of a special roller, or by milling grooves in the road surface. This is not possible when the road is of sprayed seal construction , which is typical of many roads in LMICs and HICs with low population densities. Audible line markings can also be applied to concrete roads, either by the application of thermoplastic markings or by milling grooves in the road surface.
If these other measures fail to prevent a fatigue-related incident, then barriers and/or clear zones at appropriate points have the potential to avoid serious injury.
Even when road users have a good understanding of the road rules and traffic control devices, there may be situations or locations where they are unsure about the correct driving procedures. These situations generally arise in unfamiliar situations, e.g. when a site has unusual geometry, or where drivers find themselves sharing the road with unfamiliar things such as slow, oversize vehicles, or herds of animals being driven along the road. Ideally, a road user’s training and experience would have taught them to behave safely and wait until any unclear/unusual situation is resolved so that they can move or overtake safely. Over time, it would be hoped that situations with unusual or misleading geometry would be eliminated by the progressive treatment of hazardous locations as determined by crash records or risk analysis. In the meantime, care should be taken to ensure that correct guidance is given to all road users by means of signage, lighting, line marking and delineation. It is important to ensure that the package of guidance measures is properly understood, particularly if unfamiliar.