Road Safety Manual
A manual for practitioners and decision makers
on implementing safe system infrastructure!

Road Safety Manual
A manual for practitioners and decision makers
on implementing safe system infrastructure!
When collecting, managing or utilising road safety data, it is important to remember that data quality can be compromised at any stage of the data process. This can be due to:
There are a number of consequences associated with poor data quality and under-reporting of crash data (Austroads, 2005; OECD, 2007). Some include:
This section will consider factors that affect data quality, as well as methods for studying inconsistencies in data and how to improve data quality. Although this section concentrates on crash data, quality issues are also relevant to non-crash data, and care needs to be taken in the collection and interpretation of this.
Data can sometimes be recorded incorrectly by the police or data entry staff. A major issue to note is that the person who fills in the form at the scene is, in most instances, not the same person who enters the data into the database (OECD, 2007). Missing, incomplete and incorrect data is often unintentional and is the result of human error. Due to officer priorities and workloads, the police cannot always attend the scene of a crash or may not have the time to completely fill out the crash report (which can be made worse by unnecessarily long data collection forms). Unclear variable definitions, as discussed in the next section, can also result in incomplete or incorrect data entry. Similar issues can also occur with non-crash data. For example, road asset data can be coded incorrectly, or data entry errors made during the analysis of speed data.

The definition of each variable (crash type, injury severity, location, etc.) can differ between data sources (for example, police crash files, hospital records, insurance claims), jurisdictions and countries. This can lead to complications in the identification of crashes of interest, the comparison of datasets, and the evaluation of data quality within a dataset. Common confusing definitions are discussed below.
The most common categories of injury severity are fatal, serious/severe and slight/minor injury. However, the exact methods used by police and hospital staff to determine which injuries fit into which severity categories can be problematic.
A recurring issue when comparing datasets from different countries is the timeframe that applies to ‘fatal’ injuries and crashes. The 30-day rule defines a fatal crash as when any person is killed immediately or dies within 30 days as a result of a road crash injury, excluding suicides. The 30 day rule is the most common classification used around the world, particularly by high- and middle income countries (WHO, 2010). Other countries, particularly lower-income countries, use the definitions of ‘at the scene’ or ‘within 24 hours’ to classify fatalities, which can create inconsistencies between databases. Adjustment factors have been developed to account for this (WHO, 2010); however, this assumes that similar proportions of vulnerable road users exist in each system, which is not necessarily the case (WHO, 2010).
The 30-day rule also implies that there is some coordination between the police officers who attended the scene and hospital staff in order to check for updates on patient status after 30 days. This is often not the case due to different priorities and workloads of those involved (WHO, 2010). The same issue arises with regard to non-fatal injury classification: a serious/severe injury is often classified as ‘admission to hospital’; however, police often classify this as all people who leave the scene in an ambulance (Austroads, 2005). Similarly, there is variation in what hospitals consider to be a ‘serious injury’ (see IRTAD 2011 for a detailed discussion of this issue). An increasing number of patients are being referred to specialist clinics (e.g. fracture clinics) instead of being admitted to hospital. Therefore, in some databases it is difficult to tell whether trends showing fewer admissions are a result of a change in the severity of crashes or a change in the health care management system (Ward, Lyons & Thoreau, 2006). IRTAD (2011) recommends that serious injury should be determined by trained hospital staff and not the police at the scene of a crash. In reality, such checks on crash severity outcome are often not made, and it is left to the police in attendance to determine the severity outcome.
In some countries ‘property damage only’ or ‘non-injury’ crashes are required to be reported, and in others they are not. Sometimes the level of damage must exceed a certain monetary limit before it must be reported. Such additional information can be of use, especially in the identification of crash locations and likely causation, although it does entail a higher cost in terms of data collection and entry.
The definition of a road traffic crash may incorporate or exclude crashes involving non-motorised vehicles. It may also exclude crashes that occur on private roadways or in off-road locations such as parks and parking lots. On the other hand, some countries collect information regardless of the location (WHO, 2010).
Another common issue is that hospital outpatient files often simply focus on the nature of the injury (e.g. broken femur) and sometimes neglect to mention the external cause of the injury. This can make it practically impossible to identify which cases are crash-related, and it also reduces the information available to identify and treat crash locations (WHO, 2010).
There are a number of different methods used to determine the location of a crash (as discussed in Establishing and Maintaining Crash Data System). Each of these methods can be subject to error, which can lead to inaccurate or non specific crash locations recorded by police. This can make it difficult to assess the significance of particular crash locations.

Under-reporting can occur at any point in the data collection and data entry processes. WHO (2010) discusses the factors contributing to under-reporting in police data and health facility data in detail. Under-reporting often varies with crash severity, transport mode, road user types involved, victim age, and the crash location. Common findings are that (Austroads, 2005; Ward, Lyons, Thoreau, 2006):
This under-reporting issue can be a significant problem in all types of countries, but has been a particular issue in LMICs (see Box 5.4 and Box 5.5).

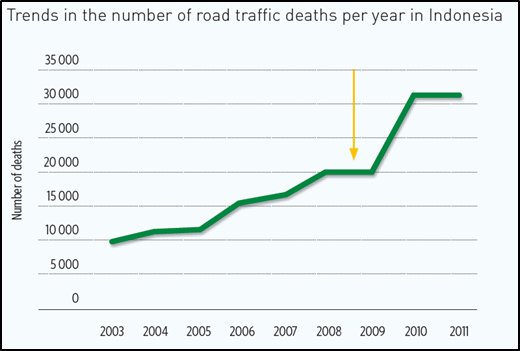
However, as indicated by WHO (2013), this activity had the unintended outcome of indicating a substantial increase in road crashes for 2010. This apparent increase is not a result of an actual increase in road deaths, but rather an improvement in the recording of existing deaths. Several countries are experiencing similar apparent increases in road deaths, when in reality the level of data accuracy has improved. The improved data allows for better identification and management of road safety issues. However, the impression that crashes are increasing substantially is an issue that also needs to be managed.
Source: WHO, (2013).
It is typically the case that higher levels of severity have better levels of reporting. Many countries (especially in HICs) record all fatal crashes, and have reasonable records of more serious injury (e.g. hospitalisation). Information for minor injury is typically less well reported. One quick way to determine the likely scale of under-reporting rates for non-fatal crashes is to compare the ratios for fatal crashes to other crash types between countries or regions. Although a number of factors need to be considered (e.g. road types, vehicle fleet, average speeds, etc.), the discrepancy in these ratios can indicate differences in reporting rates.
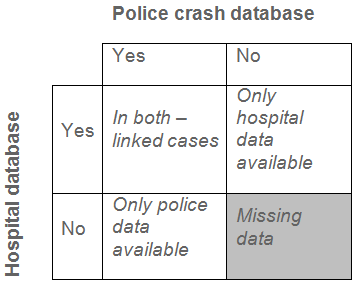
Datasets can be assessed for under-reporting levels and data quality by comparison with other databases. A common comparison to make is between police crash data and hospital in-patient data. Another source is to use insurance claim data. Although these evaluations are very useful, it is not possible to determine the real number of total road crashes as there is no way to know the exact intersection of the two databases (OECD, 2007). There will be some crashes that are recorded in police crash report databases, but as victims are not always sent or admitted to hospital (i.e. in property damage only or minor injury crashes), they do not always appear in the hospital database. Conversely, there will undoubtedly be hospital injury records that are not crash related.
Matching hospital and police data allows cases to be checked for accuracy (ensuring the information provided in both databases is the same) and also provides a basis to estimate the proportion of under-reported cases in both the police and hospital files, as shown in the diagram below (OECD, 2007).

A common problem with this technique is that some countries do not allow the release of victim names and sometimes even personal identification codes. Cases can then only be linked by other characteristics, such as time, date and location (Austroads, 2005). Data can only be reliably maintained when the data quality is regularly monitored. WHO (2010) and IRTAD (2011) provide details on methods for assessing data quality and under-reporting rates.
It is typically not possible to successfully collect data for every crash on a network, but not all crashes need to be reported to be able to draw conclusions and identify key priorities to improve road safety (Austroads, 2005; ; FHWA, 2017). However, the more comprehensive the data set, the higher the reliability.
The main steps to improving data quality include:
Section 3.4.1 of WHO (2010) discusses in detail how the above steps can be put into action. It discusses effective solutions such as the benefits of data entry systems with built-in checks to minimise mistakes, and engaging with police so that they see the value and importance of this task and their role within it. It is also important to acknowledge that a balance must be found in the number of details the police must record at a crash scene. Too many questions will lead to incomplete or missing crash reports, whereas too few will limit essential details that are required for future analysis.