
Road Safety Manual
A manual for practitioners and decision makers
on implementing safe system infrastructure!
Road Safety Manual
A manual for practitioners and decision makers
on implementing safe system infrastructure!
This section describes the current and forecast burden of road traffic injuries in more detail, both globally and regionally.
The Global Status Report on Road Safety is the central publication for periodic monitoring and evaluation of the Decade of Action for Road Safety goals (WHO, 2013a) . While crash injury data is incomplete and often substantially under-reported in many countries in both the health and transport sectors, the latest available estimates referred to in this manual provide a comprehensive strategic overview of the emerging crisis in LMICs.
The Global Status Report brings together data based on survey information collected for 182 countries, and makes estimates, where appropriate, to account for varying levels of data quality in order for data to be comparable across countries. This includes use of the 30-day definition of a road traffic death and involves point estimates of road traffic deaths in LMICs, which are sometimes far in excess of officially reported deaths. Data have been extrapolated for all 195 countries and territories in the world. Full details of the methodology used to develop comparative estimates are provided in WHO (2013a, p.42).
The Global Status Report notes the urgent need for standardised data collection on road traffic fatalities and the need for improvement in the quality of safety data on road traffic deaths, disability and other non-fatal injuries. See Effective Management And Use Of Safety Data for full discussion and guidance on the establishment, management and use of data, and determining levels of under-reporting.
In 2016, the number of road traffic deaths had climbed to 1.35 million (WHO, 2018) That's nearly 3,700 people dying on the world's roads every day.. Road traffic injury is a leading cause of death and serious health loss (expressed in terms of disability adjusted life years lost (DALYs)1 (see Box 1.3 ). For every road traffic death, at least 20 people sustain non-fatal injuries (ranging from those that can be treated immediately and for which medical care is not needed or sought, to those that result in a permanent disability (Peden et al., 2004). On an annual basis, between 20 and 50 million people are disabled or injured as a result of road traffic crashes (WHO, 2018).
Key insights from the Global status report on road safety 2018:
Source: WHO, (2018)
In some regions, road traffic injury was the leading cause of death for certain age groups, as shown in Table 1.1. For HICs in general, road traffic injury was the leading cause of death for children aged 5–14 years (IHME, 2013). A study in four LMICs indicated that 17% of children attending an emergency department following a road traffic crash sustained disabilities lasting six weeks or more (WHO, 2008).
| Region | 1–4 years | 5–9 years | 10–14 years |
|---|---|---|---|
North America | 1 | 1 | 1 |
Central Europe | 3 | 1 | 1 |
Australasia | 2 | 1 | 1 |
Western Europe | 2 | 2 | 1 |
North Africa and Middle East | 4 | 1 | 1 |
Latin America | 4 | 1 | 1 |
In 2016, the global road traffic fatality rate was 18 per 100,000. With and average of 27.5 deaths per 100,000 population. The risk is more than three times higher in low-income countries than in high-income countries where the average rate is 8.3 deaths per 100,000 (WHO 2018).
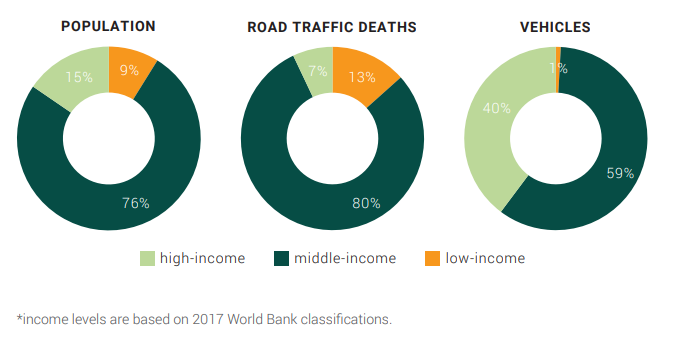
More than 90% of road traffic deaths occur in rapidly motorising low and middle-income countries, which account for 82% of the world’s population and 54% of the world’s registered vehicles. As shown in Figure 1.2, these countries have a high proportion of road traffic fatalities relative to their level of motorisation (WHO, 2018). Details on individual country performance can be found in the periodic Global Status Reports.
There has been more progress in reducing the number of road traffic deaths among middle- and high-income countries than low-income countries. Between 2013 and 2016, no reductions in the number of road traffic deaths were observed in any low-income country, while some reductions were observed in middle- and high-income countries (see Figure 1.2).
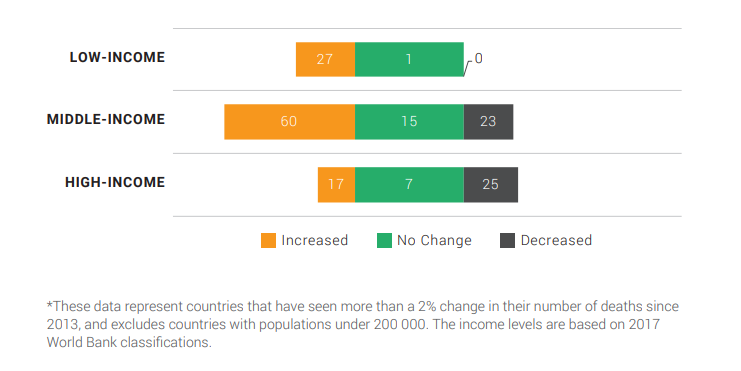
Between 2013 and 2016, the number of road traffic deaths decreased in 48 middle and high-income countries. Over the same period. 104 countires saw increases in the numvers of road traffic deaths (WHO, 2018).
In most LMICs, a much higher proportion of road users are pedestrians, cyclists and users of motorised two- or three-wheeled vehicles when compared with HICs. Over half of the global road traffic deaths occur among vulnerable road users – pedestrians and cyclists represent 26% of all deaths with those using motorized two- and three-wheelers comprising another 28%. Car occupants make up 29% of all deaths and the remaining 17% are unspecified road users (WHO 2018).
Low-income countries have the highest proportion of fatally injured casualties among vulnerable road users at 57%, as opposed to 51% in middle-income countries, and 39% in high-income countries (WHO, 2013a). Figure 1.3 provides further detail on road deaths by road user type for low-, middle- and high-income countries.
.")
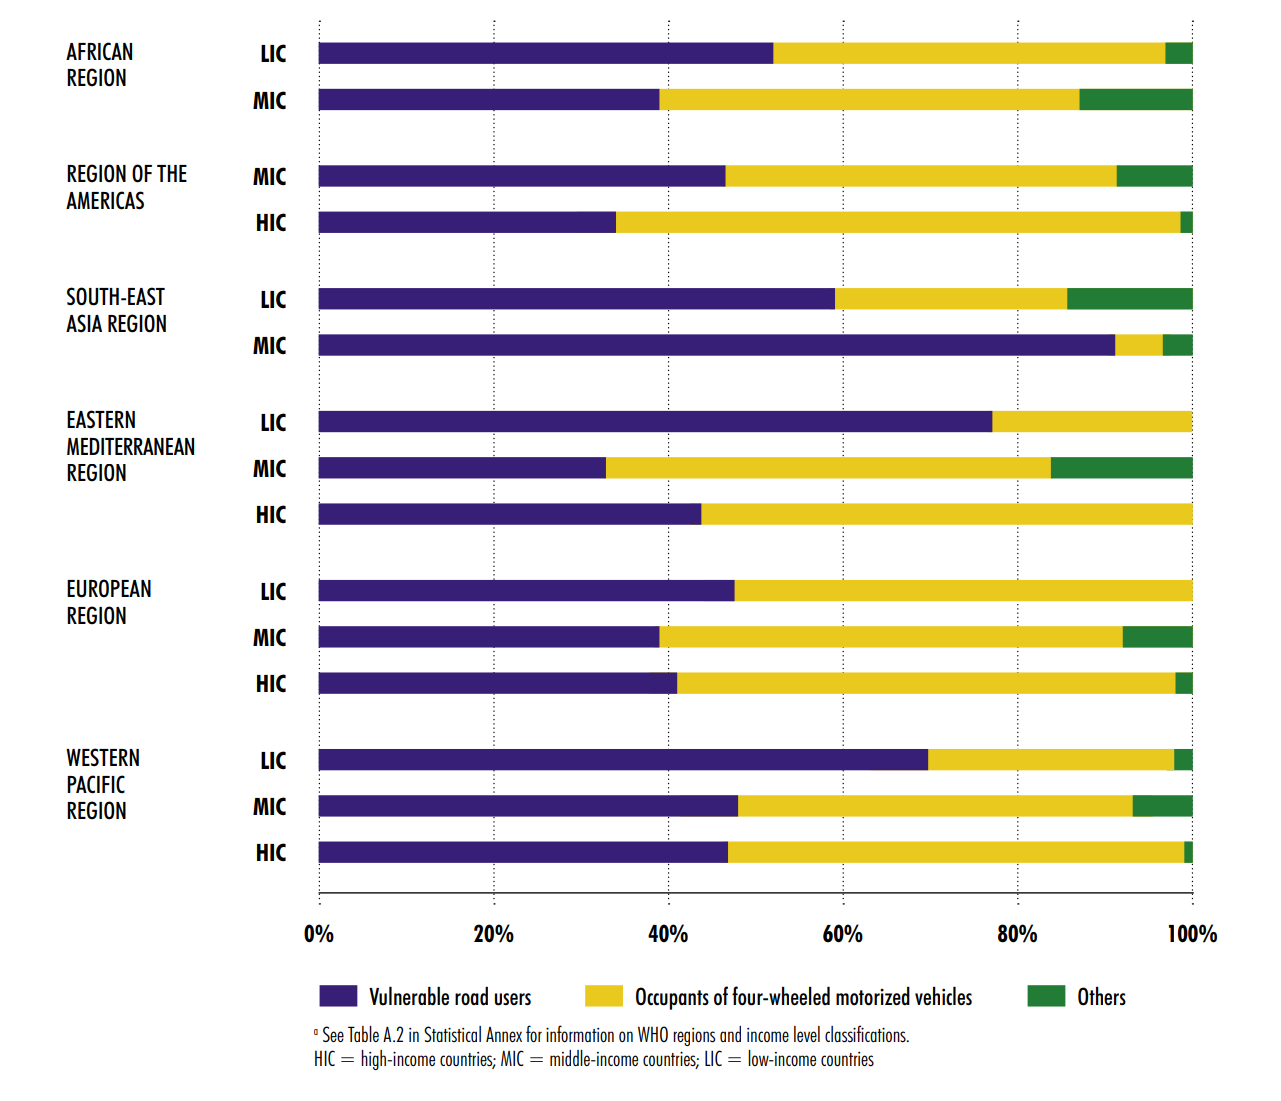
Figure 1.4 Indicates that nearly half (46%, WHO, 2015) of all the fatalities on a global scale continue to be vulnerable road users. The figure shows that regardless of the region vulnerable roads users are a disproportionately high total of the road user death..
Even in HICs, vulnerable road users are often vastly over-represented when rates of death and serious injury are compared. For example, when the distances travelled (billion miles) by different modes of road use were compared, more than 10 times as many pedestrians and cyclists than car drivers lost their lives on Great Britain’s roads in 2011. For motorcyclists, the rate was around 40 times higher (Department for Transport, 2012). The gap is even wider when considering the risk of death or serious injury by billion vehicle miles. For each car driver in Great Britain, more than 20 times as many pedestrians and around 40 times as many cyclists were killed or suffered a serious injury from a road traffic crash. Motorcyclists were exposed to the greatest risk, as they were 75 times more likely to be killed or seriously injured than a car driver (Department for Transport, 2012).
Young adults aged between 15 and 44 years account for 59% of global road traffic deaths (see Figure 1.5); and more than three-quarters (77%) of all road traffic deaths occur among men. In high-income countries, the proportion of deaths among those over 70 years is noticeably greater than in LMICs. Key exposure factors, such as longevity in these countries, combined with the greater risk posed by increased frailty, will contribute to these outcomes (WHO, 2013a).
.")
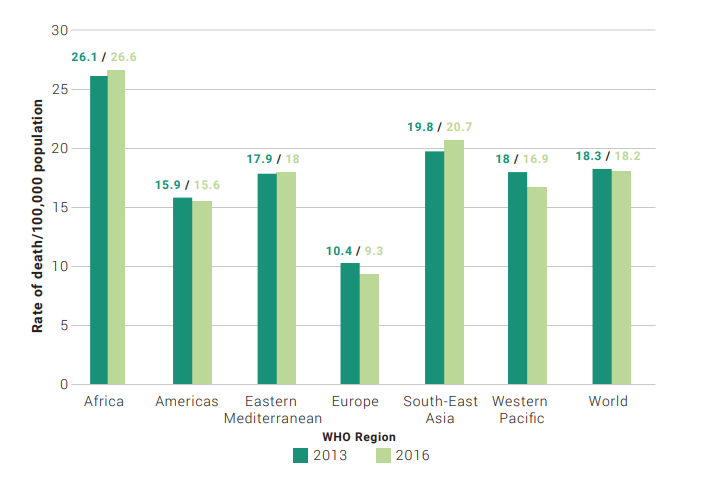
There is substantial variation in the road traffic death rates between different regions and within regions (see Figure 1.6). The reported risk of fatal injury is greatest in Africa at 26.6 per 100,000 populations and lowest in the European region at 9.3 per 100,000 population. Within regions, taking under-reporting of road fatalities into account, it is estimated that over half of African countries may have death rates of 30 per 100,000 population or more (AfDB, 2012).
As shown in Figure 1.6, in four out of six WHO regions, car occupants are the largest fatal casualty group.
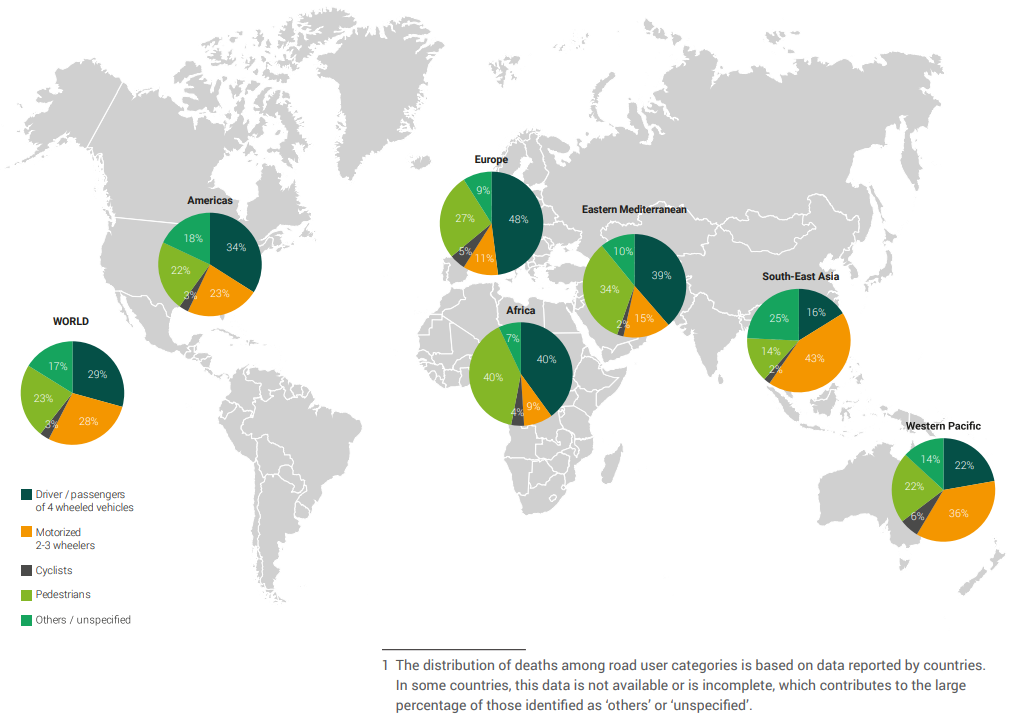
In Africa, Europe, the Americas, and Eastern Mediterranean most deaths from road traffic crashes involve car occupants. Africa has the highest proportion of pedestrian and Cyclist fatalities representing 44% of deaths. In South-East Asia and Western Pacific, the majority of deaths are riders of motorized two- and three-wheelers with 43% and 36% respectively (WHO, 2018).
Modelling of historic global trends indicates that if LMICs choose to follow the costly evolutionary path of HICs in reducing deaths and serious injuries as they built knowledge, then the road death toll in LMICs is likely to increase very substantially (Kopits and Cropper, 2003; WHO 2013b). Latest forecasts indicate that, based on current trends, 96% of the global total of road deaths by 2030 are likely to occur in LMICs (WHO, 2013b).
The highest projected regional death rates (deaths per 100,000 persons) to 2030 are in Sub Saharan Africa (38), South Asia (29) and the Middle East and North Africa region (28) with decreasing rates between 2015 and 2030 in the East Asia and Pacific and Latin America and Caribbean regions and, most sharply, in the European and Central Asia regions (See Table 1.2). There is large regional variation in LMICs in the number of deaths per 100,000 persons with the highest rates being 4 times higher than the lowest. By 2015, the death rate from road traffic crashes was forecast to be around 8 per 100,000 persons in HICs decreasing to 6 by 2030 but nearly 20 in 100,000 persons in LMICs (WHO, 2013b).
| World (World Bank regions) | Deaths per 100,000 persons | |
|---|---|---|
| 2015 | 2030 |
South Asia | 21 | 29 |
East Asia and Pacific | 22 | 18 |
Sub-Saharan Africa | 25 | 38 |
Middle East and North Africa | 26 | 28 |
Latin America and Caribbean | 20 | 19 |
European and Central Asia | 14 | 9 |
High-income countries | 8 | 6 |
Global total | 20 | 22 |
Source: WHO, (2013b).
The relative importance of road traffic injury to other disease burdens is also predicted to increase steeply. Forecasts of global mortality trends to 2030 indicate that road traffic injury is set to increase from the 9th to the 7th cause of death, as shown in Figure 1.8 (WHO, 2013b).
Country road safety management capacity reviews and other studies reveal that most road deaths and serious injuries occur on a relatively small proportion of the road network. Such roads usually have both urban and rural sections. In India, around two-thirds of deaths occur on national and state highways, which account for just 6% of the network (Mohan et al., 2009). In Bangladesh, just 3% of arterial roads account for 40% of the road deaths (Hoque, 2009). Statistics from a wide range of countries show that typically, around 50% of deaths occur on just 10% of the road network (McInerney, 2012). These roads have high strategic priority, attract large investment, and are particularly amenable to targeted road safety treatments (GRSF, 2013).
Typically, in the main road network, traffic volumes and vehicle speeds are high, with a mix of motorised traffic and non-motorised users, and mixed speed road environments (Commission for Global Road Safety, 2011; GRSF, 2006–2013; UNRSC, 2011b). A key problem is that many road standards used in road projects in LMICs do not provide for the degree of human vulnerability involved in the use of the road network. Furthermore, the efficient and effective police enforcement of safety behaviours, which contribute to the overall safety performance of road safety engineering standards in high-income countries, is lacking. Junction design standards and the management of road use from low- to high-speed environments expect vulnerable road users to compete successfully against faster, bigger vehicles, with tragic consequences (GRSF, 2010, 2011). While new roads bring new opportunities for development, many increase the risk of death and serious injury where roads are not restricted to through-traffic, where linear settlements are not avoided, and where there is no first class provision for pedestrians, cyclists and other vulnerable road users (UNRSC, 2011b). Specific global guidance to assist with project design for the road safety management of corridors is provided in Targets and Strategic Plans and in Planning, Design & Operation of this manual as well as global references on this issue (e.g. UNRSC, 2011b; GRSF, 2009, 2013; Breen et al., 2013).
The main crash types on the world’s roads have been identified as follows (UNRSC, 2011b):
Further information is provided on the main crash types in Section Crash Causes and in Part Planning, Design & Operation.
Road safety problems in low-, middle- and high-income countries are found across road safety management systems, including in:
LMICs present some particularly complex challenges for road safety work. Weak road safety management capacity as well as the lock of road safety reearch facilities in many countries presents a large barrier to road safety progress (GRSF, 2006–2013, PIARC 2023). Road safety progress will be linked to other development priorities such as:
Country road safety investments in LMICs will have to be sustained over a long period and across a range of sectors, directed by appropriately resourced governmental lead agency arrangements. Such government-led road safety policy may find its foundation in strong local academic research. Universities and institutes play a critical role in transforming interantional knowledge about Safe System concepts and principles towards evidence-based measures for the local LMIC context, taking into account local traffic conditions and safety culture (PIARC, 2023)
Full discussion and guidance are provided in subsequent sections on critical success factors for addressing key road safety problems. This will address the needs of LMICs with their own special challenges. It will also provide guidance for HICs that are currently in the process of addressing strict Safe System parameters, which include new speed thresholds as well as the broader environmental and public health drive for more active transport solutions.