
This chapter outlines the global crisis of road traffic injury and the substantial value of preventing death and serious injury in road crashes. It also introduces the key road safety concepts that underpin this manual’s guidance for implementing affordable and effective interventions to achieve results that may be required in any given context. The first of these concepts is the challenging Safe System long-term goal and strategy, which is recommended to all countries regardless of their socioeconomic status and level of infrastructure development.
Secondly, this chapter highlights the planned, systematic approach needed for effective road safety management to produce successful road safety results. As discussed more fully in later chapters, these approaches provide a foundation and implementation framework for road safety investment programmes and demonstration projects. It is emphasised that these programmes and projects need to seek targeted results for the short to medium-term, appropriate to the learning and management capacity of the country concerned. Affordable, effective intervention is required that better addresses the needs of all road users, including those most vulnerable. The chapter highlights the importance of aligning road safety with other important societal objectives, given the significant potential for shared benefits and in order to maximise cost-effective investment.
Economic development makes an important contribution to increased mobility and motorisation. It is forecast that over the first 30 years of the 21st century, more motor vehicles will be produced globally than in the first 100 years of motorisation. The majority of these vehicles will be used in low- and middle-income countries (LMICs)1 (Bliss, 2011).
Alongside rapidly increasing rates of motorisation in LMICs, premature death and disability is occurring on a disastrous scale. Global road deaths increased by 46% between 1990 and 2010 (Mathers et al., 2012). More than 90% of road traffic deaths occurred in LMICs and the victims are predominantly vulnerable road users, males, and include the most socio-economically active citizens (WHO, 2013a). Apart from the sheer scale of human misery involved, the often underestimated socio-economic value of preventing these tragedies is substantial (Jacobs et al., 2000; OECD, 2008; McInerney, 2012).
The road safety performance gap between rich and poor countries is set to widen further. It is projected that, by 2030, around 96% of global road deaths will occur in LMICs with 4% of deaths occurring in high-income countries (HICs). Forecasts of global mortality trends indicate that road traffic crashes are the twelfth leading leading cause of death (WHO, 2023) and is set to increase to the 7th leading cause of death by 2030 (WHO, 2013b). Without new initiatives, forecasts indicate that more than 50 million deaths and 500 million serious injuries on the world’s roads can be anticipated with some certainty over the first 50 years of the 21st century (Bhalla et al., 2008). This can be compared with only an estimated 1% probability that over the same period, more than 40 million people could be killed in mega-wars or by a virulent influenza epidemic and around 4 million people by volcanoes or tsunamis (Smil, 2008).
It is now widely accepted that serious health losses in road traffic crashes are largely preventable and predictable – a human-made problem open to rational analysis and effective road safety management (Peden et al, 2004). Road traffic systems can be developed that reduce the likelihood of serious or fatal crashes occurring and to minimise injury severity in the event of a crash. This is supported by a substantial body of knowledge on how to achieve significant lessening of the costly, adverse impacts of motorisation. In European Union countries, for example, the overall volume of traffic tripled between 1970 and 2000, while the number of people killed per million inhabitants decreased by 50% (CEC, 2003). (See key overviews by Peden et al., 2004; OECD, 2008; GSRF, 2009).
In the 1990s there were two major and complementary developments that informed modern best-practice to road safety and how to more effectively manage for better results. The first was led by Sweden (Vision Zero) (Tingvall, 1995) and the second Netherlands (Sustainable Safety) (Koornstra et al., 1992), both representing a paradigm shift towards the ambitious Safe System goal (see Box 1.1)
A Safe System approach places road safety in the mainstream of road traffic system planning, design and operation. Building on the best of previous approaches, Safe System better addresses the needs of vulnerable road users and is particularly relevant to the needs of LMICs. As discussed in The Safe System Approach, firmly establishing a Safe System in national road safety work requires strong political backing and underwriting in legislation (OECD, 2008; Belin et al., 2012).
More recently, the World Bank, the OECD, and the International Standards Organization (ISO) have underlined that effective road safety management is a systematic process. Road safety does not just occur, but has to be produced. The safety performance produced by countries active in road safety has been achieved following years of sustained investment in road safety management and governmental leadership. The road safety management system is the productive capacity to deliver key institutional management functions, which produce and enable effective, system-wide interventions that are designed to produce results – with the Safe System goal and strategy representing the most ambitious approach (OECD, 2008; GRSF, 2009; ISO, 2012). These holistic concepts are the common threads running throughout this manual. They represent the summation of effective multi-disciplinary road safety knowledge and successful practice across the road traffic system, which have been built up over decades.
The gradual and increasingly more successful path towards these shifts in road safety thinking and practice are briefly outlined in Box 1.2 and are discussed in more detail in Key Developments in Road Safety. LMICs are being urged to avoid the evolutionary path of industrialised countries and to take key steps to move directly to affordable, effective Safe System approaches noted in Phase 4. High-income countries which are now setting increasingly ambitious road safety goals and targets are also advised to adopt this approach (OECD, 2008; GRSF, 2009; PIARC, 2012; WHO, 2013a). The implications for current practice in a variety of settings are recurrent themes in this manual and specific guidance is provided on appropriate steps for different road safety contexts.
This manual outlines a suggested path for jurisdictions to move from weak to stronger institutional capacity, particularly in their governmental lead agency and coordination arrangements and results management. The aim is to provide state-of-the-art guidance to assist all those involved in the safe planning, design, operation and use of the road network in accordance with national, regional and global goals.
This section describes the current and forecast burden of road traffic injuries in more detail, both globally and regionally.
The Global Status Report on Road Safety is the central publication for periodic monitoring and evaluation of the Decade of Action for Road Safety goals (WHO, 2013a) . While crash injury data is incomplete and often substantially under-reported in many countries in both the health and transport sectors, the latest available estimates referred to in this manual provide a comprehensive strategic overview of the emerging crisis in LMICs.
The Global Status Report brings together data based on survey information collected for 182 countries, and makes estimates, where appropriate, to account for varying levels of data quality in order for data to be comparable across countries. This includes use of the 30-day definition of a road traffic death and involves point estimates of road traffic deaths in LMICs, which are sometimes far in excess of officially reported deaths. Data have been extrapolated for all 195 countries and territories in the world. Full details of the methodology used to develop comparative estimates are provided in WHO (2013a, p.42).
The Global Status Report notes the urgent need for standardised data collection on road traffic fatalities and the need for improvement in the quality of safety data on road traffic deaths, disability and other non-fatal injuries. See Effective Management And Use Of Safety Data for full discussion and guidance on the establishment, management and use of data, and determining levels of under-reporting.
In 2016, the number of road traffic deaths had climbed to 1.35 million (WHO, 2018) That's nearly 3,700 people dying on the world's roads every day.. Road traffic injury is a leading cause of death and serious health loss (expressed in terms of disability adjusted life years lost (DALYs)1 (see Box 1.3 ). For every road traffic death, at least 20 people sustain non-fatal injuries (ranging from those that can be treated immediately and for which medical care is not needed or sought, to those that result in a permanent disability (Peden et al., 2004). On an annual basis, between 20 and 50 million people are disabled or injured as a result of road traffic crashes (WHO, 2018).
Key insights from the Global status report on road safety 2018:
Source: WHO, (2018)
In some regions, road traffic injury was the leading cause of death for certain age groups, as shown in Table 1.1. For HICs in general, road traffic injury was the leading cause of death for children aged 5–14 years (IHME, 2013). A study in four LMICs indicated that 17% of children attending an emergency department following a road traffic crash sustained disabilities lasting six weeks or more (WHO, 2008).
| Region | 1–4 years | 5–9 years | 10–14 years |
|---|---|---|---|
North America | 1 | 1 | 1 |
Central Europe | 3 | 1 | 1 |
Australasia | 2 | 1 | 1 |
Western Europe | 2 | 2 | 1 |
North Africa and Middle East | 4 | 1 | 1 |
Latin America | 4 | 1 | 1 |
In 2016, the global road traffic fatality rate was 18 per 100,000. With and average of 27.5 deaths per 100,000 population. The risk is more than three times higher in low-income countries than in high-income countries where the average rate is 8.3 deaths per 100,000 (WHO 2018).
More than 90% of road traffic deaths occur in rapidly motorising low and middle-income countries, which account for 82% of the world’s population and 54% of the world’s registered vehicles. As shown in Figure 1.2, these countries have a high proportion of road traffic fatalities relative to their level of motorisation (WHO, 2018). Details on individual country performance can be found in the periodic Global Status Reports.
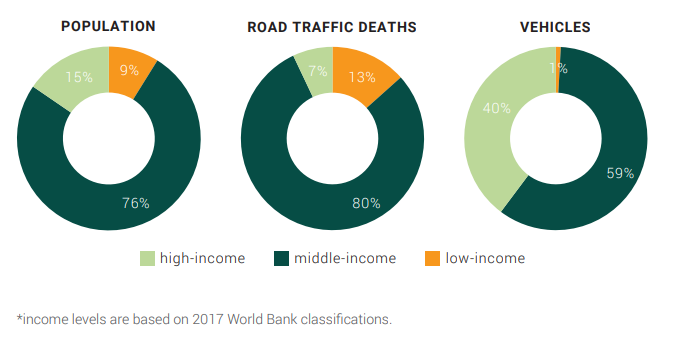
Figure 1.1 Proportion of population, road traffic deaths, and registered motor vehicles by country income category*, 2016 (Source: WHO, 2018)
There has been more progress in reducing the number of road traffic deaths among middle- and high-income countries than low-income countries. Between 2013 and 2016, no reductions in the number of road traffic deaths were observed in any low-income country, while some reductions were observed in middle- and high-income countries (see Figure 1.2).
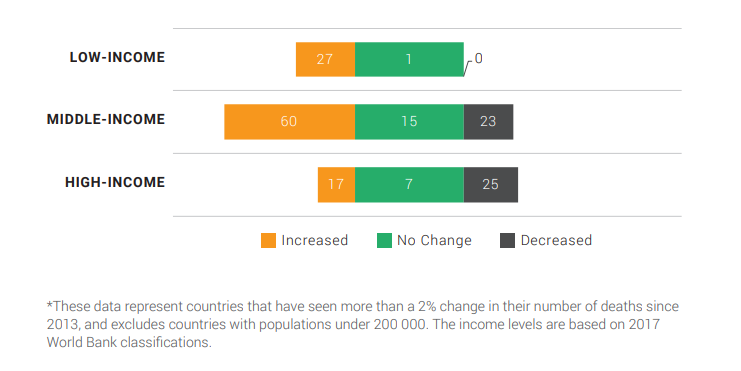
Figure 1.2 Number of countries where a change in the number of road traffic deaths has been observed between 2013 and 2016* (Source: WHO, 2018)
Between 2013 and 2016, the number of road traffic deaths decreased in 48 middle and high-income countries. Over the same period, 104 countries saw increases in the numbers of road traffic deaths (WHO, 2018).
In most LMICs, a much higher proportion of road users are pedestrians, cyclists and users of motorised two- or three-wheeled vehicles when compared with HICs. Over half of the global road traffic deaths occur among vulnerable road users – pedestrians and cyclists represent 26% of all deaths with those using motorized two- and three-wheelers comprising another 28%. Car occupants make up 29% of all deaths and the remaining 17% are unspecified road users (WHO 2018).
Low-income countries have the highest proportion of fatally injured casualties among vulnerable road users at 57%, as opposed to 51% in middle-income countries, and 39% in high-income countries (WHO, 2013a). Figure 1.3 provides further detail on road deaths by road user type for low-, middle- and high-income countries.
.")
Figure 1.3 Proportion of road traffic deaths by road user type and country status; 2010 - Source: WHO, (2013a).
Figure 1.4 Indicates that nearly half (46%, WHO, 2015) of all the fatalities on a global scale continue to be vulnerable road users. The figure shows that regardless of the region vulnerable roads users are a disproportionately high total of the road user death.
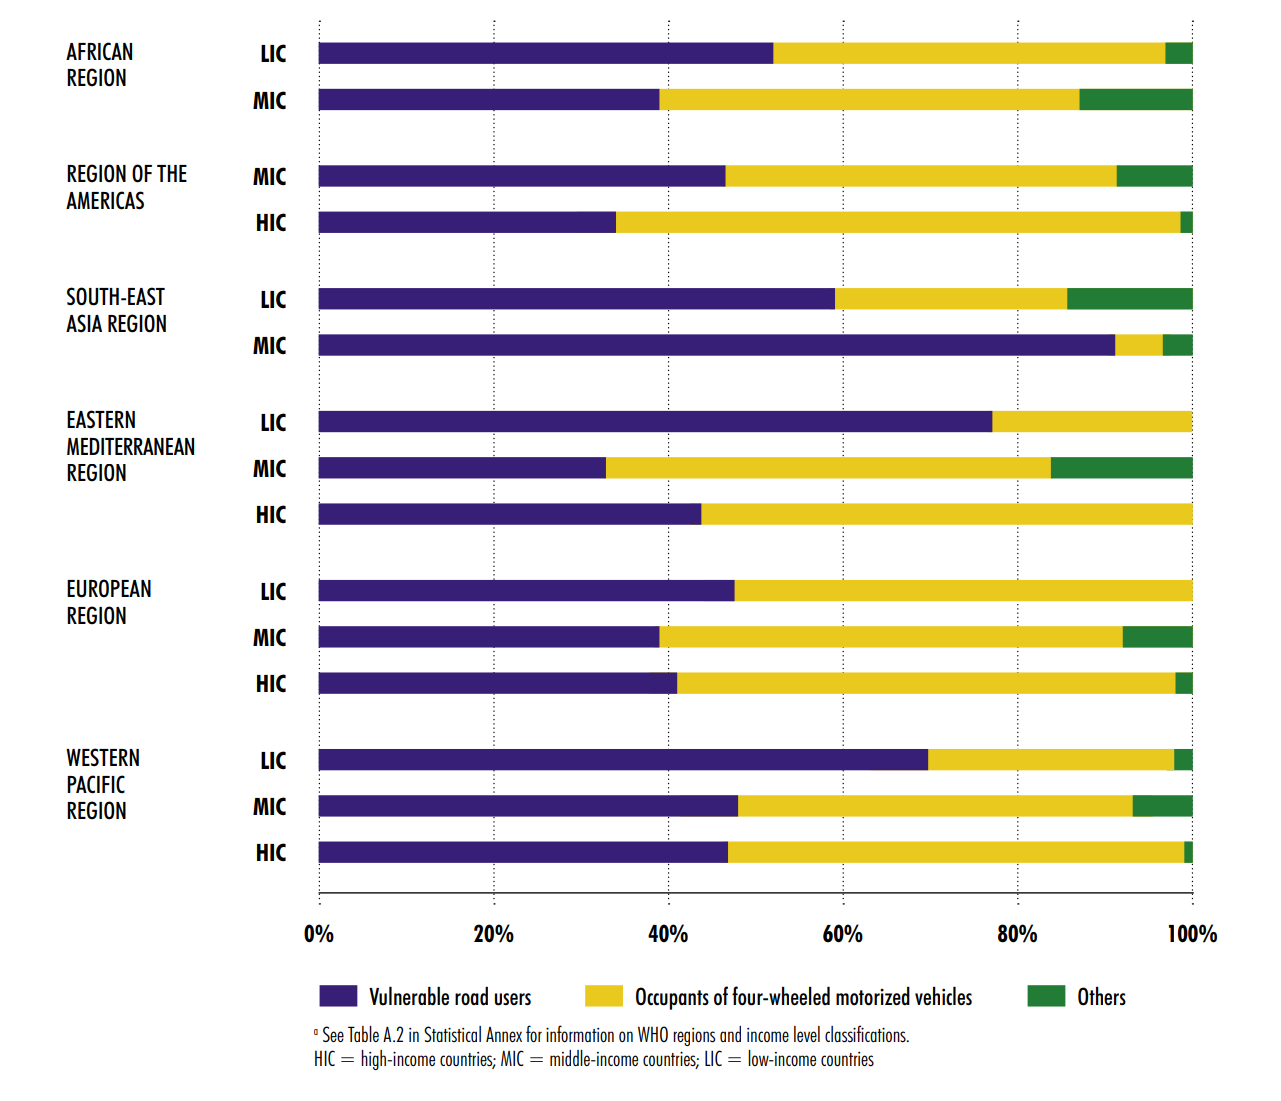
Figure 1.4 Reported deaths by type of road user (%), by WHO region and income group* (Source: WHO, 2015)
Even in HICs, vulnerable road users are often vastly over-represented when rates of death and serious injury are compared. For example, when the distances travelled (billion miles) by different modes of road use were compared, more than 10 times as many pedestrians and cyclists than car drivers lost their lives on Great Britain’s roads in 2011. For motorcyclists, the rate was around 40 times higher (Department for Transport, 2012). The gap is even wider when considering the risk of death or serious injury by billion vehicle miles. For each car driver in Great Britain, more than 20 times as many pedestrians and around 40 times as many cyclists were killed or suffered a serious injury from a road traffic crash. Motorcyclists were exposed to the greatest risk, as they were 75 times more likely to be killed or seriously injured than a car driver (Department for Transport, 2012).
Young adults aged between 15 and 44 years account for 59% of global road traffic deaths (see Figure 1.5); and more than three-quarters (77%) of all road traffic deaths occur among men. In high-income countries, the proportion of deaths among those over 70 years is noticeably greater than in LMICs. Key exposure factors, such as longevity in these countries, combined with the greater risk posed by increased frailty, will contribute to these outcomes (WHO, 2013a).
.")
Figure 1.5 Proportion of road traffic deaths by age range and country income status - Source: WHO, (2013a).
There is substantial variation in the road traffic death rates between different regions and within regions (see Figure 1.6). The reported risk of fatal injury is greatest in Africa at 26.6 per 100,000 populations and lowest in the European region at 9.3 per 100,000 population. Within regions, taking under-reporting of road fatalities into account, it is estimated that over half of African countries may have death rates of 30 per 100,000 population or more (AfDB, 2012).
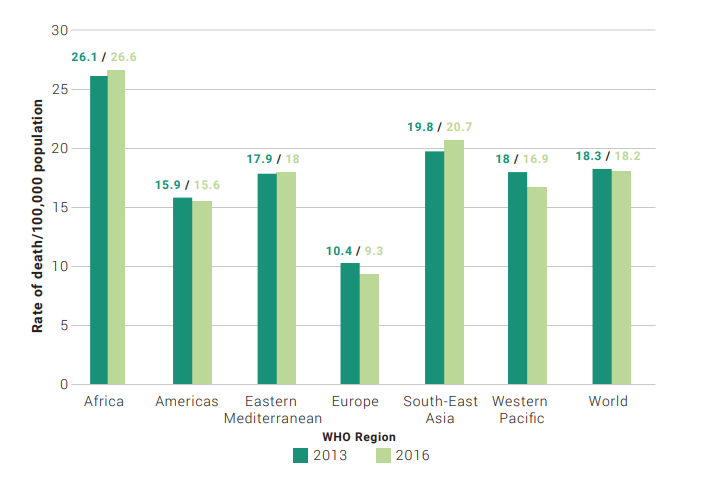
Figure 1.6 Rates of road traffic death per 100,000 population by WHO regions: 2013, 2016 (Source: WHO 2018)
As shown in Figure 1.6, in four out of six WHO regions, car occupants are the largest fatal casualty group.
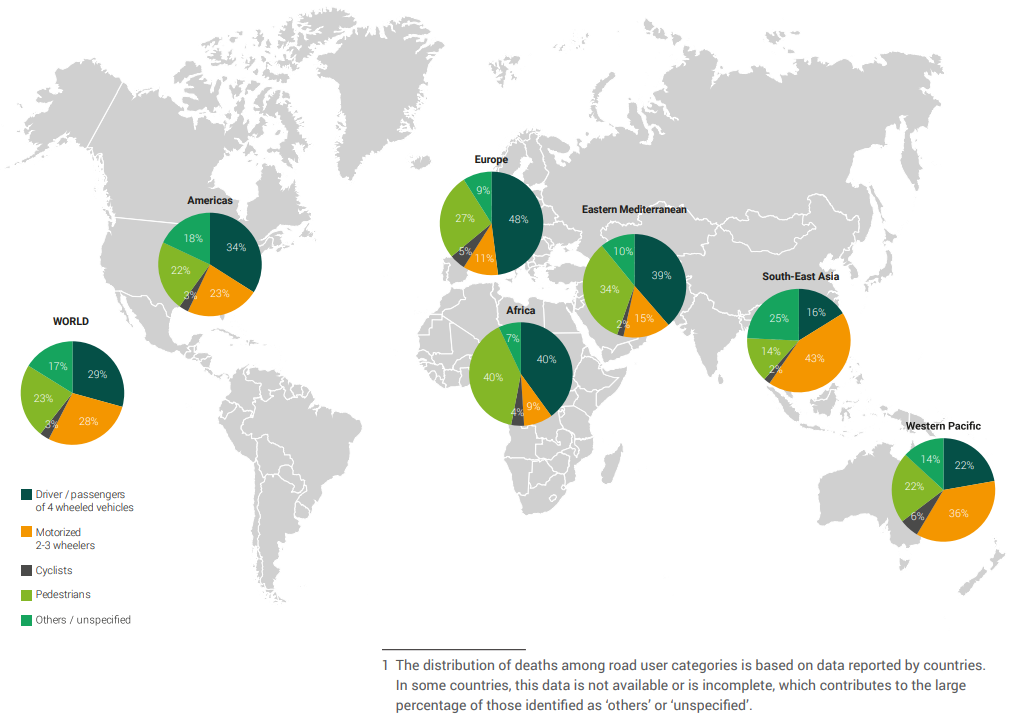
Figure 1.7 Distribution of road traffic deaths by road user type by WHO Region (Source: WHO, 2018)
In Africa, Europe, the Americas, and Eastern Mediterranean most deaths from road traffic crashes involve car occupants. Africa has the highest proportion of pedestrian and Cyclist fatalities representing 44% of deaths. In South-East Asia and Western Pacific, the majority of deaths are riders of motorized two- and three-wheelers with 43% and 36% respectively (WHO, 2018).
Modelling of historic global trends indicates that if LMICs choose to follow the costly evolutionary path of HICs in reducing deaths and serious injuries as they built knowledge, then the road death toll in LMICs is likely to increase very substantially (Kopits and Cropper, 2003; WHO 2013b). Latest forecasts indicate that, based on current trends, 96% of the global total of road deaths by 2030 are likely to occur in LMICs (WHO, 2013b).
The highest projected regional death rates (deaths per 100,000 persons) to 2030 are in Sub Saharan Africa (38), South Asia (29) and the Middle East and North Africa region (28) with decreasing rates between 2015 and 2030 in the East Asia and Pacific and Latin America and Caribbean regions and, most sharply, in the European and Central Asia regions (See Table 1.2). There is large regional variation in LMICs in the number of deaths per 100,000 persons with the highest rates being 4 times higher than the lowest. By 2015, the death rate from road traffic crashes was forecast to be around 8 per 100,000 persons in HICs decreasing to 6 by 2030 but nearly 20 in 100,000 persons in LMICs (WHO, 2013b).
| World (World Bank regions) | Deaths per 100,000 persons | |
|---|---|---|
| 2015 | 2030 |
South Asia | 21 | 29 |
East Asia and Pacific | 22 | 18 |
Sub-Saharan Africa | 25 | 38 |
Middle East and North Africa | 26 | 28 |
Latin America and Caribbean | 20 | 19 |
European and Central Asia | 14 | 9 |
High-income countries | 8 | 6 |
Global total | 20 | 22 |
Source: WHO, (2013b).
The relative importance of road traffic injury to other disease burdens is also predicted to increase steeply. Forecasts of global mortality trends to 2030 indicate that road traffic injury is set to increase from the 9th to the 7th cause of death, as shown in Figure 1.8 (WHO, 2013b).
Country road safety management capacity reviews and other studies reveal that most road deaths and serious injuries occur on a relatively small proportion of the road network. Such roads usually have both urban and rural sections. In India, around two-thirds of deaths occur on national and state highways, which account for just 6% of the network (Mohan et al., 2009). In Bangladesh, just 3% of arterial roads account for 40% of the road deaths (Hoque, 2009). Statistics from a wide range of countries show that typically, around 50% of deaths occur on just 10% of the road network (McInerney, 2012). These roads have high strategic priority, attract large investment, and are particularly amenable to targeted road safety treatments (GRSF, 2013).
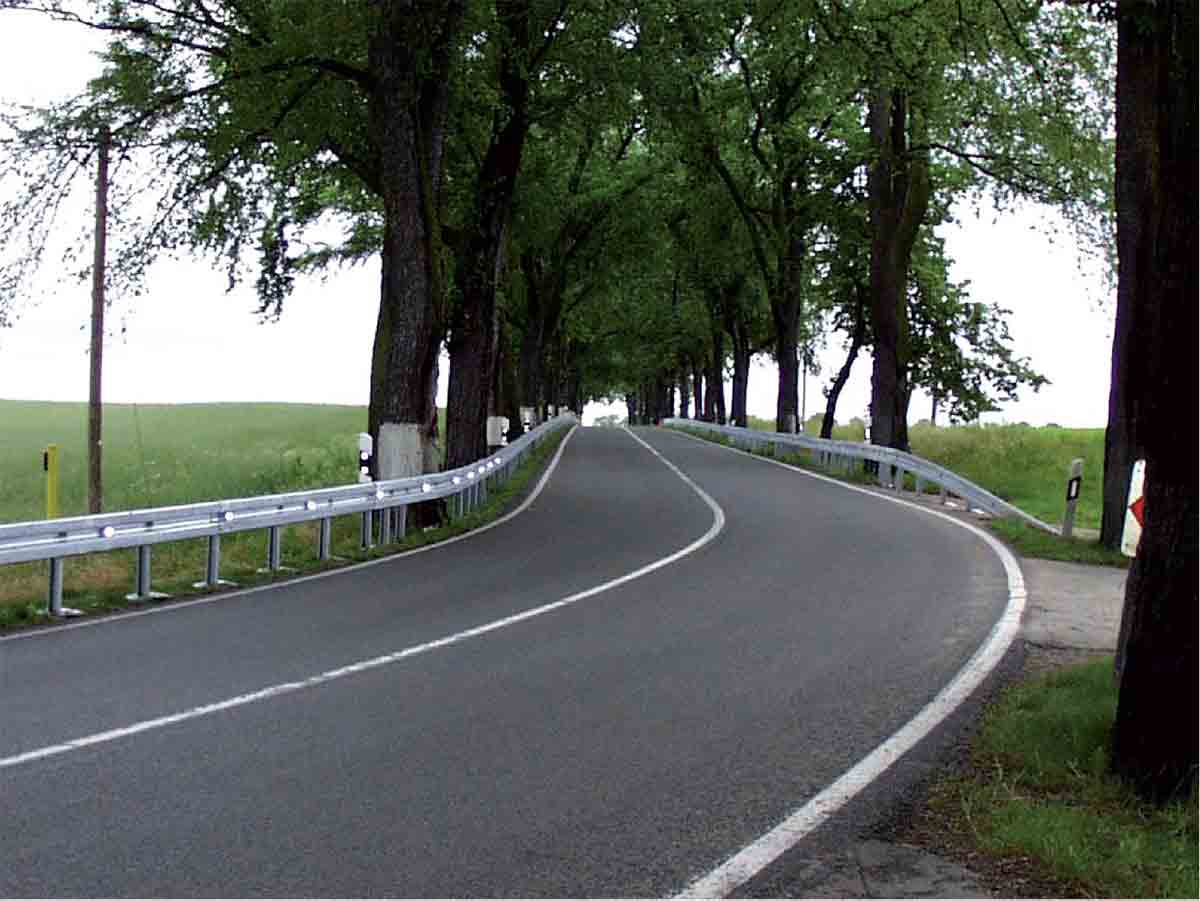
Typically, in the main road network, traffic volumes and vehicle speeds are high, with a mix of motorised traffic and non-motorised users, and mixed speed road environments (Commission for Global Road Safety, 2011; GRSF, 2006–2013; UNRSC, 2011b). A key problem is that many road standards used in road projects in LMICs do not provide for the degree of human vulnerability involved in the use of the road network. Furthermore, the efficient and effective police enforcement of safety behaviours, which contribute to the overall safety performance of road safety engineering standards in high-income countries, is lacking. Junction design standards and the management of road use from low- to high-speed environments expect vulnerable road users to compete successfully against faster, bigger vehicles, with tragic consequences (GRSF, 2010, 2011). While new roads bring new opportunities for development, many increase the risk of death and serious injury where roads are not restricted to through-traffic, where linear settlements are not avoided, and where there is no first class provision for pedestrians, cyclists and other vulnerable road users (UNRSC, 2011b). Specific global guidance to assist with project design for the road safety management of corridors is provided in Targets and Strategic Plans and in Planning, Design & Operation of this manual as well as global references on this issue (e.g. UNRSC, 2011b; GRSF, 2009, 2013; Breen et al., 2013).
The main crash types on the world’s roads have been identified as follows (UNRSC, 2011b):
Further information is provided on the main crash types in Section Crash Causes and in Part Planning, Design & Operation.
Road safety problems in low-, middle- and high-income countries are found across road safety management systems, including in:
LMICs present some particularly complex challenges for road safety work. Weak road safety management capacity as well as the lock of road safety research facilities in many countries presents a large barrier to road safety progress (GRSF, 2006–2013, PIARC 2023). Road safety progress will be linked to other development priorities such as:
Country road safety investments in LMICs will have to be sustained over a long period and across a range of sectors, directed by appropriately resourced governmental lead agency arrangements. Such government-led road safety policy may find its foundation in strong local academic research. Universities and institutes play a critical role in transforming international knowledge about Safe System concepts and principles towards evidence-based measures for the local LMIC context, taking into account local traffic conditions and safety culture (PIARC, 2023)
Full discussion and guidance are provided in subsequent sections on critical success factors for addressing key road safety problems. This will address the needs of LMICs with their own special challenges. It will also provide guidance for HICs that are currently in the process of addressing strict Safe System parameters, which include new speed thresholds as well as the broader environmental and public health drive for more active transport solutions.
Evaluation of the direct and indirect socio-economic costs of the outcomes of road traffic crashes is important. This allows measurement of the burden that road traffic crash injury imposes on society and highlights the return on investment in road safety and the relative benefits and costs of different policy options in the allocation of resources1.
Inadequacies in data collection, serious under-reporting of road traffic injuries, and the lack of an adopted global method in valuing the prevention of death and serious injury, do not allow precise estimates to be made of the socio-economic value of their prevention in LMICs. However, approximate and conservative estimates have been made at global and regional levels. In many HICs, effective practice provides more reliable estimates involving periodic updating of economic values for preventing different injury severities using the willingness to pay method (see Prioritisation & Assessment for further discussion).
Road traffic crashes cost most countries around 3% of their gross domestic product. Low-and middle-income countries are estimated to experience even greater economic losses, losing up to 5% of their gross domestic product (GDP) each year (WHO, 2015). Global costs are even higher if under representation of deaths and injuries in available statistics and the social costs of pain and suffering are fully accounted for. The International Road Assessment Programme has calculated that serious road trauma now costs the world more than US$2.2 trillion per year, or US$6.1 billion every day (iRAP, 2023) (See Box 1.4).
More than 3600 people are killed in road crashes every day. Road crashes are the leading cause of death for young people.
But this is just the tip of the iceberg. More than 100,000 people suffer injuries every day, including severe brain injury, quadriplegia, fractures, internal injuries and burns. Road crashes often result in life-long suffering and disability and place a huge toll on families and communities.
Apart from the emotional impact of serious crashes, the cost of emergency response, trauma wards and long-term health care is immense. Australia's Transport Accident Commission (TAC) claim data shows that more than falf of all cost occur more than two years after a crash, buried deep within health and social welfare systems.
However, there is a signficiant gap in evidence and data about road crash injuries and their costs worldwide. To help support debate about the scale of response to this enormous level of trauma and cost, iRAP has drawn on data from the WHO, TAC, Institute for Health Metrics and Evaluation, and the International Monetary Fund (IMF) to make simple, high-level esitmates of golobal injury types and their costs.
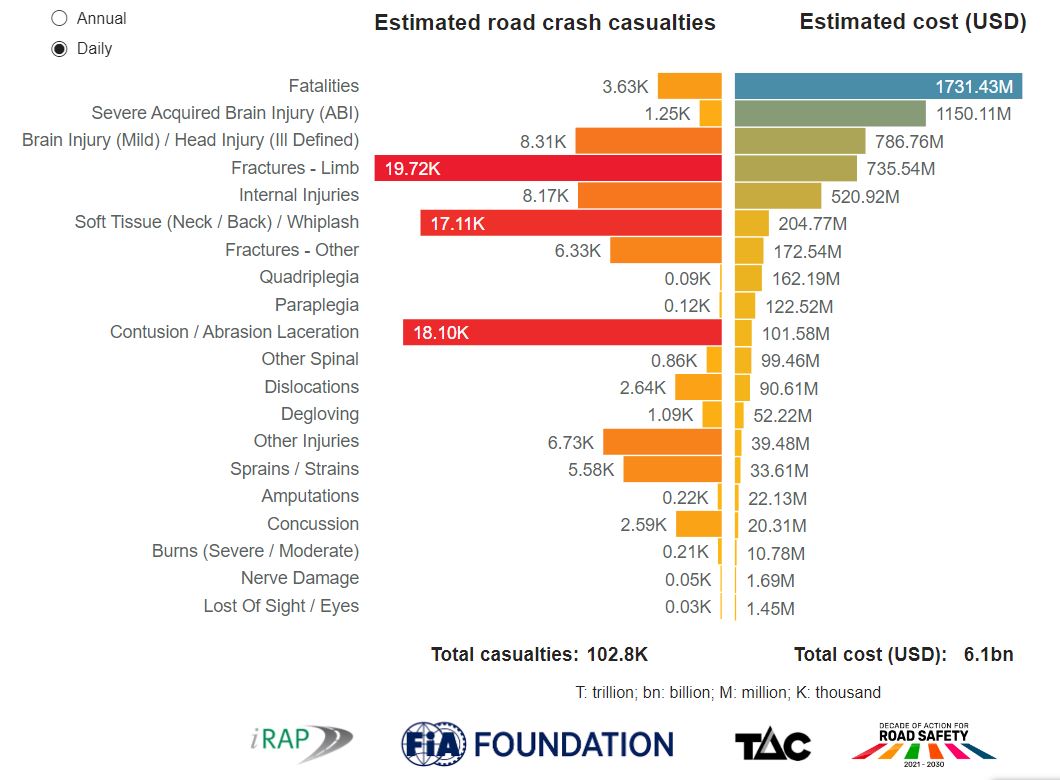
Figure 1.8 Estimated daily road crash deaths, injuries and consts

© ARRB Group
The large burden of costly injuries is borne by society in general. However, a large part of the burden is particularly within the health sector in terms of costs to the emergency medical system, with employers in terms of premature loss or disablement of the world’s most economically active citizens, and with households in terms of loss of the main wage earner. A summary of some of those directly bearing the cost of road injury and death is provided below:
A high price in socio-economic terms is being paid for motorised mobility in all countries of the world. In particular, road traffic injuries in LMICs are a financial drain they can ill afford, which inhibits their desired social and economic development (FIA Foundation for the Automobile and Society, 2005). Road safety investment in both LMIC and HICs needs to be scaled up to match the high socio-economic values of preventing death and serious injury in road crashes (WHO, 2009; DaCoTa, 2012c).
Improving global road safety is now linked with the broader vision of sustainable development and priorities addressing the s of the child, public health, poverty reduction and social inclusion, and occupational health and safety.
Following five successive UN resolutions on ‘Improving road safety’ since 2004, the UN Rio Conference of world leaders highlighted in discussion of the Future We Want (UN, 2012) ‘the importance of the efficient movement of people and goods, and access to environmentally sound, safe and affordable transportation as a means to improve social equity, health, resilience of cities, urban-rural linkages and productivity of rural areas. In this regard, we consider road safety as a part of our efforts to achieve sustainable development’ (UN, 2012).
Road safety is now formally recognised as part of the 2030 Agenda for Sustainable Development with two targets in the Sustainable Development Goal (SDG) framework that specifically address road safety: SDG target 3.6 on halving the number of global deaths and injuries from road traffic crashes: and SDG target 11.2 on providing access to safe, affordable, accessible and sustainable transport systems as well as improve road safety for all. Importantly, road safety also has links to any related targets, such as SDG target 1 on poverty, SDG target 5 on gender equality, and SDG target 8 on decent work and economic growth (United Nations, 2016). The World Health Organization (WHO) has also collaborated with other United Nations agencies and regional commissions and the UNRSC to develop12 voluntary Global Road Safety Performance Targets (WHO, 2017).
In national transport policy, safe, clean and affordable mobility goals are set increasingly to realise the associated co-benefits of integrated initiatives (see Box 1.5).
Similar national transport policy statement incorporating safe, clean and affordable mobility goals are increasingly being adopted in LMICs to guide efforts towards safe and sustainable road transport systems (see Box 1.6)
Despite the rapid growth in motorised traffic, the main modes of travel in LMICs are likely to remain walking, motorcycling, cycling and public transport (Kopits & Cropper, 2003). This highlights the importance of planning and providing for the safety needs of these road users (particularly for pedestrians, as the most vulnerable road users), who sustain a high proportion of road traffic injuries, as well as integrating safety into developing road networks for cars, vans, buses, and trucks.
Significant co-benefits can be achieved for the environment and public health. For example, land use and transportation planning, the provision of safer infrastructure facilities to promote increased walking and cycling, and measures to reduce vehicle speeds, will also result in less greenhouse gas emissions and local air pollution, greater energy security, and improved physical wellbeing (GRSF, 2009). Other means include reducing the volume of motor vehicle traffic by providing for public transport and pursuing livable city policies; providing efficient networks where the shortest or quickest routes coincide with the safest routes; and encouraging road users and freight to switch from higher risk to lower risk modes of transport (Peden et al., 2004).
In some instances, road safety policy can be in conflict (or be perceived to be in conflict) with other societal needs and policies. However, safe, clean and affordable mobility goals for transport policy provide a means for seeking integrated solutions that address competing societal goals, such as public health (Peden et al., 2004), the of the child and citizen (see Box 1.5), poverty reductions, social equity priority, occupational health and safety, and educational goals (Watkins & Sridhar, 2009).
Aeron-Thomas A, Jacobs GD, Sexton B, Gururaj G & Rahman F (2004), The Impact of Crashes on the Poor. Study commissioned from TRL by GRSP with funding from the Swedish International Development Cooperation Agency (Sida) and TRL, Crowthorne.
AfDB (2012), Road Safety in Africa: an overview, African Development Bank, MDBs Training Initiative Global Road Safety Facility, Washington DC.
Austroads (22018) Research report AP-R562-18: Best Practice in Road Safety Infrastructure Programs, Canberra.
Belin M-A, Tillgren P & Vedung E (2012), Vision zero – a road safety policy innovation, International Journal of Injury Control and Safety Promotion Volume 19, Issue 2, 2012, pages 171-179
Bhalla K, Shahraz S, NaghavI M, & Murray C (2008), Estimating the potential impact of safety policies on road traffic death rates in developing countries, 9th World Conference on Injury Prevention and Safety Promotion, Merida, Mexico
Bliss T (2011), Global Directions in Road Safety, Strategic Road Safety Forum, Monash University Accident Research Centre, Melbourne
Bliss T & Breen J (2011), Improving Road Safety Performance: Lessons From International Experience a resource paper prepared for the World Bank, Washington DC for the National Transport Development Policy Committee (NTDPC), Government of India, Delhi. (From following link, go to 'Papers received from the World Bank as technical assistance', and then go to 'WB Papers on the Highway Sector by Clell Harral, See Resource Paper 5. http://planningcommission.nic.in/sectors/index.php?sectors=National%20Transport%20Development%20Policy%20Committee%20(NTDPC)
Breen J, Humphries R & Melibaeva S (2013), Mainstreaming road safety in regional trade corridors, Sub-Sahara Africa Transport Programme (SSATP), Washington.
Commission for Global Road Safety (2010), Bad Trips: International tourism and road deaths in the developing world, Makes Road Safe Campaign, London
Commission for Global Road Safety (2011), Make Roads Safe: Time for Action, London.
Commission for Global Road Safety (2013), Safe Roads for All, London.
Commission of the European Communities (CEC) (2003), European Road Safety Action Programme. Halving the number of road accident victims in the European Union by 2010: A shared responsibility COM(2003) 311 final, 2.6.2003, Brussels.
DaCoTA (2012a), Cost-benefit analysis, Deliverable 4.8d of the EC FP7 project DaCoTA, Brussels.
DaCoTA (2012b), Work-related road safety, Deliverable 4.8v of the EC FP7 project DaCoTA, Brussels.
DaCoTa (2012c), Road Safety Management, Deliverable 4.8p of the EC FP7 project, DaCoTa, Brussels, http://safetyknowsys.swov.nl/Safety_issues/pdf/Road%20Safety%20Management.pdf (viewed March 2013).
Department for Transport (2012), Reported road accidents and casualties, Great Britain 2011, Table RAS 30070, https://www.gov.uk/government/statistical-data-sets/ras30-reported-casualties-in-road-accidents.
European Commission (2009), Public consultation of the European Road Safety Action Programme 2011-2020, Brussels.
European Transport Safety Council (2011), 2010 Road Safety Target Outcome: 100,000 fewer deaths since 2001, 5th Road Safety PIN Report, European Transport Safety Council, Brussels.
FIA Foundation for the Automobile and Society (2005), Road safety counting the cost, London.
Global Road Safety Facility (GRSF) (2006-2013), Unpublished road safety management capacity reviews, World Bank, Washington DC.
Global Road Safety Facility (GRSF) (2009), Implementing the Recommendations of the World Report on Road Traffic Injury Prevention. Country guidelines for the Conduct of Road Safety Management Capacity Reviews and the Specification of Lead Agency Reforms, Investment Strategies and Safe System Projects, World Bank, Washington DC.
Global Road Safety Facility (GRSF) (2013), Bliss T & Breen J,, Road Safety Management Capacity Reviews and Safe System Projects, World Bank, Washington, DC.
Graham D, Glaister S & Anderson R (2005), The effects of area deprivation on the incidence of child and adult pedestrian casualties in England. Accident Analysis and Prevention, 37, 125–135.
Gururaj G (2008), Road traffic deaths, road injuries and disabilities in India: current scenario, The National Medical Journal of India 2008, 21: 14–20.
Hoque MS (2009), Unplanned Development and Transportation Problems of Dhaka City, International Symposium on Vulnerability in Cities, University of Tokyo, 25–27 March, Tokyo
Institute of Health Metrics and Evaluation IHME (2013), Global Burden of Disease: Generating Evidence, Guiding Policy, Institute of Health Metrics and Evaluation, University of Washington, Seattle, USA.
International Road and Traffic Accident Database (IRTAD) (2012), Road Safety Annual Report 2011, ITF/OECD, Paris.
International Standards Organization (ISO) (2012), 39001: Road Traffic Safety (RTS) Management Systems Standards, Requirements with Guidance for Use, Geneva.
iRAP (2023), Safety Insights. https://irap.org/safety-insights/global-toll/International Road Assessment Programme, London.
iRAP (2023), Policies into practice. https://irap.org/policies-into-practice/International Road Assessment Programme, London
Jacobs G, Thomas AA, & Astrop (2000) A, Estimating global fatalities, TRL Report 445, Crowthorne.
Koornstra MJ, Mathijssen MPM, Mulder JAG, Roszbach R, & Wegman FCM (1992), Naar een duurzaam veilig wegverkeer; Nationale Verkeersveiligheidsverkenning voor de Jaren 1990/2010. [Towards sustainable safe road traffic; National road safety outlook for 1992/2010] (In Dutch). SWOV, Leidschendam.
Kopits E & Cropper M (2003), Traffic Fatalities and Economic Growth, World Bank, Washington DC.
McInerney R (2012), A World Free of High Risk Roads, International Assessment Progamme, Presentation to Millennium Development Bank Training Programme, World Bank, Tunis.
Mohan D, Tsimhoni O, Sivak M & Flannagan M (2009), Road safety in India: challenges and opportunities, University of Michigan Transportation Research Centre.
OECD (2008). Towards Zero: Achieving Ambitious Road Safety Targets through a Safe System Approach.OECD, Paris.
ORSA (2011), Corporate Reputation http://etsc.eu/wp-content/uploads/business_case_praise_final.pdf , Birmingham.
Peden M, Scurfield R, Sleet D, Mohan D, Hyder A, Jarawan E & Mathers C eds. (2004), World Report on Road Traffic Injury Prevention, World Health Organization and World Bank, Geneva.
Peden M, Oyegbite, K, Ozanne-Smith, J, Hyder, A, Branche, C, Rahman, A, Rivara, F, & Bartolomeos, K (2008), World Report on Child Injury Prevention, World Health Organization and UNICEF, Geneva.
PIARC (2023), Road Safety in LMICs: Identification and analysis of specific issues - a PIARC literature review, 2023RO7EN, Technical Committee 3.1 Road Safety
Smil V (2008), Global Catastrophes and Trends: The Next Fifty Years, MIT Press.
Tingvall C (1995), The Zero Vision. In: van Holst, H., Nygren, A., Thord, R., eds Transportation, traffic safety and health: the new mobility. Proceedings of the 1st International Conference, Gothenburg, Sweden Berlin, Springer-Verlag, 1995:35–57.
Vagverket (2007), Tylosand Declaration, https://online4.ineko.se/trafikverket/Product/Detail/44598.
United Nations General Assembly Resolution 44/25 (1989) Convention on the Rights of the Child, Geneva.
United Nations General Assembly Resolution 64/255 (2010), Geneva.
United Nations Open Working Group on Sustainable Development Goals, (2014), Outcomes Document, Geneva.
United Nations Rio+20 (2012). Outcome Document of the UN Rio+20 Conference, Geneva.
United Nations Road Safety Collaboration (UNRSC) (2011a), Global Plan for the Decade of Action for Road Safety 2011 – 2020, World Health Organization, Geneva.
United Nations Road Safety Collaboration (UNRSC) (2011b), Safe Roads for Development: A policy framework for safe infrastructure on major road transport networks, World Health Organization, Geneva.
United Nations (2016) Transforming our word: The 2030 agenda for sustainable development - https://sdgs.un.org/2030agenda
Watkins K & Sridhar D (2009), Road traffic injuries: the hidden development crisis, A policy briefing for the First Global Ministerial Conference on Road Safety, Moscow.
World Health Organization (WHO) (2007), A report on International Travel and Health, World Health Organization, Geneva
World Health Organization WHO (2009), Global Status Report on Road Safety, World Health Organization, Geneva.
World Health Organization WHO (2013a), Global Status Report on Road Safety, World Health Organization, Geneva.
World Health Organization WHO (2015), Global Status Report on Road Safety, World Health Organization, Geneva.
World Health Organization WHO (2018), Global Status Report on Road Safety, World Health Organization, Geneva.
World Health Organization WHO (2013b), Global Health Estimates Summary Tables: Projection of Deaths by Cause, Age and Sex by various regional grouping. Geneva, World Health Organization, 2013. Available at http://www.who.int/healthinfo/global_burden_disease/projections/en/index.html.