
Once risk locations have been identified, and relevant information analysed to identify the likely causes, there is a need to select interventions and prioritise these for action. Figure 11.1 shows how these fit within the Road Infrastructure Safety Management process for managing safety.

Figure 11.1 Intervention selection and prioritisation within the Road Infrastructure Management process
There is a cost associated with every road safety infrastructure intervention. Every country has a limited budget available with which to make road safety improvements, and so it is important to ensure that reductions in deaths and serious injuries are maximised within the budget available. This requires good knowledge about the effectiveness of road safety interventions in different circumstances. It also requires a process to help prioritise the installation of safety treatments. Interventions are the individual and collective actions that are taken to address risk. The terms ‘countermeasures’ or ‘treatments’ are also used.
This chapter provides information on the selection and prioritisation of effective road safety engineering interventions. It provides advice on the types of options that are available, and the process and tools that can be used to decide upon the most appropriate options. Intervention options and selection are outlined in Intervention Option and Selection. In order to maximise safety outcomes, a priority ranking method is required, and this is typically based on economic assessment. This process is described in Priority Ranking Methods and Economic Assessments
Several guidelines exist on some of the key crash types that contribute most to death and serious injury. Some of these are aimed at addressing problems in LMICs, and provide information on effective interventions. These include:
PIARC has produced a guide to saving lives around the world with proven countermeasure (see https://www.piarc.org/en/order-library/). The countermeasures highlighted in this guide are notable because they have proven track records of success in multiple countries. Issues and priorities of low- and middle-income countries (LMIC) were inputs used to determine the list of proven countermeasures.
Other documents exist that provide more general advice for these and other key crash types (i.e. they are not specifically targeted at the issues in LMICs). Some of these documents are freely accessible and provide guidance on the following issues.
Run-off-road interventions:
Intersection crashes:
Head-on crashes:
Many other documents can be accessed via the Internet from a variety of sources on these and other crash types. However, care should be taken to ensure that documents accessed from this source have been produced by reputable agencies, and that they provide robust information. Other documents exist that provide advice on a range of crash types and appropriate interventions in an easy to access format. Key documents are listed later in this chapter.
The most cost-effective interventions to target key crash problems are well known. As a starting point, these interventions should be implemented in a targeted way on high risk routes. These include:
An ideal starting point is to implement multi-sector (e.g. including policing and education programmes) demonstration projects on key high-risk corridors utilising these effective interventions. For those just starting this is a useful way to ‘learn by doing’ in a way that is easy to manage.
Economic assessment procedures need to be established, and key staff trained in this process. This will help effectively prioritise limited budgets. It will also help prepare an adequate business case for investing in road safety.
Developing network-wide assessments to guide programme development is an essential part of a comprehensive road safety programme for a road authority. This should be based on a good understanding of system-wide risks and issues. Project-level identification of risk that is consistent with the higher level network-focused programme approach is also required. Both are discussed in Assessing Potential Risks and Identifying Issues. In a similar manner, network-level approaches can be taken to address this identified risk through effective infrastructure interventions. To address system wide issues, wide scale implementation of treatments can be undertaken. This implementation can be at the network, corridor, segment or spot location for differing timeframes.
Perhaps the best documented example of this approach is the implementation of the 2+1 road design scheme in Sweden, as described in the case study below.
As well as network-level implementation of specific treatments (such as the 2+1 design identified above), there is also scope to develop frameworks at that provide guidance on application of treatment types. As an example, a framework has been developed in New Zealand for guiding safety investment decisions based on the level of collective and/or individual crash risk. Figure 11.2 below draws on this approach and illustrates how collective and individual risk could be used to influence about cost effective outcomes. Individual risk refers to road safety risk as it applies to any one road user. It is often expressed as the chance of any given road user being involved in a crash (often in crashes per vehicle kilometre travelled, which takes into account traffic volume. Other metrics are also available. Individual risk is a useful measure for assessing the quality (in safety terms) of road infrastructure. Collective risk refers to the total expected crash outcome for all vehicles (e.g. crashes per kilometre), and is heavily influenced by traffic volume. Using information on collective and individual/personal risk the treatment types can be categorised into four groups:
.")
Figure 11.2 Framework for treatment selection on high risk rural roads - Source: Adapted from Durdin & Janssen (2012).
Roads with high traffic volumes have a high expected number of severe crashes; and those that include road engineering features which are substandard for the function, are likely to score highly in both collective and individual risk areas (the red area in Figure 11.2). Substantial investment into road safety treatments on such roads would often be justified via Safe System Transformation works, e.g. a major upgrade; provision of an alternative, higher quality route; freeway style interchanges, etc. Further examples of these higher cost, but highly effective treatments can be found in Effective Safe System Interventions in Intervention Option and Selection.
Roads that experience intermediate collective and individual risk outcomes fall in the Safer Corridors or Safety Management categories (orange and yellow areas in Figure 11.2). For example, highways in rural areas with moderate traffic volumes, some localised and scattered severe crashes, and compromised road design, may fall in the Safe Corridors area. The most effective treatment approach may be via corridor-wide improvements using a mix of high- and low cost solutions (e.g. safety barrier installations, line-marking, intersection upgrades, etc.).
Safety Management ideas may apply to roads with lower traffic volumes, more scattered severe crashes (e.g. local streets and roads) and consistently inadequate road standards. The best economic return on safety would be via network-wide and/or corridor-based application of low cost treatments, e.g. speed limit revisions, line-marking treatments, or targeted asset management (e.g. pavement resurfacing with associated safety treatments, including shoulder sealing). This group also includes roads with high collective severe crash risk due to high traffic volumes, but with a good overall road safety standard (e.g. urban motorways). The most cost-effective actions may be based on targeted systemic changes, e.g. managed freeways techniques and infrastructure supported enforcement.
Roads with low collective and individual risk (green area in Figure 11.2) are most likely candidates for Safety Maintenance activities. Safety Maintenance often involves incremental and systemic changes such as through road management (e.g. skid resistance management), improvements to signs and line-markings, and other good maintenance practices.
Figure 11.2 shows that as collective and individual risk increases, more extensive treatments are likely to be applicable. As risk progresses to higher categories, benefits from applying treatment options from the lower categories should also be considered.
Although developed and implemented in a HIC, the approach outlined is equally useful in LMICs, particularly in the upgrade of existing road infrastructure. The approach may form an effective way of helping to prioritise road safety activity.
The case study from the Czech Republic provides an example of improving safety through the use self-explaining roads.
Once the problem type has been identified (whether through crash analysis or other forms of risk assessment), the next step in the process involves the selection of an appropriate intervention. The main aims during this stage are:
There are a number of issues to consider when selecting interventions. Usually cost and economic efficiency are the first and foremost considerations, but there are also others. It is important to ensure that the intervention is cost-effective and gives a positive benefit-cost ratio, and that it can be implemented within the available budget. Based on issues identified by Ogden (1996) and BITRE (2012), other considerations include:
A ‘hierarchy of control’ is often used in risk assessment when selecting and prioritising interventions. As an example, Marsh et al. (2013) suggest that such a hierarchy helps identify a priority order for different types of road safety treatment based on outcomes. They suggested a road engineering hierarchy based on the Safe System approach to help address driver distraction and fatigue. The hierarchy has four levels, and it is suggested that level 1 equates to a level of risk where Safe System outcomes are likely:
There are a large number of safety interventions that can be used to improve road safety. Some have only a small impact on safety, while others can produce substantial reductions in death and serious injury. The concept of ‘high-performing’ infrastructure was introduced in The Role of Safer Infrastructure in Safe System Elements and application, and has been discussed in the context of the Safe System approach in several documents. For example,
Turner et al. (2009) present a framework for Safe System infrastructure solutions based on major crash types with a distinction between ‘primary’ and ‘supportive’ road safety treatments.
Primary treatments are those that have the potential to achieve Safe System outcomes or near-zero deaths and serious injuries. This can be achieved through reducing impact forces to safe levels or by separating different road users. A supportive road safety treatment is one that assists with the delivery of safety improvements, but only in an incremental way. For example, a hazard warning sign may reduce the occurrence of crashes (which can include severe crashes), but will have no impact on the severity of a crash, should one occur.
It is strongly recommended that primary treatments are employed where possible to reach the Safe System objectives. ‘Primary’ or ‘Transformational’ treatments should be presented as a first option. If these cannot be used, there would be a preference to next consider treatments that might be a stepping stone with minimal redundancy of investment, to future Safe System implementation. For example, a wide central painted median with audio-tactile lines may be installed with adequate width to allow future application of wire rope median barrier. Primary or ‘Transformational’ treatments to address key crash types are demonstrated in Table 11.1
Crash Type | Treatment “Primary” or“Transformational” | Influence (E = exposure L = likelihood S = severity) |
Head-on |
| L S S L, S |
Run-off-road |
| S S
L, S |
Intersection |
| L, S E L, S L, S L, S |
Pedestrian / Cyclist |
| E L S L, S |
Motorcyclist |
| E
|
(Source: Adapted from Austroads, 2016)
Below are some further examples of illustrated primary Safety System treatments (Figure 11.3)


Figure 11.3 Examples of Primary Safe System treatments - Source: Photos courtesy of ARRB Group Ltd unless otherwise stated.
Issues specific to LMICs regarding the use of such treatments are discussed further in Intervention Effectiveness in LMICs in Intervention Option and Selection.
NZTA (2011) refers to Safe System Transformation treatments for rural roads. These are defined as treatments that are likely to address high percentages of the fatal and serious injury crashes associated with of the three key crash types for rural roads (run-off-road, head-on and intersection crashes). It is recognised that these treatments are typically higher cost, and that they need to be implemented over a longer time period. Examples of such treatments include expressways (4-laning and 2+1 treatments), median and roadside barriers, grade separation (overpasses and interchanges), roundabouts, and effective speed management. New Zealand also provides a framework that encourages investment in Primary or “Transformational” treatments as standard safety interventions (NZTA, 2021).
The following case studies in Hungary demonstrate innovative use of primary Safe System treatments in a temporary, or low cost, application.
Where a primary solution is not feasible due to project constraints dictated by budget, site, conflicting road user needs, or the environment, the next safest “supporting” Safe System solution needs to be identified. Ideally, supporting treatments should act as stepping stones towards better Safe System alignment and be compatible with future implementation of Safe System options. In most cases, supporting treatments are those that reduce the likelihood of a crash but do little do reduce the severity outcome. For example, a wide centreline will help to reduce the probability of a crash by providing greater separation between opposing traffic flows. However, when a crash occurs the severity of injury is still likely to be high.
The case study from the Germany provides an example of a supporting Safe System treatmnt through the use a painted wide centreline to support overtaking and separate opposing traffic flows.
Supporting treatments that are compatible with future implementation of Safe System options are demonstrated in Table 11.2.
Crash Type | Treatment “Supporting” (compatible with future implementation of Safe System options) | Influence (E = exposure L = likelihood S = severity) |
Head-on |
| L L |
Run-off-road |
| S
L L, S |
Intersection |
| L, S
E L, S
|
Pedestrian / Cyclist |
| L, S L E L E, L
|
Motorcyclist |
| L
|
There are numerous additional supporting treatments that have little or essentially no effect on future implementation of primary Safe System options such as consistent delineation, skid resistance improvement, improved superelevation, audio-tactile edge and centre lines, vehicle activated signs, turning lanes, advanced direction signage and warning, improved site distance, traffic signals with fully controlled turns, skid resistance improvement, improved street lighting, pedestrian and cyclist signals, cyclist box at intersections, and motorcycle-friendly barrier systems (Austroads, 2016).
Where high risks are present for more than one crash type (as is often the case), combinations of one or more of treatment should be considered. In addition, combinations of supporting treatments, particularly in association with lower speeds, may be adequate to fully address specific crash risks.
Other measures that should also be considered to further mitigate crash risks, particularly in combination with supporting treatments, include speed enforcement, rest area provision, speed cameras combined with red light cameras, lane markings compatible with in-vehicle lane-keeping technology (Austroads, 2016).
One of the most important considerations in selecting interventions is knowledge of the safety benefit of that treatment. This benefit is often described as a crash reduction factor (the expected percentage reduction in crashes), or crash modification factor (CMF, which is the multiplier by which the crashes before treatment are adjusted; e.g. a CMF of 0.8 indicates that there will be an expected reduction of 20% in crashes). A number of sources exist that provide information on this issue (also see Box 11.1):
The Crash Modification Factor (CMF) Clearinghouse (http://www.cmfclearinghouse.org/) is one of the most comprehensive and advanced sources of information on road safety infrastructure effectiveness. Funded by the US Federal Highway Administration (FHWA), it provides a searchable database of information on infrastructure effectiveness. It is constantly updated, meaning that it is one of the most up-to-date sources of information on this topic. The CMF Clearinghouse applies a star rating (from one to five) according to the robustness of each CMF. This rating was updated to be based on study design, sample size, standard error, potential biases, and data source.
 Clearinghouse")
The Crash Modification Factor (CMF) Clearinghouse
Given the objective of the Safe System approach is to eliminate death and serious injury, it is important to understand the effect that different interventions have on fatal and serious outcomes. However, much of the research on intervention effectiveness provides information on casualty reduction (i.e. reduction in deaths, serious injury and minor injury combined) or on change in all crashes (including non-injury). This is an important distinction, and it is unfortunate that information on fatal and serious outcomes is so scarce. Although it is desirable to minimise all crash types, including crashes that do not result in injury, an overall reduction in fatal and serious injury is paramount. Safety professionals should not be put off using interventions that have a neutral effect on minor and non-injury crashes, and there may actually be situations where such crashes will increase (typically through a reduction in severity of the crashes that do continue to occur at a treated location).
In the absence of information on the effect of interventions on fatal and serious crash outcomes, information on casualty reduction should be used, although an element of engineering judgement may also be required when using this information. The expected reduction in fatal and serious crash outcomes is often higher than the reduction in all casualties. As an example, BITRE (2012) found the impact on crashes from installation of roundabouts to be greater for higher severity outcomes:
Similar trends were seen in a European study by Jensen (2013). Therefore, using the casualty reduction will often lead to a conservative value for the expected reduction in fatal and serious injury.
The following matrix (Table 11.3) provides a basic summary of road safety treatment options and their effectiveness on some of the key crash types that result in fatal and serious injury. Detailed information on each of these treatments can be found in the documents referenced in Selecting Interventions in Intervention Option and Selection. Broad indicative costs are also provided.
Table 11.3: Road safety countermeasures matrix
1. head on
2. Junction
3. rear-end
4. run-off-road
5.Motorcycle
6.pedestrians
| Treatment | Crash type | Cost | |||||
|---|---|---|---|---|---|---|---|
| 1. | 2. | 3. | 4. | 5. | 6. | ||
60% or more expected casualty reduction | |||||||
Intersection – roundabout | ✓ | $$ | |||||
Median barrier | ✓ | ✓ | $$ | ||||
Pedestrian crossing – grade separation | ✓ | $$$ | |||||
Pedestrian footpath | ✓ | $$ | |||||
Railway crossing control | ✓ | $$ | |||||
Roadside safety – barriers | ✓ | $$ | |||||
25–40% expected casualty reduction | |||||||
Additional lane | ✓ | ✓ | $$$ | ||||
Motorcycle lanes | ✓ | $$$ | |||||
Duplication | ✓ | $$$ | |||||
Intersection – grade separation | ✓ | ✓ | ✓ | $$$ | |||
Intersection – signalised | ✓ | $$ | |||||
Lane widening | ✓ | ✓ | ✓ | $$ | |||
One-way network | ✓ | ✓ | ✓ | $$$ | |||
Pedestrian crossing – unsignalised | ✓ | $ | |||||
Pedestrian crossing – signalised | ✓ | $$ | |||||
Pedestrian refuge island | ✓ | $ | |||||
Realignment – horizontal | ✓ | ✓ | $$$ | ||||
Restrict/combine direct access points | ✓ | ✓ | $$ | ||||
Roadside safety – hazard removal | ✓ | $$ | |||||
Service road | ✓ | ✓ | $$$ | ||||
Shoulder sealing | ✓ | ✓ | ✓ | ✓ | $$ | ||
Skid resistance | ✓ | ✓ | ✓ | ✓ | ✓ | $ | |
Speed management | ✓ | ✓ | ✓ | ✓ | ✓ | ✓ | $ |
Traffic calming | ✓ | ✓ | ✓ | ✓ | ✓ | $$ | |
10–25% expected casualty reduction | |||||||
Central hatching | ✓ | ✓ | $ | ||||
Central turning lane (full length) | ✓ | ✓ | $ | ||||
Delineation | ✓ | ✓ | ✓ | ✓ | $ | ||
Intersection – delineation | ✓ | ✓ | ✓ | $ | |||
Intersection – turn lanes (unsignalised) | ✓ | ✓ | ✓ | $ | |||
Intersection – turn lanes (signalised) | ✓ | ✓ | ✓ | $ | |||
Parking improvements | ✓ | ✓ | ✓ | $ | |||
Realignment – vertical | ✓ | ✓ | $$$ | ||||
Regulate roadside commercial activity | ✓ | ✓ | ✓ | $ | |||
Rumble strips | ✓ | ✓ | $ | ||||
Side-slope improvement | ✓ | $$$ | |||||
Note: $ = low cost; $$ = medium cost; $$$=high cost.
As can be seen from Table 11.3 speed management is a treatment that is able to address most key crash types. Where speed has been identified as an issue, speeds can be lowered using effective speed management. This will result in fewer fatalities and serious injuries, provided compliance is high or additional enforcement measures are utilised.
The following case studies from Puerto Rico, Portugal, Slovakia, Italy and Hungary all show examples of the effective use of interventions to improve safety.
As can be seen from Table 11.1 speed management is a treatment that is able to address most key crash types. Where speed has been identified as an issue, speeds can be lowered using effective speed management. This will result in fewer fatalities and serious injuries, provided compliance is high or additional enforcement measures are utilised.
Selecting Interventions
Interventions should be selected to suit a particular site, route or area, and to address the crash type occurring at that site, route or area. Crash types can be identified through reactive (crash based) or proactive identification methods (see Assessing Potential Risks And Identifying Issues).
Single interventions can be used, or more commonly combinations of interventions can be selected to combat a particular crash type or issue. The final intervention selection requires expert judgement about the factors that have contributed or may contribute to the occurrence of crashes.
A number of guides provide advice on appropriate interventions to address specific crash problems. PIARC (2023) provides details of road safety countermeasures based on the Safe System approach that have proven track records of success in multiple countries. The effectiveness of each proven countermeasure is noted including recommendations on crash reduction and strategies for practitioners to consider as part of implementation. The countermeasures have also been categorised based on how they address key Safe System principles, such as reducing severity, as well as targeting key crash types and vulnerable road users.
PIARC (2009) provides a detailed set of options in the Catalogue of design safety problems and potential countermeasures. Advice is provided for road function, cross-section, alignment, intersections, public and private services, vulnerable road users, traffic Signing and marking and roadside features. PIARC published The role of Road Engineering in Combatting Driver Distraction and Fatigue Road Safety Risks to highlight Driver Distraction and Fatigue from the view of the safe systems approach. Figure 11.4 shows an example of Hierarchy Level 1 Treatments. The document outlines a hierarchy of treatment approaches and provide engineering solutions to address the problem of driving distraction and fatigue road safety risks. To highlight the issue potential countermeasures for vulnerable road users the Vulnerable road users: Diagnosis of design and operational safety problems and potential countermeasures and appendix were published.
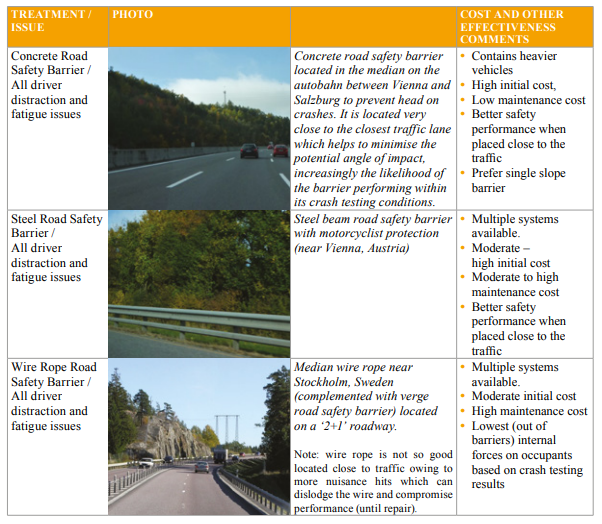
Figure 11.4 Example of Hierarchy Level 1 Treatments
A number of interventions are presented that address safety issues relating to each of these topics. In each case, information is provided on the road safety problem for each issue. Treatment types are then presented, along with photos of the treatment, basic descriptions, indicative costs, crash types addressed, and the affected road user groups. The example below (Figure 11.4) shows potential solutions for issues related to unforgiving roadsides (categorised under Roadside Features).
.")
Figure 11.5 Treatments for unforgiving roadsides from the PIARC catalogue - Source: PIARC (2009).
Several online tools exist that provide similar, and in some cases more detailed information. Some cover a wide variety of treatment types, while others concentrate on particular crash types. Both Austroads (engtoolkit.com.au) and iRAP (toolkit.irap.org) have developed online toolkits that provide guidance on treatment options to address different road safety issues. They are both regularly updated and revised, capturing the most recent findings in road safety. Each includes detailed information on crash problem types and treatments, including indicative costs, safety and other benefits, implementation issues, and references.
The Austroads toolkit is designed to address safety issues identified through crash investigation and road safety audit (safety deficiencies). Detailed information is provided on solutions, including links to relevant design documents. The Road Safety Toolkit is targeted to those working in LMICs, and has been translated into a number of languages, including French, Arabic, Spanish and Mandarin. An image from this toolkit is shown in Figure 11.5.

Figure 11.6 Pedestrian footpath treatments from the Road Safety Toolkit - Source: toolkit.irap.org.
The approach described here builds upon work completed by William Haddon who developed the Haddon Matrix (see Haddon, 1972, 1980). The Haddon matrix provides a tool for looking at factors related to personal attributes, vehicle attributes and environmental attributes before, during, and after a crash. The goal was to have the safety professional consider driver confusion, misperceptions, workload, distraction, and other factors.
The Haddon Matrix considers three phases of a crash 1) Pre-crash which includes those factors that influence whether a crash will occur and then result in injuries: 2) The crash event phase reviewing those factors that will influence crash severity during the crash event; 3) The post crash phase the influence the survivability of crash after the event. To this Milton and van Schalkwyk (2022) expanded on the matrix to provide a framework the directly considered all road users (e.g., the volume of biking and walking) as well as the supporting social safety environment -- consistent with the Safe System approach -- added user mix considerations and interactions between these factors to Campbell et. al., Human Factors Interaction Matrix (2018). The figure below shows the Modified-Haddon Matrix applied to motor vehicle crashes in the Safe System.
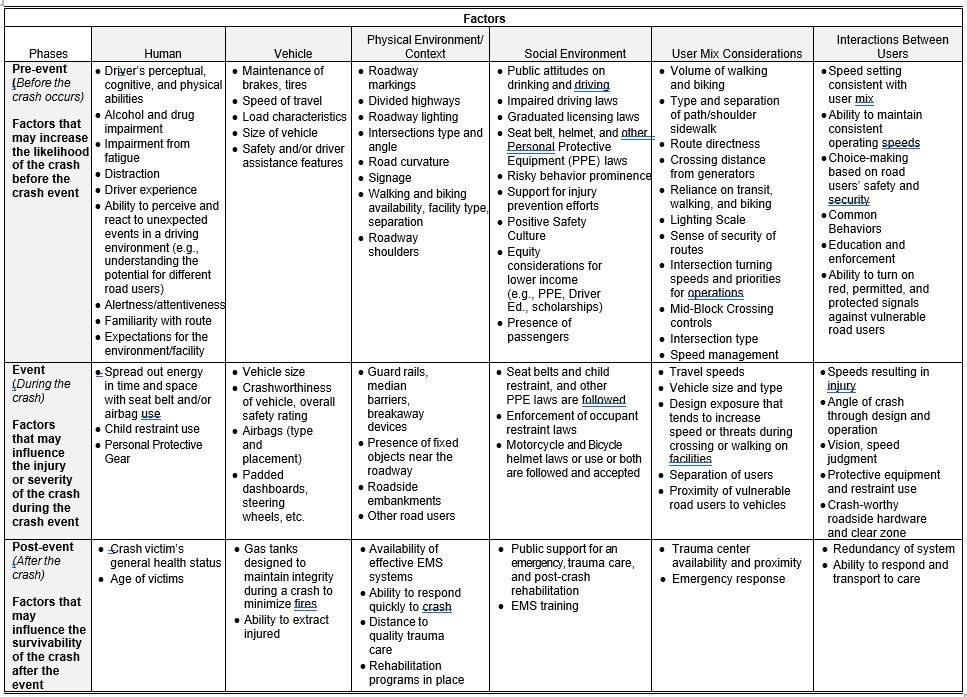
Figure 11.7 Modified-Haddon Matrix applied to motor vehicle crashes in the safe system
Campbell points out that by introducing social environment factors, safety professionals are asked to consider the implications of attitudes, biases and equity decision-making frameworks for humans operating in the roadway environment. Diagnostic assessments are expanded in the effort to incorporate this information. The assessment approach considers laws to reduce severity or frequency of crashes and the road user's willingness to accept those laws and how each of these can be used to address potential safety outcomes.
Equity is considered by assessing more than just vehicles, because one cannot always assume access to vehicles or personal protective equipment., especially within communities that might be lower income or overburdened, and where they cannot purchase a vehicle, bicycle or other protective devices. In many lower income and minority communities sidewalks and lighting may not exist, which leads to lower level of safety and security.
Road user mix is an important consideration as all road users must interact within the context and road environment. For instance, considering how a pedestrian ability to view closing distance and visibility on a rainy day may be negatively affected and lead to increased crash potential.
Although the focus of this manual is on infrastructure interventions, it is important to ensure that multi-sector approaches (e.g. those involving education and enforcement) are considered, as these will often have a greater impact on safety than infrastructure measures alone. This is especially the case in LMICs where there may be lower levels of compliance, or less understanding by the general public regarding the intent of safety interventions. Issues specific to LMICs and intervention effectiveness are discussed in Intervention Effectiveness in LMICs in Intervention Option and Selection while the following case study provides an example of a combined infrastructure and education programme to address pedestrian safety in South Africa.
As another example, the SURE handbooks (particularly the handbook ‘Plan d’actions et realisation des actions’) provide guidance on the French methods for selecting safety interventions on the network (see Box 9.8).
Most of the information on intervention effectiveness is based on research conducted in HICs. Aside from research on behavioural interventions in LMICs, there are very few studies on the effectiveness in these countries, especially the effectiveness of road safety infrastructure treatments. This issue is significant, as it cannot be expected that interventions used in HICs will have the same outcomes when used in LMICs.
This issue has been highlighted in several studies. OECD/ITF (2012) suggests that there are many context/environment-related elements that influence actual crash reduction, and that this is a more critical consideration in LMICs. For example, provision of a hard shoulder might improve safety in a HIC. However, in a lesser developed country it might encourage improper use, such as the installation of stalls for selling items to travellers, which could decrease the overall safety of the roadway. An understanding of these issues of context is obviously critical to the successful implementation of safety treatments.
There also appear to be several barriers to the successful implementation of road safety infrastructure treatments. Turner & Smith (2013) conducted a workshop to identify issues around the implementation of infrastructure treatments in LMICs. Several effective infrastructure treatments were discussed, and barriers for each explored. Although a number of issues were identified for each treatment type, many of these fell into similar categories. These included cost, issues with compliance, design and implementation issues, public acceptance and maintenance.
Cost was raised as an issue for many of the treatments, although interestingly not for all. For some of the highly effective treatments, cost does not appear to be a significant issue. Of greater interest is that issues relating to compliance and design/implementation were raised for more of the treatments than cost. Compliance of treatments by road users is a significant issue in LMICs, and it is very likely that the treatment effectiveness will be lower as a result. Issues that suffered from this compliance issue were:
This issue of compliance indicates the need for a multi-sector response to the road safety issue. The use of safer infrastructure needs to be supported by appropriate education and enforcement, as discussed earlier in this manual.
Design and implementation issues were also thought to have an impact on the effectiveness of treatments. If a treatment is not well-designed and the installation is not of a high standard, the crash reduction potential will not be met. This was considered an issue for all of the treatments discussed. This situation can only be improved through improving the skills and capacity of those working in LMICs, including the sharing of knowledge regarding good practice.
Lastly, maintenance is also an issue that will impact on the crash reduction effectiveness of treatments. It is common for treatments to deteriorate to levels where they become less safe (or possibly to a point where they are higher risk than if the treatment was not present). Appropriate funding is required to ensure that treatments are maintained. Training may also be required regarding the issue of maintenance.
Although all of these issues are likely to be concerns for HICs, they are possibly more pronounced in LMICs, and will certainly have an impact on treatment effectiveness. The extent of this effect is not known, but it can be expected that because of these issues, treatment effectiveness is likely to be different (typically less) than when the same treatments are used in HICs.
Given the absence of good information on treatment effectiveness in LMICs, it is recommended that crash reduction values from HICs be used as a starting point when selecting treatments. However, the issues discussed above need to be carefully considered, and appropriate revisions made to expected benefits. In the longer term it is hoped that the knowledge base regarding treatment effectiveness in LMICs will improve, but this will only occur if appropriate monitoring, analysis and evaluation occurs in these countries (see Monitoring, Analysis and Evaluation of Road Safety). The case study from Puerto Rico shows the effective use of rumble strips to lower roadway departure crashes.
They will be required in order to help eliminate death and serious injury. Many safety treatments currently result in some residual serious crash outcomes, and so improvements to current treatments will be required. As treatments are applied to new situations (including in LMICs) there will be a need to adapt them for better outcomes. There are also a number of highly effective interventions that exist and are used in some countries but not at all in others. There is a need for road agencies and supporting organisations to be innovative and adopt new approaches, provided these are implemented based on an evidence-led approach. It is recommended that road agencies investigate new interventions and learn from overseas experiences.
Reasons that some highly effective treatments are not used in some countries include:
Road agencies should be careful in their selection of new treatments, ensuring that they have been rigorously tested and have demonstrated safety benefits. Demonstration projects can be an effective way to assess promising treatments, and prepare for a wider roll-out (see Strengthening Capacity to Set and Deliver Targets.)
It is suggested that a methodological approach be taken towards innovation, outlined in the following steps:
A number of the reference documents highlighted earlier in this chapter provide innovative examples of road safety infrastructure treatments. Some agencies actively promote certain treatments (including innovative ones) that they would like to see used more often (e.g. FHWA, 2015, which documents and promotes proven safety countermeasures; while information on innovative intersection design including videos can be found here: http://www.fhwa.dot.gov/everydaycounts/edctwo/2012/geometrics.cfm). Many national and local studies have been undertaken to assess innovative treatments with promise. These studies are usually undertaken by universities and research institutes. Information on these trials can be found in international journals and at conferences, although care should be taken to ensure that such information is robust.
The case studies below provide an example of innovative use of intelligent transport systems (ITS) in Thailand and pedestrian and cyclist crossings at tram and transit lines in Germany.
The previous chapter discussed how to identify risk, while the earlier part of this chapter discussed the use of effective interventions to address the risks that have been identified. The next important step is to determine the priority of different treatments. In most situations, there are likely to be financial constraints, which means that not all worthy projects or programmes can be funded. Therefore, a method is needed to identify which projects/programmes should be undertaken as the highest priority. There are also likely to be several options for addressing a risk, and it is necessary to see which of these options will produce the best safety benefit for the cost. Economic appraisals or evaluations provide a comparison basis which can be used for prioritising, comparing and selecting road safety interventions. They help identify measures that yield the highest social return.
At the strategic level, it may also be necessary to establish the relative importance of proactive and reactive measures and decide on the budget proportion that will be allocated to each approach. The guidance provided in this chapter can be used at the strategic, programme or project level.
PIARC (2012) has produced the State of the practice for cost-effectiveness analysis, cost-benefit analysis and resource allocation document, which provides comprehensive advice on methods to appraise projects and allocate resources. This document defines project appraisal as an assessment of the value of a project in order to establish whether the project meets the country’s economic and social objectives. Evaluation approaches include cost-effectiveness analysis (CEA) and cost-benefit analysis (CBA) (also referred to as benefit-cost analysis (BCA)). The outcome indicators from this analysis (BCR, NPV, FYRR and IRR) are discussed in Assessment Criteria in Priority Ranking Methods and Economic Assessments. The following sections provide a summary of some of the key material on these issues.
Cost-effectiveness analysis involves comparing the cost of a proposed countermeasure with the outcome or effect it produces. Within cost-effectiveness, projects are ranked and screened according to their cost and effectiveness in improving road safety or achieving policy objectives. Effects are generally expressed in non-monetary units, e.g. the change in the number of crashes. Cost-effectiveness is mainly applied when comparing alternative projects, programmes and policies with a similar outcome. The cost-effectiveness is expressed as the cost-effectiveness ratio (CER), which is calculated by dividing the number of crashes prevented by the cost of the measure.
Cost-benefit analysis uses monetary values to compare total benefits with total costs of any given policy, programme or project. It is mainly used to determine the worth of an investment based on the total benefits and costs of the investment, and to compare a project with any alternative projects. Cost-benefit analysis is used in road safety economic appraisal to help build a business case and secure funding for different projects or programmes. It enables comparisons between alternative road safety measures, identifying both the cost and the benefits to society as a whole to determine if the project should be undertaken and to establish priorities for approved projects. This, in turn, encourages the efficient allocation of limited resources to competing policies.
Yannis et al. (2008) provide a useful summary of cost-effective infrastructure interventions in an analysis for the Conference of European Directors of Roads (CEDR). They examined 55 road infrastructure investments, including reviews of both the costs and benefits of each. Based on this analysis they identified several best practice examples that should be considered in the efficient planning of investments. The cost-effective intervention options were:
The key data requirements or parameters for estimating countermeasure benefits and costs are as follows:
Initial costs refer to implementation costs (e.g. installation, material and labour costs) for each countermeasure. The costs differ by road environment type, traffic volumes, local environment, local labour costs, and availability of materials. There is greater uncertainty surrounding implementation costs in most LMICs as the information is not readily available. The Road Safety Toolkit (http://toolkit.irap.org) outlines general cost levels for different countermeasures. These values can be used as indicative measures where the treatments have not been implemented before or in cases where the cost information is not readily available.
Annual maintenance and operating costs refer to routine and periodic maintenance costs and running costs. The level and regularity of maintenance and associated running costs depend on the countermeasure.
Some countermeasures may have a residual value if they are removed. For example, an intersection may be temporarily equipped with traffic signals for a number of years until a by-pass is completed, and after completion, lower subsequent traffic flows may warrant the removal of the traffic signals. If the countermeasure asset can be used elsewhere, the recovery of this cost should be taken into account. However, in most cases, any residual value is likely to be negligible.
A countermeasure’s service life refers to the time period over which a treatment will deliver safety benefits before major rehabilitation or replacement is required. It varies with:
For projects involving multiple treatments, e.g. network or national blackspot programmes, the service life applied is that of the longest-lived component. Table 11.4 gives example maximum treatment lives for different countermeasures. Given the issues listed above, this is likely to vary substantially for individual projects. As an example, in the US, the treatment life for line-marking is expected to be one year, especially in States that experience snow and ice conditions.
| Treatment type | Recommended maximum treatment life (years) |
|---|---|
Grade separation | 50 |
Realign curve | 35 |
Stagger or realign intersection | 35 |
Roundabout | 30 |
Median barrier | 30 |
Shoulder sealing or widening | 25 |
Add or widen lane (including overtaking lane) | 25 |
Provide acceptable superelevation | 25 |
Railway level crossing barriers | 20 |
Median island (or other island) | 20 |
Guardrail (roadside) | 20 |
Street lighting | 20 |
Remove roadside hazard (trees, pylons, etc.) | 20 |
New traffic signals (hardware and/or software) | 15 |
Improve sight distance by removing impediment on main road | 10 |
Edge marker posts (guideposts) | 10 |
Skid resistant surface | 10 |
Signs (advisory, warning, parking, speed limit, etc.) | 10 |
Raised reflectorized pavement markers | 5 |
Line-marking (thermoplastic) | 5 |
Line-marking (paint) |
Source: Adapted from Turner & Comport (2010).
The main benefits of road safety projects are expressed in terms of monetary savings from crash reductions or prevention of casualties (fatalities and injuries) over a given number of years.
Treatment effectiveness can be expressed as crash modification factors (CMFs). Several comprehensive resources that provide CMFs for different interventions are provided in Intervention Option and Selection, including the CMF Clearinghouse database (http://www.cmfclearinghouse.org/) and the Road Safety Toolkit (toolkit.irap.org). As also discussed previously, the effectiveness and magnitude of crash changes can vary according to their context/environment.
In cases where several treatments are applied at the same location (multiple countermeasures), estimates of overall benefits need to be made. Some approaches have only included the crash savings from the primary or main treatment, but it is preferable that total benefits be calculated. Care needs to be taken to ensure that benefits are not counted more than once for interventions that improve safety in similar ways. For example, to address crashes at a curve, interventions such as advanced warning signs, audio-tactile edgelines, and improved road surface friction may be applied. The total benefit of these treatments will not equal the sum of benefits for each treatment, as each is alike in terms of its effect on crashes. For situations where treatments are linked, an adjustment needs to be made. Although several complex approaches have been devised to calculate the total benefit from multiple treatments, the simple approach outlined by Shen et al. (2004) will usually suffice. They suggest a multiplicative formula similar in form to that shown below:
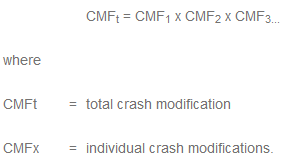
As an example, if three countermeasures are being considered in one location, with CMFs of 0.6, 0.75 and 0.8, the results would be as follows:
CMFt = 0.6 x 0.75 x 0.8
= 0.36, or 36% of crashes will remain (i.e. a 64% reduction in crashes).
A 64% reduction in casualties is obviously less than the 85% reduction that would be calculated if each reduction was added together.
Roberts and Turner (2007) were able to compare safety benefits at locations where packages of treatments were used, with locations where the same treatments were used but as single treatments. By applying the above formula, they identified that this approach tended to overestimate the true benefit of treatments. They suggested the results be multiplied by 0.66 to provide a more conservative approach (for the above example, this would produce a result of 42% reduction).
For a detailed discussion on the effectiveness of multiple treatment projects, see AASHTO (2010), iRAP (2013), and Elvik (2007).
The benefits resulting over time from safety countermeasures are estimated by placing an economic value on crashes and applying this to the expected reduction in crashes. Values should not be derived on a project-by-project basis but should be set at the national level by transport economists and updated annually.
This economic value, referred to as the social cost of crashes, is the value of property damage caused by vehicle crashes, medical and ambulance costs, insurance and administration costs, loss of output costs, police costs, and human costs associated with the pain and suffering caused by death and injury. The different cost components are outlined in Table 11.5.
| Costs per casualty |
|---|
Lost productivity (depending on the underlying hypothesis, gross loss of output or loss of output net of consumption) |
Human costs (loss of life expectancy, physical and mental suffering of the victim, mental suffering of the victim’s relatives and friends) |
Medical costs (medical rehabilitation) |
Non-medical rehabilitation |
Other economic costs. |
| Costs per crash |
Damage to property (including environmental damage) |
Administration costs |
Other costs (e.g. congestion costs, vehicle rental costs). |
Source: PIARC (2012).
There have been many projects and considerable debate about the best way to determine crash costs (Hills & Jones-Lee, 1983; Alfaro et al., 1994; Jacobs, 1995), but it is now generally accepted that only two methods should be considered – the willingness-to-pay (WTP) approach and the human capital (HC) approach. These approaches are summarised in Table 11.6.
| Approach | Description |
|---|---|
Human capital approach (HC) | Measures the impact of crash fatalities and injuries on present and future national output. The main attribute of HC is the present value of gross earnings (before tax). Direct costs such as vehicle costs, medical and emergency services costs are also added to the earnings estimate. In other cases, costs of human pain, suffering and grief are also included in the value of fatalities and injuries. |
The attributes can therefore be summarised as the value of future output loss due to casualties sustained in road crashes and the cost of resources spent to attend to the effects of the crashes. | |
Willingness-to-pay approach (WTP) | The estimates under the HC approach are average values rather than individual ones. |
Measures the amount individuals are willing to pay in order to reduce the risk of death and/or injury. Estimates are obtained from either revealed preferences (observing situations where individuals trade-off wealth or income for risk of death or injury) and stated preferences (individuals indicate how much they are willing to pay in order to reduce risk of death or injury based on hypothetical situations or questions). |
Source: Based on Hills and Jones-Lee (1983).
For a detailed description and discussion of the HC and WTP approaches, see PIARC (2013), HEATCO (2006), Transport Research Laboratory (1995), and Asian Development Bank (2005). Although both approaches are widely used, the willingness-to-pay (WTP) assessment method is generally recommended (DaCoTA, 2012; FHWA 2018; McMahon & Dahdah, 2008).
Costs must be determined for crashes of varying levels of severity, usually fatal, serious, slight or minor, and property damage only. These severity levels have been defined in Effective Management And Use Of Safety Data where it was indicated that a fatal crash involved a situation where at least one person died within 30 days of a crash; while a serious injury crash involved at least one person admitted to hospital, but there were no deaths. A minor crash indicates that at one person received some form of injury, but no one was killed or seriously injured.
For the purpose of prioritising actions aimed at reducing crash frequency, a single average cost for all injury crashes is generally considered sufficient, particularly since it is difficult to predict the specific severities of accidents that might be prevented.
Costs are always based on average values, and in some countries, are also determined for broad road categories (e.g. urban, rural, freeway). The social cost of crashes provides an estimate of the economic burden that different crash and injury types place on the economy. For illustrative purposes, an example of costs by road category and accident severity for the UK in 2012 is shown in Table 11.7.
Costs increase from built-up roads to non-built-up roads to freeways, indicating the effect of greater speeds on crash severity levels. It can also be seen that there are approximately ten-fold increases in costs between severity levels. That is, the cost of a slight crash is about ten times that of a damage only crash, a serious crash is about ten times that of a slight crash, and a fatal crash is about ten times that of a serious crash.
| Cost per casualty UK £ (US$) | Cost per crash UK £ (US$) | ||||
|---|---|---|---|---|---|
| Crash/casualty type | All roads | Urban roads | Rural roads | Motorways | All roads |
Fatal | 1,703,822 ($2,650,064) | 1,914,229 ($2,977,322) | 1,920,372 ($2,986,877) | 1,924,341 ($2,993,051) | 1,917,766 ($2,982,825) |
Serious | 191,462 ($297,793) | 218,109 ($339,238) | 220,524 ($342,998) | 229,358 ($356,735) | 219,043 ($340,697) |
Slight/ minor | 14,760 ($22,957) | 22,773 ($35,421) | 24,559 ($38,199) | 27,857 ($43,328) | 23,336 ($36,296) |
All injury crashes | 50,698 ($78,853) | 62,250 ($96,821) | 109,415 ($170,180) | 74,471 ($115,830) | 72,739 ($113,136) |
Damage only | 1,935 ($3,010) | 2,830 ($4,402) | 2,720 ($4,230) | 2,048 ($3,185) | |
Source: Adapted from Department for Transport (2013).
Calculation of crash costs is generally undertaken at the country level, and development of an accurate figure can be a complex process regardless of which method is used. If no figure is available at the country level, a simple method for obtaining the value of crashes, especially in the absence of the data required for the HC and WTP approaches, is the iRAP ‘rule of thumb’ (McMahon & Dahdah, 2008). This method uses the information from countries that have already carried out WTP calculations, and analyses the relationship between the value of statistical life (VSL) and gross domestic product (GDP) per capita.
The assumptions are (McMahon & Dahdah, 2008 Table 10):
The approach was originally developed using WTP values from a limited number of LMICs. These values were recently updated using a larger dataset (Milligan et al., 2014). The update showed that the rule of thumb tends to underestimate VSL for countries with GDP per capita above $7000 (Milligan et al., 2014).
Generation of crash costs can be a significant issue in LMICs, even with the availability of crash cost estimates, or when using the ‘rule of thumb’. Due to low GDP per capita in many countries, the crash costs can be low, while the cost for installing engineering treatments can remain high. The example (Box 11.5) below illustrates this issue using an example from Papua New Guinea.
When compared with a ‘base option’ that involved minimum surface repairs only and had an almost six-month delay in response between the emergence of serious pavement defects and their repair; the combined NRRSP/KRGMP inputs, if continued over a twenty-year period, could deliver economic benefits of approximately K1.15 billion (approximately US$0.5 billion) with a marginal BCR of approximately 5, excluding crash cost savings. This resulted from prompt pavement repairs, with a monthly cycle of reactive surface maintenance, drainage and shoulder maintenance, and periodic resurfacing, and localised pavement repairs. Where the base option was changed to incorporate pavement strengthening or reconstruction when conditions were seriously deteriorated, the net benefits declined to between approximately K87 million and K629 million, with a maximum marginal BCR of 4.6.
Crash rates were also investigated and revealed a potential for reduction in crash risk by up to 30% from the current figures of approximately 4,000 casualties per year. This reduction was based on an assumed 15% reduction due to improved road surface condition, and a combination of factors such as improved visibility and shoulder conditions.
The total cost of crashes is given by the number of crashes of each type, multiplied by their unit cost of crashes. On this basis, the total cost of crashes is K24.4 million annually. To place this in proportion, it is equivalent to approaching a 2% reduction in all other costs; i.e. crash reductions will boost the cost saving due to improved maintenance by up to 2%.
The above figures are clearly impacted by the value of statistical life applied, noting that the value used is considerably less (by a factor of 42) than that applied in Australia. Furthermore, the relative crash rate for the Highlands Highway is approximately four times the base crash rate of typical Australian roads with similar operating conditions (McLean, 2001; Turner et al., 2009), which is not unexpected.
Consequently, the estimated gross crash costs are approximately 10% of those calculated for similar conditions in Australia. This is likely to have significant consequences for the economic justification of crash mitigation measures, and warrants closer study.
Aspects that require consideration include: a) the value of statistical life, with the possibility that current ‘lost output’ methods take insufficient account of the extended family who are often supported by a ‘bread-winner’ in traditional societies in PNG and elsewhere. The loss of income has potential to affect the education and income-earning opportunities of a generation ; b) the need to account for real increases in income growth in LMICs, and the consequent increase in ‘real’ crash costs; c) the challenge of identifying affordable engineering treatments to mitigate crash risks, noting that the actual cost of road treatments delivered in LMICs and HICs are almost comparable (probably a maximum of 2 to 3 times different), whereas the value placed on the social cost of crashes is some 40 times less.
Alternatively, the value of different injury severities can be derived using quality adjusted life years (QALYs) and disability adjusted life years (DALYs). QALYs measure the value of a fatality prevented, taking into account the quantity and quality of life. They place a weight of one for a year of perfect health and zero for death. DALYs on the other hand, measure the quality of life lost or loss of life years due to illness or injury. They account for the burden of injury or illness and can also be used to measure property damage. DALYs and QALYs are widely used in health economics and very rarely in road safety. An example application of DALYs and QALYs in Colombia road safety is outlined in Box 11.6.
Using the well-established relationship between the value of statistical life and GDP per capita, they used different rules of thumb to estimate the cost of crashes using DALY estimates. These rules are outlined below.
.")
Figure 11.4.Box6 Relationship between VSL and GDP capital - Source: Bhalla et al., (2013).
The unit costs used in the estimation are outlined below.
.")
Figure 11.4.Box6 Relationship between VSL and GDP capital losses - Source: Bhalla et al., (2013).
In any economic road project assessment, it is important to identify a base year from which all future costs and benefits can be assessed. This is because the value of a dollar received in the future is less than the value of a dollar now (also referred to as the ‘time value of money’). The discount rate is used to compare benefits and costs received at different points in time over a project’s treatment life, converting future benefits and costs to present values.
The choice of discount rate can have significant effects on the desirability and selection of projects, especially where benefits and costs accrue later in the treatment’s life. A higher discount rate reduces the value of benefits and costs occurring later in the treatment’s life, favouring projects where benefits occur early in the project. The World Bank recommends present value calculations at 12% discount rates (2014 values) be included in road project business case submissions (see PIARC, 2012; AASHTO, 2010). It is important to note, however, that this value is not necessarily relevant for every country, and the discount rate actually used can be significantly different. For instance, the discount rate is close to 5% in several western European countries.

© ARRB Group
As indicated above, the standard approach for the ranking of treatments is to carry out a cost-benefit analysis, i.e. to compare the estimated benefits of each scheme (in terms of the value of crashes that will be prevented) in relation to its costs (implementation, maintenance, etc.). The treatments are then prioritised in accordance with the best economic returns.
As previously mentioned, estimating likely crash reductions resulting from remedial work is often difficult, because it can only be based on previous experience with similar schemes (Turner & Hall, 1994; Kulmala, 1994; Mackie, 1997).
The selection of countermeasure options is based on the first year rate of return (FYRR), the internal rate of return (IRR), the benefit-cost ratio (BCR), and the incremental benefit-cost ratio (IBCR), as well as net present value (NPV). However, the two main indicators in assessing a project or treatment are the BCR and the NPV. These measures indicate whether the benefits of the proposed treatment outweigh the costs, and if the preferred treatment has the greatest net social benefit.
This is simply the net monetary value of savings and drawbacks anticipated in the first year of the scheme, expressed as a percentage of the total capital cost.

Note that the last two elements might be considered to be small, particularly for low-cost schemes, and are often ignored.
This is not a rigorous evaluation criterion for prioritisation since it ignores any benefits or changes in maintenance costs after the first year. However, it is very simple to calculate, and given that road safety engineering schemes often produce first year rates of return in excess of 100%, more sophisticated decision criteria may not be necessary. This method usually yields high values with low-cost schemes but with relatively small crash savings, and for this reason it is less consistent with the Safe System approach.
The FYRR can also be used to assess the timing of a particular project by comparing it with the discount rate. If the FYRR is greater than the discount rate, the project can, in theory, proceed. This says nothing, however, of how it compares with other projects. If the FYRR is less than the discount rate, the project should, at the very least, be postponed.
More detailed assessments will be needed for schemes where crashes and traffic levels are expected to change substantially from year to year. For example, a scheme with an 80% FYRR may not be worthwhile if subsequent road closures due to the construction of a new road limit the benefit to just one year.
Another important criteria used for assessing costs and benefits of highway schemes is the internal rate of return (IRR). This is the discount rate that makes the NPV equal to zero or makes the BCR equal to one. A theoretical example of how the discount rate affects the NPV of a project is shown in Figure 11.6
.

Figure 11.7 An example of the influence of discount rate on NPV
At discount rates of 8% or 10%, the project has a positive NPV, while it is negative at 12% or 14%. The NPV is zero at 11% discount rate, which is known as the internal rate of return (IRR). The IRR is preferred by multilateral aid agencies, such as the World Bank, because it avoids the use of local discount rates which, depending on their value, can significantly affect the NPV or NPV/PVC ratio. The IRR is not particularly useful for ranking projects, but is included for comprehensiveness.
Benefit cost ratio (BCR) is defined as the present value of benefits (PVB) divided by the present value of costs (PVC):
")
When the NPV of any given project is positive, the BCR is greater than one. The greater the BCR, the higher the benefits are. The BCR is used to rank projects where there is a budget constraint, and it serves as an indicator of a project’s economic efficiency.
The IBCR involves ranking a pairwise comparison of all alternatives with a BCR greater than one in order to determine the marginal benefit obtained for a marginal increment in cost. Then, after eliminating all schemes with a BCR of less than one, the schemes are listed in order of ascending cost and the marginal BCR is determined by a pairwise comparison of alternatives, starting with the lowest and second-lowest cost alternatives. That is:

If the IBCR is greater than one, the alternative x+1 is preferred, since the marginal benefit is greater than the marginal cost. Conversely, if the IBCR is less than one, alternative x is preferred. The preferred option is then taken and the pairwise comparison is continued until only a single alternative remains, which should then be the most economically desirable of all the options considered.
However, Ogden (1996) concludes that the BCR approach is more cumbersome to use than the NPV approach and may produce more ambiguous and misleading results depending on how benefits and costs are defined. It is of particular note that low-cost measures are typically favoured when using BCR as the basis for selection. For example, installing advanced warning signs are likely to have a limited (but beneficial) effect on severe crash outcomes, but due to the low cost of installation, they are likely to produce a high BCR. In contrast, roadside barriers are likely (in the situation) to have a significant effect on reducing fatal and serious crash outcomes. However, given the greater cost for installation and maintenance, the BCR is likely to be lower. The aim of road safety is to produce a net reduction in fatal and serious injury. Using solely the BCR approach may produce outcomes that are inconsistent with this objective. Therefore the NPV/PVC approach in association with BCR is much preferred.
This type of evaluation expresses the difference between discounted costs and benefits of a scheme, which may extend over a number of years. As stated earlier, future benefits must be adjusted or discounted before being summed to obtain a present value. Changes may also take place over the life of the scheme which will affect benefits in future years.
Let us assume (for ease of calculation) that the current rate used by the government for highway schemes is 10%, which in the prevailing economic climate might be considered as somewhat high in most countries. This means that $100 in benefits accruing this year will be worth 10% less if it accrues next year. A further year's delay will reduce the benefit again, and so on. These figures can be summed over the life of the scheme to obtain the present value of benefits (PVB).

Net present value is defined as the difference between the discounted monetary value of all the benefits and costs of a particular project or measure. The NPV is expressed as the PVB minus the PVC. A positive NPV indicates an improvement in economic efficiency compared with the base case.
With respect to implementation priorities, the economic criteria for scheme assessment using the NPV approach are:
Care needs to be taken in using NPV as the only investment criterion, since it tends to indicate projects with higher costs.
The choice of assessment criteria depends primarily on available data, as well as the scope of the treatment. The different assessment criteria provide information on the project. The NPV provides information on the total welfare gain over a project’s treatment life; the BCR highlights the relationship between the present value benefits and implementation costs of a project; while the IRR shows the rates at which benefits are realised after investing in a countermeasure (PIARC, 2012).
The NPV is the preferred criterion as it provides an estimate of the absolute size of the treatment’s net social benefit. The BCR on the other hand provides the relative size of the costs and benefits of a treatment and depends on the classification of the project’s impacts. Table 11.8 provides guidance on when to use the different criteria.
| Criterion | ||||
|---|---|---|---|---|
| Budget | Decision context | Net present value (NPV) | Benefit-cost ratio (BCR) | Internal rate of return (IRR) |
Unconstrained budget | Accept/Reject decision | Accept if NPV is non-negative ✓ | Accept if BCR exceeds/equals unity ✓ | Accept if IRR exceeds/equals the hurdle rate ✓ |
Option selection | Select project with highest non-negative NPV ✓ | No rule exists ✘ | No rule exists ✘ | |
Constrained budget | Accept/Reject decision | Select project such that NPV of project set is maximised subject to budget constraint ✓ | Rank by BCR until budget is exhausted or BCR cut-off reached ✓ | No rule exists ✘ |
Option selection | Highest NPV subject to budget constraint ✓ | No rule exists ✘ | No rule exists ✘ | |
Source: Austroads (2005).
For a comprehensive step-by-step approach on economic appraisals or evaluation, as well as a summarised discussion of the assessment criteria, see PIARC (2012), EU (2006), and HEATCO (2006). Box 11.9 provides an example economic evaluation from Belize.

Summary of the three investment options of a Road Assessment Programme
The development of several options as in this example is fairly typical for road safety projects. This will help determine which combination of treatments will deliver the greatest benefit for the available funding. In this case, and following discussions with the project stakeholders, the options were adjusted with a lower cost option selected, and the benefits and costs recalculated. The estimated NPV of the project, using very conservative crash cost values, is US$6.1 m and the economic rate of return (ERR) is 28.8%. The ERR is well-above the Caribbean Development Bank’s cut-off rate of 12.0%

© ARRB Group
A variety of tools assist with the economic appraisal process in road safety. Some examples are provided below.
SafetyAnalyst (also discussion in Management Tools) includes an economic appraisal tool developed by the American Association of State Highway and Transportation Officials (AASHTO; see Harwood et al., 2010). It assesses whether countermeasures for a specific highway site are economically efficient. The tool allows the user to specify the costs, traffic volumes, and all other data inputs. It also provides default values for the specified treatment, which can be used in the estimation. The user can specify the economic appraisal to be performed, with options for cost-effectiveness analysis, benefit-cost ratio or net present value. The effectiveness measures are obtained from observed, expected and predicted crash patterns at the specific site. The countermeasures and sites are ranked using the Priority Ranking Tool component of SafetyAnalyst, which uses the same measures obtained by the economic appraisal tool and also provides the optimal option given budget constraints. The choice of prioritisation criteria lies with the user.
COBALT is an economic appraisal tool developed in 2012 by the UK Department for Transport. It was derived from the broader transport appraisal tool, COBA (Cost Benefit Analysis tool). COBALT focuses solely on road safety appraisals using the same CBA approach as COBA as outlined in DfT (2011).
While New Zealand does not have a dedicated road safety economic appraisal tool, the Economic evaluation manual (EEM) (New Zealand Transport Agency 2013) provides clear guidance and templates that can be used in the evaluation process. The EEM is a guidance tool outlining procedures for economic evaluations of transport investment proposals. It provides descriptions of basic concepts in economic evaluations and simple and detailed procedures for evaluations. The simple procedures are aimed at low cost activities while the detailed procedures are for large scale evaluations. Step by step methodologies for evaluating benefits and costs are also provided through downloadable spreadsheets.
There are different spreadsheets for different evaluations. The road safety promotion spreadsheet contains six procedural worksheets and four other worksheets for working notes, cost estimates and sensitivity analysis. Worksheet 1 is a summary of general project information and data used for the evaluation. Worksheet 2 is used for calculating the present value of project costs, worksheet 3 is used for calculating the social cost of crashes per person and worksheet 4 is used for calculating the present value of project benefits. Worksheet 5 is used to calculate the BCR per head. The cover worksheet is a summary of all the information and calculations in the spreadsheet. For each of the steps, there is guidance offered on the necessary information and input data.
European guidance on economic appraisals and prioritisation of road safety countermeasures is also available to practitioners. Examples of this include European Road Safety Observatory (ERSO- http://www.erso.eu/), Developing Harmonised European Approaches for Transport Costing and Project Assessment (HEATCO- http://heatco.ier.uni-stuttgart.de/), and Road Safety and Environmental Benefit-Cost and Cost-Effectiveness Analysis for Use in Decision-Making (ROSEBUD, http://partnet.vtt.fi/rosebud/).
The process applied by iRAP (Section 10.4.4) not only identifies problems and effective interventions, it also produces detailed business plans, including the cost-effectiveness of the interventions identified. An example from the Ukraine of one such investment plan is provided in Figure 11.7
.")
Figure 11.7 A road assessment programme investment plan - Source: EuroRAP (2013).
AASHTO, (2010), Highway Safety Manual, American Association of State Highway and Transportation Officials, Washington, USA.
Asian Development Bank, (2005), Costing of Accidents (10 reports on crash costing from the Asia region). Comprehensive guidance on crash costs.
Austroads (2005), Guide to project evaluation: part 2: project evaluation methodology, by N Rockliffe, S Patrick & D Tsolakis. AGPE02/05, Austroads, Sydney, New South Wales.
Bahar, G, (2011), Estimating the Costs to State Governments Due to Highway-Related Injury and Fatal Crashes, Transportation Research Board, NCHRP, Project 20-24 (068) Final Report
Bergh, T & Petersson, M (2010), ‘Roadside area design: Swedish and Scandinavian experience’, International symposium on highway geometric design, 4th, 2010, Valencia, Spain, Polytechnic University of Valencia, Valencia, Spain, paper 14.
Bhalla, K, Diez-Roux, E, Taddia, A, Mendoza, S, & Pereyra, A (2013), The Costs of Road Injuries in Latin America, Inter-American Development Bank, Washington D.C.
Bureau of Infrastructure, Transport and Regional Economics (BITRE), (2012), Evaluation of the national black spot program. Volume 1, BITRE Report 126, Canberra, Australian Capital Territory.
DaCoTA (2012), Cost-benefit analysis, Deliverable 4.8d of the EC FP7 project DaCoTA, Brussels
Department for Transport, (2011), Transport Analysis Guide (TAG): Cost benefit analysis, TAG unit 3.5.4 viewed 23 April 2014 www.dft.gov.uk/webtag
Department for Transport, (2013) UK, Road accidents and safety statistics, Accident and casualty costs (RAS60), September 2013 https://www.gov.uk/government/publications/reported-road-casualties-great-britain-annual-report-2012
Durdin, P & Janssen, K (2012), SafetyNET: breathing life into road safety analysis, Australasian Road Safety Research Policing Education Conference, Wellington, New Zealand.
Elvik, R, (2007), State-of-the-art approaches to accident blackspot management and safety analysis of road networks. TØI Report 883/2007. Institute of Transport Economics, Norwegian Centre for Transport Research.
Elvik, R, Hoye, A, Vaa, T & Sorensen, M, (2009), The handbook of road safety measures (2nd ed.). Emerald, Bingley, United Kingdom.
EU, (2006), Examples of assessed road safety measures - a short handbook. Output from European Union Rosebud project. Available from http://ec.europa.eu/transport/road_safety/projects/doc/rosebud_examples.pdf.
EuroRAP (2013), Development of a Safer Road Corridors Investment Plan World Bank project 1080490: Safer Roads Investment Plan, European Road Assessment Programme, Basingstoke, United Kingdom.
Harwood, D Torbic, D. Richard, K. & Meyer, M, (2010), SafetyAnalyst: Software Tools for Safety Management of Specific Highway Sites. Federal Highway Administration, McLean, Virginia.
HEATCO, (2006), Developing Harmonised European Approaches for Transport Costing and Project Assessment, viewed 24 April 2014 http://heatco.ier.uni-stuttgart.de
Hills, P. J., and Jones-Lee, M. W. (1983) The role of safety and highway investment appraisal for developing countries, Accident Analysis and Prevention, 15, pp. 355-369.
International Road Assessment Programme (iRAP) (2013), Multiple countermeasures, iRAP Methodology Fact Sheet #12.
Jensen, S (2013), Safety effects of converting intersections to roundabouts. Transportation Research Record 2389, 22-29.
Larsson, M, Candappa, N, & Corben, B (2003), Flexible barrier systems along high-speed roads: a lifesaving opportunity, Report 210, Monash University. Accident Research Centre (MUARC), Clayton, Australia.
Mackie, A. (1997) Molasses: Monitoring of local authority safety schemes, County Surveyor's Society/Transport Research Laboratory, United Kingdom.
McLean, J (2001), Economic evaluation of road investment proposals: improved prediction models for road crash savings, AP-R184/01, Austroads, Sydney, Australia.
McMahon K and Dahdah M, (2008), The true cost of road crashes: valuing life and the cost of a serious injury, International Road Assessment Programme (iRAP), Basingstoke, United Kingdom.
Milligan, C, Kopp, A, Dahdah, S & Montufar, J, (2014), Value of a statistical life in road safety: A benefit-transfer function with risk-analysis guidance based on developing country data, Accident Analysis and Prevention, 71, 236-247.
New Zealand Transport Agency (NZTA), (2011), High Risk Rural Roads Guide. New Zealand Transport Agency, Wellington, New Zealand.
New Zealand Transport Agency (NZTA), (2013), Economic evaluation manual (volume 2). Wellington, July 2013.
OECD/ITF (2012) Sharing Road Safety, Organisation for Economic Co-operation and Development (OECD), Paris, France.
Ogden, K. W. (1996) Safer Roads: a Guide to road safety engineering, Avebury Technical, 516 p.
PIARC (2009) Catalogue of design safety problems and potential countermeasures, Report 2009R07EN, World Road Association, Paris, France.
PIARC, (2012), State of the practice for cost-effectiveness analysis (CEA), cost-benefit analysis (CBA) and resource allocation. Report 2012R24EN, World Road Association (PIARC), Paris, France.
PIARC, (2016), The Role of Road Engineering in Combatting Driver Distraction and Fatigue Road Safety Risks. Report 2016R24EN, World Road Association (PIARC), Paris, France.
PIARC, (2017), Vulnerable road users: Diagnosis of design and operational safety problems and potential countermeasures. Report 2016R34EN, World Road Association (PIARC), Paris, France.
PIARC), (2023, Saving lives around the world with proven countermeasures. Report 2023R32EN, World Road Association (PIARC), Paris, France.
Roberts, P & Turner, B, (2007), Estimating the crash reduction factor from multiple road engineering countermeasures, International road safety conference, Perth, Australia.
SafetyAnalyst Economic appraisal tool (http://www.safetyanalyst.org/eatool.htm) and Priority ranking tool (http://www.safetyanalyst.org/prtool.htm)
Shen, J, Rodriguez, A, Gan, A, & Brady, P (2004), ‘Development and application of crash reduction factors: a state-of-the-practice survey of State Departments of Transportation’, Transportation Research Board Annual Meeting, 83rd, 2004, Washington, DC, USA, Transportation Research Board (TRB), Washington, DC.
Transport and Road Research Laboratory (1991) Towards safer roads in developing countries: A guide for planners and engineers, TRRL & Overseas Development Administration, Crowthorne.
Transport Research Laboratory (TRL), (1995), Costing road accidents in developing countries. Overseas Road Note 10. Crowthorne, UK.
Turner B and Comport L, (2010), Road safety engineering risk assessment part 4: treatment life for road safety measures. Austroads, Sydney, Australia.
Turner B & Smith G, (2013), Safe System Infrastructure: Implementation Issues in Low and Middle Income Countries. Research Report ARR 383, ARRB Group Ltd, Vermont South, Australia.
Turner, B, Tziotis, M, Cairney, P & Jurewicz, C (2009), Safe System Infrastructure – National Roundtable Report, Research Report ARR 370, ARRB Group Ltd, Vermont South, Australia.
Turner, D. S. and Hall, J.W. (1994) Severity indices for roadside features, NCHRP Synthesis of highway practice 202, Transportation Research Board, Washington, DC.
Yannis, G, Evgenikos, P & Papadimitriou, E (2008), Best Practice for Cost Effective Road Safety Infrastructure Investments, Conference of European Directors of Roads, Paris, France.