
The assessment of potential risks and identification (or ‘diagnosis’) of issues are the first steps of the risk assessment process introduced in Infrastructure Safety Management: Policies, Standards, Guidelines and Tools (Figure 10.1). This chapter discusses methods for identifying high risk locations, and the ways that different sources of data can be analysed to assess the causes of this risk.

Figure 10.1 Assessing risk and identifying issues within the risk assessment process
The traditional approach used in the identification of risk is the analysis of historical crash data. This approach is still very relevant, but other sources of information used in the risk assessment process can lead to improvements and better results. The proactive approach is important in all countries, but particularly in locations where crash data may be of poor quality and in locations where new infrastructure will be built. Proactive approaches are being increasingly used to supplement historical crash data.
The focus of this manual is on the elimination of death and serious injuries, as these are the crash types that have the greatest societal impact. However, identification of high-risk locations involving death and serious injury does not just involve analysis of fatal and serious injury crash data. Other sources of information can also be used to identify likely locations where serious injury or death may occur.
The following section provides brief information on project- and programme-level approaches to risk assessment, while Crash-based Identification (‘Reactive’ Approaches) discusses crash-based methods for identifying and assessing risk. Proactive Identification provides information on the proactive approaches, including impact assessment, road safety audit and road safety inspection Combining Crash Data and Road Data brings both the reactive and proactive approaches together to discuss an integrated approach to assessing risk.
Guidance documents on the assessment of risk are available and should be adopted by all countries and embedded within core business. Training in the use of the following tools should be provided:
As a priority, assessment should be undertaken on high risk routes and corridors (see Belize case study in Chapter 10.2), utilising crash data were available (Crash-based Identification (‘Reactive’ Approaches)) as well as information on safety-related road elements (e.g. through safety audit and road assessment programmes – see Proactive Identification).
Road agencies typically allocate funding to improve high risk locations, whether based on crash history or on the potential risk. This funding may take the form of dedicated funding for high-risk locations and/or be embedded in other operating budgets (for example, major projects or asset management). Most actions undertaken by a road agency have a safety impact, whether they are initiated for safety reasons or not. If consideration of safety is included in all decision-making, safety risk can be reduced, often at little or no additional cost. The assessment of risk needs to occur at the programme and project level, and the advice provided in this chapter is relevant to both.
Assessment of risk should be undertaken for the entire road network for which the road agency is responsible. Such an approach would require a network-wide assessment of risks and issues. The outcomes of such an approach would identify key crash types, trends, geographic regions or areas, deficiency types, etc., with the outcomes of this assessment informing programmes of work.
It is often the case that a small percentage of roads account for a large percentage of deaths and serious injuries. At the programme-level, the task is to identify such routes and address these. For those countries with limited resources or that lack adequate data across the whole network, such locations are the most important to assess. These locations can form the basis of a corridor demonstration project. The content from this and the following chapters can be used as a guide to the assessment of risk across networks or along corridors. The examples shown in the case studies below provide information on the corridor approach in Belize and in New South Wales, Australia.
At a project level, the steps outlined in this chapter are equally relevant. They highlight how to identify risk at more specific locations (e.g. intersections, routes or areas) and diagnose risk at these locations. Crash-based (reactive) and more proactive approaches are relevant to both programme- and project-level approaches. In each case (whether programme or project level) the same steps are involved in assessing risks and identifying casual issues. The Moldova used EuroRAP as a means to assess risk, and the Czech Republic's IDEKO research project developed method and tools for the treatment of hazardous locations.
This section focuses on crash-based identification of high risk locations, a process that is known as accident investigation, or the treatment of ‘blackspots’. The term ‘sites with potential for safety improvement’ is also used, as the approach involves selecting locations that have high potential for reductions in crashes through the introduction of targeted safety improvements. The approach relies on crash analyses to first identify safety problems before a solution is sought. These are often called ‘reactive’ methods because a response is only initiated after crashes have occurred. A fuller account of this approach is provided in the PIARC document Road Accident Investigation Guidelines for Road Engineers (PIARC, 2013).
As indicated above and in Proactive Identification, reliance solely on crash data can produce situations where only a small proportion of crashes can potentially be addressed. For this reason, it is recommended that a combination of crash data and other sources of information be used to assess and treat risk.
Reactive approaches typically include the following steps:
This chapter focuses on the first two points – identification and diagnosis. Consideration will also be given to how crash data is used and its limitations. The other steps will be covered in Intervention Selection and Prioritisationand Monitoring, Analysis and Evaluation of Road Safety. A reliable crash database is a key tool in this process of identifying and analysing crash locations (see Hospital Data in Establishing and Maintaining Crash Data Systems). Other tools also exist, for example the Network Screening and Diagnosis tools in Safety Analyst (see Box 9.5).
In order to treat the occurrence of crashes, crash data is needed to provide necessary information to road authorities. Further information on the collection and use of crash data can be found in Effective Management And Use Of Safety Data. Issues relating to the need for good quality data are also discussed in that chapter. To ensure adequate data quality, the data should be accurate, complex (i.e. includes all features), available (i.e. accessible to all users), and uniform (i.e. adheres to standard definitions) (PIARC, 2013).
The primary data source for crash reduction initiatives, especially those undertaken by road engineers, is typically police crash reports. This data should provide crucial information, which at a minimum should include the crash severity and the number of each injury severity type (i.e. fatal, serious, minor, etc.). Other important information to collect includes (PIARC 2013):
Crash type is of particular importance, as it provides the basis for some crash location selection criteria (as discussed in the following section). Normally, crash types are divided into groups of crashes with common attributes, such as all crashes involving vehicles colliding head-on, or all crashes involving pedestrians. Further examples of crash types are shown in Identifying Crash Locations in Crash-based Identification (‘Reactive’ Approaches).

It is important to be able to identify the location where a crash occurs. A crash location can be an individual site (such as an intersection or bend in the road), a length (segment) of road, an area of the road network (such as an entire corridor), or a collection of locations across the network (road system wide) that display the same crash characteristics. In order to identify crash locations, access to a comprehensive database is required to provide sufficient information about the exact locations and circumstances of crashes that have occurred. Once all crash sites have been located, there needs to be selection criteria so that only worthy sites are selected for further analysis and treatment.
The following sections provide an overview of the approaches that can be used in identifying crash locations. Detailed guidance on the identification of high-risk locations has been developed in many countries. In addition to the PIARC (2013) manual, further information can be gathered from many sources, including AASHTO (2010), Austroads (2009a), and RoSPA (2007). The African Development Bank (2014a) has recently released guidance that is specifically intended for use in LMICs.
It is important to consider what the boundaries of a crash location are. There needs to be a defined cut-off point, such as between crashes that occur at an intersection and crashes that are considered ‘mid-block’. It may be necessary to look beyond these defined boundaries when analysing crash data. For example, crashes within 10 metres on the approach roads to an intersection may be considered as located at the intersection; however, it may be of value to look beyond this boundary for other crashes that may be related to an intersection (e.g. 100 metres). The crash location is also generally identified as the point at which an impact occurred. However, this may only be the end point of a sequence of events. Factors relating to the cause of the crash may have started earlier on the roadway.
Crash locations can sometimes be poorly or inaccurately defined, and it is important to consider this when comparing crash sites. There are a number of different methods used to determine the location of a crash. In built-up areas, the common practice is to measure the distance from the nearest intersection, junction or landmark using some distance measuring device. However, in rural areas and in some countries in general, names may not exist for all roads, and junctions may be few and far between. Other common systems are the Linear Referencing System and Link-Node System. These too rely on road names or reliable kilometre post markers along roads. In many countries hectometer points (or milepost) on road are a part of infrastructure for a very long time. Those signs are helping to identify number and kilometer (or milepost) of the road. Now more and more common is to use Global Positioning Systems (GPS). Gathered in this way latitude and longitude coordinates may show us the exact location more precisely. For roads where the infrastructure does not contain kilometer and/or hectometer (milepost) signs it is important to consider if it is more effective to invest directly into a GPS solution because of its advantages in locating crashes. See: Effective Management And Use Of Safety Data and WHO (2010) for more detail on defining crash locations.
Over time, especially in HICs, there has been a movement to the assessment of more extensive areas, including route-based approaches. The term ‘Network Safety Management’ is used in Europe to encompass an approach that assesses extended routes, typically between 2 and 10 km (Schermers et al., 2011). These segments have higher than expected numbers and severity of crashes when compared to other similar segments. Various tools have been developed to help with this process, and some of the key approaches are discussed below.
Typically, a three- to five year period is selected to provide a large enough sample of data, whilst minimising the chance of changes to the road network. In some LMICs, high risk locations and crash patterns within a location may start to form after just one to two years. Once a strong pattern has been established, especially where fatal and serious injury crashes are occurring, it is more important that treatments are implemented earlier rather than waiting up to five years for more data. When selecting the time period, it is important to use whole years to avoid cyclic or seasonal variations in the crash and traffic data. It is also important to be aware of any changes in database definitions that may have occurred in that time.
There is generally not enough funding to treat all identified crash locations. Even if the funds are available, funding restraints may not allow for immediate investment or make it necessary to invest over a longer timeframe. Selection criteria are therefore required for prioritising crash locations for further investigation and treatment. It is strongly recommended that fatal and serious injury crash types be used for the selection of sites, as per the Safe System approach (see The Safe System Approach). However, minor injury crashes should not be ignored as they may be indicative of a potential fatal or serious injury crash in the future. The selection process varies depending on the aim of the project and the types of actions that may be considered, and include:
There are several existing methods to identify crash locations, using measurements such as crash frequency, crash rate and crash severity. More detailed information on this issue can be found in AASHTO Highway Safety Manual (2010) and Austroads (2009). These help in the identification of high risk crash locations, particularly those of higher severity. It is important to note, however, that although blackspots should be targeted for treatment, they may only make up a small proportion of the network that is responsible for deaths and serious injuries. In these instances, additional proactive responses may also be required (see Proactive Identification).
For most of the methods described below, crash locations should be selected based on the same definitions for location (e.g. the same radius or route length, where this is applicable) and the same time period in order to allow for a direct comparison. However, for some methods, the data can be normalised to allow direct comparison (e.g. converted to crashes per kilometre; crashes per year).
At the most basic level, the presentation of crash locations on a map can provide information on crash clusters. In the absence of a more sophisticated crash database system, this provides a quick indication of crash locations by frequency. Figure 10.3 shows an example of crash locations overlaid on a map for an urban area. In this figure the larger the circle, the higher the number of crashes. Maps are a powerful way to present information to key stakeholders, including technical staff, policy makers, senior managers, members of the public and politicians. As they are easy to understand by all of these stakeholders they can be a strong advocacy tool.
.")
Figure 10.3 Crash location map, New Zealand- Source: New Zealand Crash Analysis System (CAS).
Figure 10.4 Shows an example of road safety levels map based on fatal accident crash risk concentration for national roads in Poland. More detailed maps for smaller regions together with maps representing fatal accident acceptance risk levels, costs density class risks and costs density acceptance levels are also available. All the maps are prepared in accordance with polish national regulations and Directive 2008/96/EC of the European Parliament and of the Council on road infrastructure safety management.
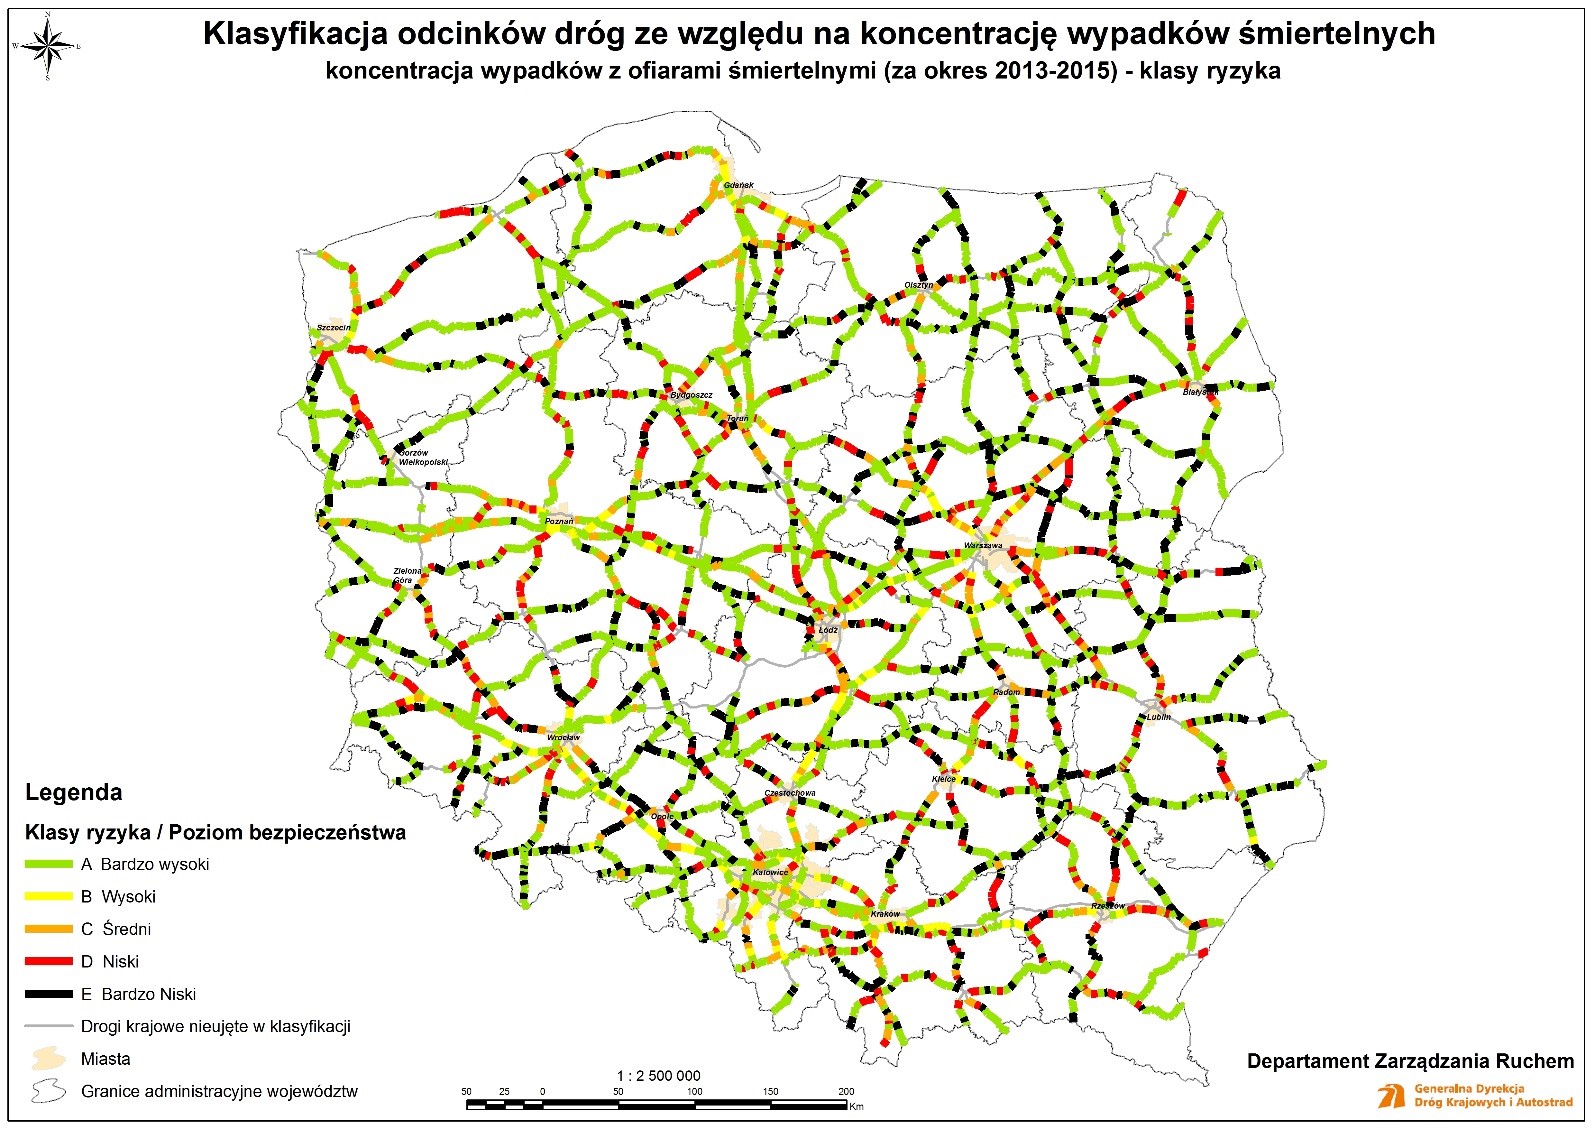
Figure 10.4 Road safety levels map, based on fatal accident crash risk concentration for national roads in Poland. Each color represents other safety level. It helps to focus on the highest risk locations.
A ranked listing by crash frequency (i.e. highest crash numbers to lowest) can form the basis of an initial list of crash locations for further assessment. Usually a threshold level is selected, with sites above this threshold being assessed. The threshold is often set arbitrarily (e.g. five crashes per year), although it is preferable to take into account the available budget and/or a threshold involving crashes of a particular type (e.g. three pedestrian injuries per year).
Given the aim of road safety management is to minimise death and serious injury crashes, it is preferable to select sites for investigation based on crash severity. A common method of identifying high-risk locations to take account of severity is to prioritise sites through a crash cost analysis. An effective method often used is called the Equivalent Property Damage Only (EPDO) Index, where crashes are weighted according to their severity. For instance, fatal crashes are assigned the highest cost/weighting per crash and property-damage-only (PDO) crashes (or minor crashes if PDO crash data is not collected) are assigned the lowest cost/weighting per crash. Although this is a relatively simple criterion to implement, it provides a basis for creating a shortlist of sites to be investigated further. As with the simple crash frequency-based approach, sites are ranked from highest cost to lowest cost, and a threshold is set for investigation.
A similar and yet more sophisticated method is the Relative Severity Index (RSI). Standard crash costs are assigned to crashes by crash type and road environment, as shown in the example in Table 10.1
| Crash costs for Victoria (AU$) | ||
|---|---|---|
| One-vehicle | Urban | Rural |
Pedestrian hit crossing road | 166,300 | 183,800 |
Hit permanent obstruction | 162,400 | 163,400 |
Hit animal on road | 102,300 | 79,500 |
Off road, on straight | 119,900 | 146,100 |
Off road, on straight, hit object | 177,500 | 206,600 |
Out of control, on road, on straight | 98,100 | 115,700 |
Off road, on curve | 146,900 | 175,900 |
Off road, on curve, hit object | 191,700 | 219,700 |
Out of control, on road, on curve | 120,100 | 112,110 |
| Two-vehicle | Urban | Rural |
Intersection (adjacent approaches) | 124,000 | 173,200 |
Head-on | 240,300 | 341,600 |
Opposing turns | 132,700 | 168,600 |
Rear-end | 64,200 | 109,700 |
Lane change | 88,500 | 132,800 |
Parallel lanes, turning | 79,900 | 104,600 |
U-turn/through | 124,600 | 135,600 |
Vehicles leaving driveway | 93,200 | 129,100 |
Overtaking same direction | 97,000 | 138,000 |
Hit parked vehicle | 112,500 | 202,700 |
Hit railway train | 384,400 | 559,100 |
Source: Adapted from Andreassen (2001).
These costs are calculated based on an analysis of the average crash severity of each crash type. It is important to note, however, that crash types and crash costs will differ between jurisdictions and countries. This method takes into account crash severity but places less emphasis on locations where a single fatal crash may skew outcomes because of its very high cost. Such an outcome might be the result of a ‘random’ event, never to be repeated. This is more likely on lower volume roads or road networks where fatal crashes are very infrequent. Of higher interest are locations, routes or areas where high severity events are likely to happen again in the future. Using average crash costs by crash type, crashes at each location can be assigned a crash cost, and then locations ranked by total crash costs.
In some cases, multiple identification methods are used. These use two or more of the methods identified above. Other selection criteria are also available. Some of these are quite complex, utilising crash prediction models and Empirical Bayesian (EB) methods (e.g. AASHTO, 2010). The EB method is currently considered one of the most reliable approaches for selecting crash locations. However, other approaches identified above can produce satisfactory outcomes, particularly when adequate weighting is applied to fatal and serious injury crash outcomes.
Crash sites can be assessed using statistical analysis to identify sites that are experiencing a statistically significant number of crashes in a set time period. This can be useful to distinguish between sites that are experiencing abnormally high crash rates and those that are merely experiencing variation due to chance.
The crash identification process allows for sites to be selected for further investigation. Using any of the abovementioned methods, a shortlist can be developed containing sites that will be considered for treatment. Available funding will limit the number of sites that can be treated, and so the shortlisted sites should be assessed through site inspections and an initial crash diagnosis to identify where cost-effective treatments can be implemented.
Diagnosing the contributing factors to crashes is the foundation for selecting an effective solution to a safety problem. To properly understand the problem, one must consider that:
Diagnosis of the contributing factors at a crash location is a four-step process:
These stages are discussed in further detail in the sections below.
Crash data is the most important information, and should be available from either the Police or road authority. The road agency may also have information on traffic volumes and any historical information about the site such as a layout plan, any changes in traffic patterns or land use, and any previous or current concerns raised by the community or stakeholders.
An effective way to identify groupings of certain crash types or other common factors at a location is to present the data as a frequency diagram, a factor matrix, or a collision diagram of the different crash types. A brief description of each of the analysis methods is provided below:
Typically, crashes are categorised within a crash database according to a certain crash type coding system. A common breakdown using 10 crash groupings is provided by PIARC (2013):
Other countries may use more or less crash type groupings. Given the importance of motorcycle fatal and serious injury in many countries, provision should also be made to record details of such crashes. This is typically recorded as the vehicle type as an additional variable to those provided above.
Crash type variables can be used to describe the type of the crashes in terms of parties involved, collision and vehicle/pedestrian manoeuvre just before the crash. Each variable, coded as a two digit number, describes the single specific crash type. In crashes where more than one type can be applicable, the corresponding number of variables should be selected.
A simple frequency histogram or diagram can be used to show the distribution of crashes and identify if any trends in crashes are appearing. This can be good for an initial assessment, but due to its simplicity, it should not be done as an alternative to a factor matrix or collision diagram.
A factor matrix takes the frequency table approach one step further and considers additional factors such as the crash severity, year of the crash, direction of travel, type of road users, collision type, surface and lighting conditions, time of day, and day of week.

Figure 10.5 Example of a factor matrix, Crash Analysis System, New Zealand - Source: NZTA Crash Analysis System.
A collision diagram is an illustrative presentation of the crashes that have occurred at a location. Crashes are pinpointed on a diagram of the intersection or road section, showing the crash type (through standard symbols), the direction of travel, and other relevant information (e.g. the date, time of day, weather and lighting conditions). A number of software packages allow the automatic creation of these diagrams.
.")
Figure 10.6 An example of a collision diagram from Germany - Source: PIARC (2013).
The main purpose of these data presentation types is to identify common contributing factors of crashes at a location. Note that there are normally several factors that lead to a crash. If there is no apparent dominant crash type that appears from the data, it can be very difficult to treat the site as it will be difficult for any one treatment to solve all the different issues at the site (speed management can be the exception to this, particularly in the elimination of high severity crash outcomes). Sometimes it can be helpful to look at the individual police crash reports for greater detail on the crash circumstances, as this might shed light on a common causal factor.
The main purpose of an inspection is to identify any environmental or traffic issues that may be contributing to crashes at the location. A site inspection can allow the crash investigation team to see the location through the eyes of the road user and observe the traffic behaviours. Additional data can also be collected, such as vehicle speeds, road features, parking restrictions and speed limits, as well as enable the team to assess any other characteristics of the surrounding road environment.
Where possible it is recommended that a team conduct the assessment, rather than an individual. A team approach will generally provide a more diverse range of opinions and ideas, as it is easier to generate these through group discussion. Team members might include an expert who is trained in road safety engineering and investigation of crash locations; and police and/or road agency staff, particularly those who are familiar with the location. The group may also include someone new to the crash investigation, but who has ideally undergone some form of training. This approach is essential to ensure development of skills for future crash investigators. Guidelines on Human Factors should be considered by those investigating sites (see Design for Road User Characteristics and Compliance), See also: NCHRP 600: Human Factors Guidelines for Road Systems.
It is recommended that the data analysis described above (e.g. production of a factor matrix and collision diagram) is circulated amongst the crash investigation team in the form of a preliminary report, prior to any site inspections.
A drive-through of the location should be undertaken to fully understand the road user experience. It is often useful to select someone unfamiliar with the area to do the driving so that they can experience the location as others would for the first time. Often there will be a need to drive through the site several times. An inspection on foot will also be required to more closely observe road user behaviour and site conditions. This will also allow for the collection of photos and notes, and to document any findings from the inspection. Sometimes it is also useful to inspect the site at different times of the day or days of the week to check for any variability in traffic flows or lighting/visibility conditions. For example, if a high number of night crashes have occurred, night inspections are essential.
Table 10.2 provides a list of possible contributing factors for different crash types (including those that contribute the most to fatal and serious injury outcomes) that should be considered by investigators during a site inspection. Although not listed, speed is linked to the frequency and severity of all crashes.
| Right angle crashes (intersection) | Turning crashes with oncoming crashes |
|---|---|
|
|
| Run-off-road crashes | Head-on crashes |
|
|
| Motorcyclist crashes | Cyclist crashes |
|
|
| Pedestrian crashes | Straight ahead rear-end crashes |
|
|
| Hit-fixed-object crashes | Railway level crossing crashes |
|
|
| Crashes involving a parked vehicle | Crashes involving U-turning vehicles |
|
|
| Lane changing and manoeuvring | |
| |
Before summarising the analysis in a report, consideration should be given to whether any additional information is required. For instance, if the crash analysis and/or site inspections suggest that there may be issues with skidding, then skid resistance testing could be undertaken.
A summary report should be prepared to clearly inform readers of the conclusions that were drawn from the analysis. This provides the basis from which treatment options are considered and selected. The report should include a description of the area or site, results from the data analysis (e.g. crash diagrams), observations from the site inspections, including possible contributing factors to crashes, comments on any identified common factors leading to crashes and possible remedial measures (see Intervention Options and Selection).
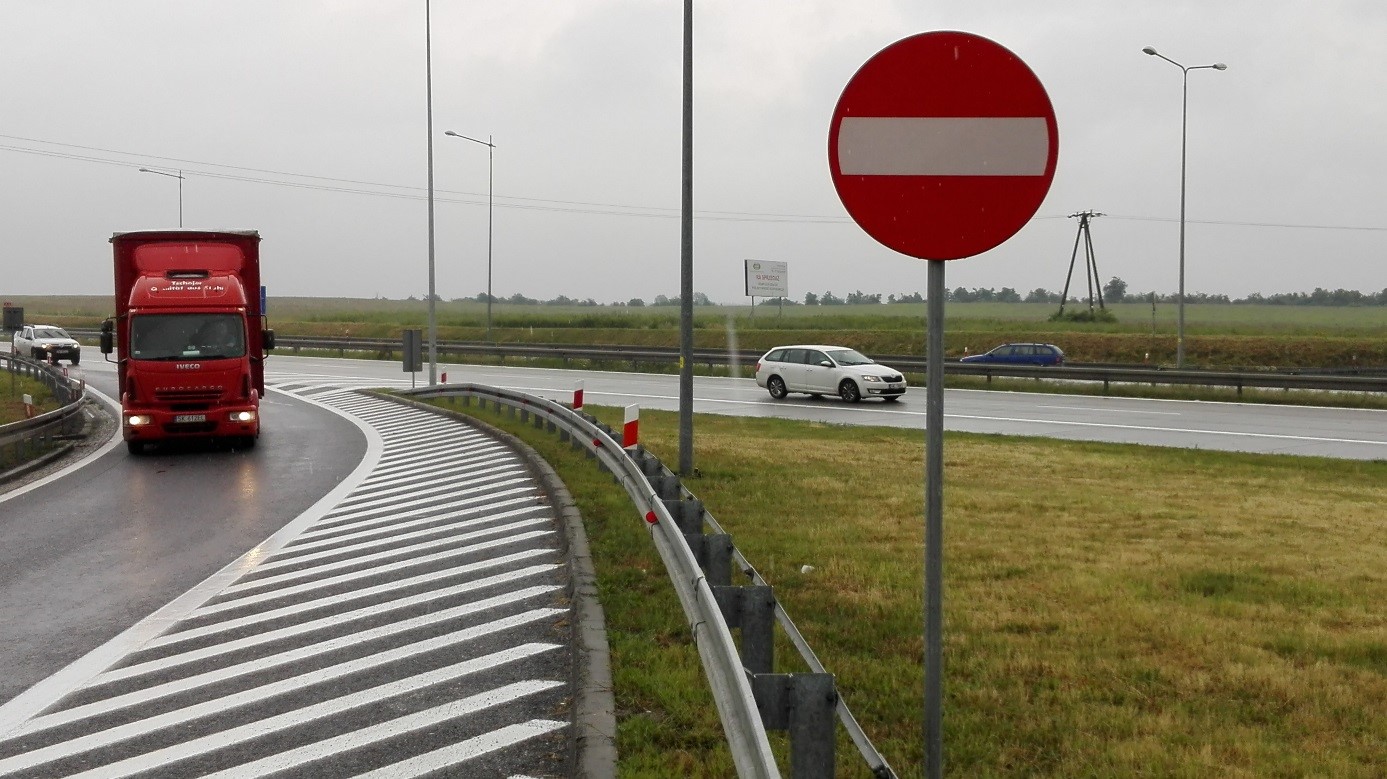
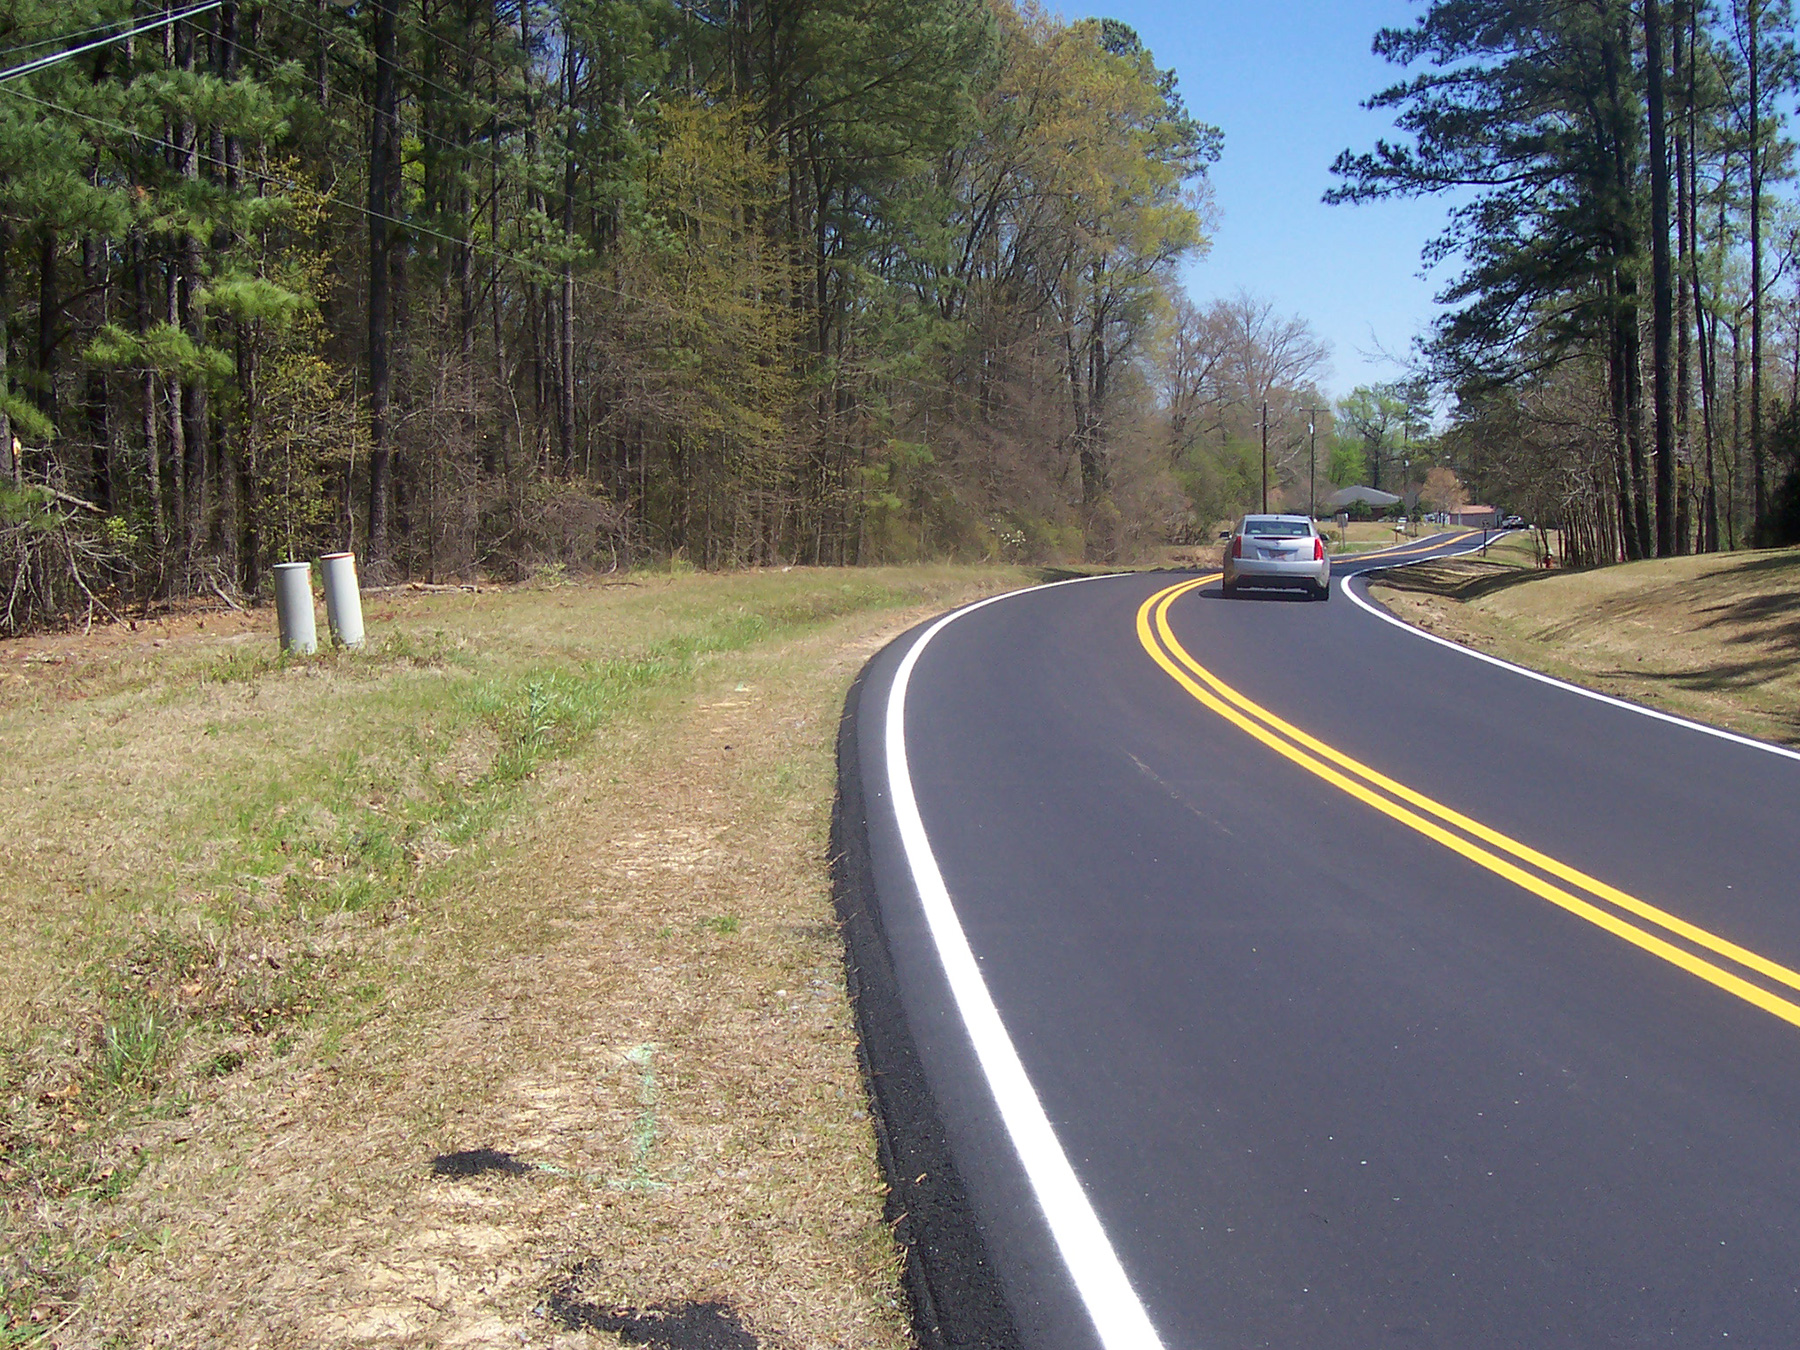
Figure 10.7 An example of low cost improvement on old motorway A-4 in Poland.
An example of a diagnosis, on motorways and expressways in were occasionally identified wrong-way drivers, “ghost riders”. The road authority recognised that the design should limit the possibility to travel the wrong way on roads where the opposite directions are physically separated. Some of the engineering solutions that were implemented long ago, were no longer recommended, but still exist and operate well when properly equipped with traffic signs and markings Ghost riders were also identified on new roads. After specially dedicated inspections with road traffic specialists and police, some additional signs minimising of the potential of unintentional wrong-way driving were installed. Solutions were adapted and placed on other new and existing roads as shown in the photo above. These actions removed the need to rebuild. This solution is used on new investments with practically zero additional costs.
As mentioned in the previous section, there are established methods that help detect, prioritise and treat high crash-risk sites based solely on prior crash history. Although these locations should be a target for funding and attention, they only comprise a small proportion of the network that is responsible for casualty crashes, especially in higher income countries. For example, SWOV (2007) reports that in the Netherlands during 1987–89, only 10.5% of all fatal and hospital in patient crashes occurred at blackspot locations. In the 1997–99 period, this had declined to 6%. For the period between 2004 and 2006, the figure was only 1.8%. This study concludes that an increasing number of serious crashes occur at locations that are not blackspots.
Proactive safety actions can be employed to avoid future crashes by:
It should be noted that proactive actions, whilst being a preventative measure, should not be a simple check of compliance with design standards. Often the design can meet standards, but due to the configuration, or due to adoption of minimum standards on a number of road elements, the design may be unsafe.
This section will discuss several types of road safety checks that are generally performed at different stages of implementation of a road scheme. These checks may occur for a new road or road feature, modification to an existing road or feature, and even during the usual operation of a road.
Although the focus of this chapter is on identifying risks, and the tools used in this process, some of the approaches described also help in the identification of solutions or even in the prioritisation of interventions (both discussed in Intervention Selection And Prioritisation). The content beyond the risk identification stage is also included in this chapter where relevant for completeness. Therefore, this material should be read alongside the following chapter on treatment selection and prioritisation.
The road safety check types are:
It should be noted that safety inspection of existing roads is sometimes referred to as an audit of existing roads in some countries, but the terms refer to a similar process.
The aim of each of these road safety checks are similar, however, the main distinction is in the timing and scope of the procedures, as shown in Figure 10.6. Road assessment programmes are typically used to assess roads that are already in use, but recent developments have extended this to include assessment of road design.
Given the different timing and scope of each procedure, all can be undertaken in parallel. It is up to individual countries as to which procedures are adopted. Each has different advantages and weaknesses, and these are documented in the following sections.

Figure 10.8 Sequence of road safety checks during the design stages
Some of the main objectives and benefits of undertaking any of these road safety checks include (PIARC 2012a):
The different road safety check types are thoroughly outlined in a number of national guidelines, some of which are available internationally. Example guidelines are provided throughout the remainder of this chapter.
Other tools to assess safety at the planning and development stage are included in Management Tools. Some of these tools are designed for use by practitioners with little or no road safety experience, and are intended to identify and address risk at the earliest stages of project and programme development.
Road safety checks generally follows a similar managerial procedure. This is outlined in Figure 10.7, which also indicates who has responsibility for each stage of the process.

Figure 10.9 Steps involved in a safety check and allocation of responsibility
Road safety impact assessment is conducted for infrastructure projects at the initial planning stage before the infrastructure project is approved. It indicates the road safety considerations which contribute to the selection of the proposed solution and provides all relevant information necessary for a cost-benefit analysis of the different options assessed. This allows a comparison of the impact of different road or traffic schemes on safety performance. These could be for a new road or for modification to an existing road. This is a procedure that should first be performed in the initial planning stage of a project to assist in the selection process for major infrastructure projects and should then be continually reviewed during the draft design phase. Safety impact assessment often precedes road safety audit (Road Safety Audit in Proactive Identification), but is done as a complementary process. As identified in Examples of Infrastructure Policies, Standards and Guidelines in Policies, Standards and Guidelines, impact assessment is required for all infrastructure projects on the trans European network as part of an EU Directive.
There are five main steps to a road safety impact assessment, as outlined by Eenink et al. (2008):
1. Establish the baseline situation (year zero). This should be a measurement in terms of traffic volumes, crashes per road type, and therefore risk factors per road type. A site inspection is required to collect this data (see Diagnosing the Problem in Crash-based Identification (‘Reactive’ Approaches) for further detail regarding site inspections). The site inspection should consider all road users, the surrounding road network, topography, local amenities and activity centres, local weather conditions, previous road safety reviews, and any complaints received from the community regarding the site.
2. Determine the future situation without any implemented measures (known as the ‘Do Nothing’ or ‘Do Minimum’ scenario). This should consider current circumstances and conditions and should account for traffic growth.
3. Determine the future situation under each of the applied road safety schemes. This should include a wide variety of alternatives and an estimate of the effects per road type. It should consider each road user group for each of the schemes. Each scheme should be measured in terms of its impact on the number of crashes and crash severity through a crash prediction model (see AASHTO, 2010).
4. Perform cost-benefit analysis for each possible road safety scheme. This is done by assigning a monetary value to the safety impacts of each scheme and allows for the schemes to be ranked in order of effectiveness.
5. Optimize the plans of each scheme. This is done to achieve the optimal safety effect and best cost-benefit rating.
A detailed final report should be completed at the end of the road safety impact assessment. This should include such details as:
During a road safety impact assessment it is important to ask certain questions. Are the road safety policy targets realistic or ambitious? Are there other cost-effective schemes that have not been considered yet? Are the selected schemes suitable, not just in terms of safety, but in terms of other issues such as impacts on the environment, or accessibility and connectivity for all road users? Are there any associated social issues, such as a lack of support from the community?
It is important to note that a road safety impact assessment does not replace a road safety audit; it is merely a preliminary step towards selecting the most beneficial design for a project. Road safety audits are essential for ensuring all hazards are identified throughout the detailed design and construction processes, which will be discussed in detail in Road Safety Audit in Proactive Identification.
Part C of the Highway Safety Manual (AASHTO, 2010) provides information on crash prediction models for different road types, including rural two-lane, two-way roads, rural multi-lane highways, and urban and suburban arterials. It covers both undivided and divided roadway segments, and intersections with various control devices and numbers of legs. This can be used to predict the expected average crash frequency, which is determined based on traffic volumes and roadway characteristics. More on the Highway Safety Manual can be found in Box 10.3.
The IHSDM is a suite of software for evaluating the safety and operational effects of geometric design decisions (from design plans). These are advanced safety analysis and prediction tools, and considered ‘best practice’ by many safety professionals (see e.g. Schermers et al., 2011).
The development of these tools is based on a wide and robust range of research including on crash prediction models and crash modification factors (CMFs) undertaken mainly in North America over the last 15 to 20 years. IHSDM is particularly useful for selecting the safest option from a list of possible options and for understanding the safety trade-off that might result from a lower standard design that may be required due to site constraints or construction cost savings. This tool uses crash prediction models and CMFs to predict crash occurrence. The models and CMFs are continually being refined as new research becomes available. IHSDM has calibration procedures that allow it to be customised for each US state or for other jurisdictions. Testing of these procedures has occurred in some European countries as well as Australasia.
The international Road Assessment Programme (iRAP) has developed a technique to star rate design plans. Although not strictly an impact assessment, the process fulfils a similar purpose. Details on this approach can be found in the case study in Management Tools.
© ARRB Group
A road safety audit is defined as a formal and independent technical check of a road scheme design and construction, to identify any unsafe features or potential hazards and to provide recommendations for rectifying them during all stages, from planning to early operation (PIARC, 2011; ETSC, 1997; NRA, 2012).
The main aim of a road safety audit is to identify and address any road safety issues. A road safety audit is not a check against design standards, but a hazard detection tool. A road scheme, when audited, should be analysed under all operating conditions and consider all road users.
Road safety audit is thought to be a cost-effective measure for identifying and addressing likely safety issues. The earlier the audit is undertaken, the greater the benefit, as adjusting design plans can be a cheaper option than retrofitting safety features once a scheme has been built. Several studies have documented the benefits of conducting road safety audits. As an example, Macaulay and McInerney (2002) estimated that a sample of design stage audits had a benefit cost ratio (BCR) of between 3:1 and 242:1 by implementing all the recommendations from individual audits. In addition, 75% of recommendations had a BCR greater than 10, and 90% of recommendations had a BCR greater than 1.
Road safety audits (as well as other proactive methods) are very important for LMICs, as they provide an opportunity to develop a culture of road safety amongst those responsible for the planning and delivery of road infrastructure. On this basis alone there is a very strong case for the development of a formalised process for road safety audits for all major infrastructure projects. The Kazakhstand case study provides an example of some of the added benefits that can be gained from large road safety audit projects in LMICs.
Many international guides exist on how to conduct road safety audits. PIARC developed a Road Safety Audit Guide (2011; www.piarc.org/ressources/publications/7/6852,WEB-2011R01-TM.pdf) that provides a comprehensive step-by-step procedure on how to conduct a road safety audit, as well as providing detailed individual checklists for motorways, inter-urban and urban main roads at each of the design stages (feasibility study, preliminary design, detailed design, and pre- and post traffic opening). The guide also provides checklists for road safety audit, which are discussed in more detail below. Other useful guides include the FHWA Road Safety Audit Guidelines (2006; also see http://safety.fhwa.dot.gov/rsa/) and the Austroads Guide on Road Safety Audit (2009b). The African Development Bank (2014b) has recently released guidance that is specifically intended for use in LMICs.
A road safety audit may be undertaken through planning, design and operations, as well as, other circumstances, for example to assess the safety of proposed traffic management at roadworks, particularly in busy and complex situations.
As identified in Section Examples of Infrastructure Policies, Standards and Guidelines in Policies, Standards and Guidelines , the EU Directive on road infrastructure safety management states that road safety audit be conducted on all infrastructure projects on the trans-national highway in Europe, and suggests that these should also occur for all national roads. The Directive also states that such audits should be conducted at the draft design, detailed design, pre-opening and early operation stages.
The PIARC (2011) guide identifies three parts in the auditing process – commissioning, undertaking and completion. Details on each of these stages are provided in that document.
The selection of an appropriately skilled audit team is an important part of the commissioning phase of the audit process. It is essential that the team is independent of the design team. The size and make-up of the team will vary depending on the size and complexity of the project and the stage of audit being undertaken. It is important that the team members, and particularly the team leader, have the necessary training to undertake a road safety audit. Many countries have developed formal training requirements (sometimes referred to within national guidance on road safety audit) and registers of appropriately qualified auditors. For smaller projects, it may be possible for a single auditor to complete a ‘road safety check’, and although this is not ideal, it is certainly preferable to no audit at all.
The availability and development of suitably skilled road safety auditors is an important challenge for those in LMICs. Capacity can be increased in the short term by training of key staff (either within their own country, or through established courses in HICs). In the medium term it is desirable to establish capacity within a country to train auditors. This will typically require some form of longer term ‘train the trainer’ approach, whereby a small number of experts are provided with advanced training and on-going support. These experts then develop skills through experience to a point where they are in a position to train others.
Many countries have developed checklists for conducting road safety audits. These checklists provide examples and reminders of issues that should be assessed by audit teams during their assessment. They are useful to ensure that key issues are considered, but it also needs to be recognised that every situation differs, and therefore checklists should typically be used as guides only. This is because there may be other issues identified during an audit that were not anticipated by the existing checklist. Different checklists have been developed for different stages of the road safety audit process, or for specialist types of audit (for example, pedestrian and bicycle audits).
One criticism of road safety audits in the past is that the recommendations from the audit are not implemented. It is therefore critical that there be a process to complete the audit, including a formal response to the report. This should document a response to each of the actions recommended; and in cases where recommendations have not been accepted, the reasons for this and any other mitigating strategy that will be undertaken to help minimise risk should be stated. This written response to the audit report should become part of the project documentation.
Harwood et al. (2014) suggested that audit was a costly method for identifying interventions, and that there is potential to miss interventions that could be added that are cost-effective ways to improve safety. Also, economic assessment of interventions is typically not included unless conducted as an addition to the normal audit process. On the positive side, they suggest that audit is a useful way to identify safety features that are missing or in poor condition, and that they are a good way to bring together expert staff to review safety. They also identified advantages in conducting field reviews (i.e. site inspections), a process not always undertaken in other methods of risk assessment.
It is important to note that the road safety audit process has been around for many years. It was first established in the late 1980s, with documentation developed in many countries from the 1990s. However, there has been little recent adjustment of the road safety audit process to include Safe System concepts. In some countries, the focus is shifting to better capture issues related to eliminating death and serious injury, although this has always been an integral part of the audit process. The focus remains primarily on road-based deficiencies and the solutions are generally aimed at improving the road environment. In many situations, this approach may be adequate; however, to take a Safe System-based approach, some jurisdictions have developed assessment frameworks that could be considered Safe System audits. These differ to traditional audits because they focus attention on the reduction of fatal and serious casualties and/or take a more holistic view of problems (and solutions) involving each of the Safe System pillars (e.g. safe user issues such as fatigue, potential for speed related crashes). The Australia case study provides one such example.
A further example was developed by the Department of Planning, Transport, and Infrastructure (DPTI) in South Australia. This involved a full Safe System assessment for a major project and was used as part of a successful business case to government to secure funding. The approach differed from a typical audit because it assessed vehicle and behavioural issues as well as the typical infrastructure issues. Interestingly, some of the vehicle and behavioural issues identified were able to be addressed through infrastructure changes (also see the discussion in Designing Infrastructure to Encourage Behavior).
In a recent development, quantified audits have been undertaken to determine the impact of new design. Changes can be made to this design and likely safety improvements determined. An example of this approach is provided in Management Tools.

© ARRB Group
The PIARC Road Safety Inspection Guideline for Safety Checks of Existing Roads (2012a) defines a road safety inspection (RSI) as a systematic, on-site review of an existing road with the aim of identifying hazardous conditions, faults and deficiencies that may lead to serious crash outcomes. An RSI must be carried out by an independent, qualified individual or team with the relevant experience, and is specific to existing roads, not those under construction. It is also a proactive method in that the prevention of crashes is achieved through identification of potential safety issues, rather than responding to recorded crashes in a crash location investigation.
Road safety inspections are useful as they can:
The PIARC (2012a) guide identifies the following topics as necessary to be covered during an RSI, as well as some of the questions a safety check team should be considering during an investigation:
There are four main steps to a road safety inspection on an existing road.
An on-site field study component of RSI has evolved in recent years. Survey vehicles can be equipped with automated devices to measure and record design and road management elements (e.g. horizontal and vertical alignment, super-elevation, pavement surface condition, presence of roadside hazards, road inventory etc.). This information can be assessed to detect issues with routes, such as anomalies in curvature (e.g. unexpected severe curves); slippery road surface or presence of roadside hazards. Further details on this data collection can be found in Section 5.4.
A road safety inspection of an existing road aims to detect features that may lead to future crashes, and past crash information is not always a good indicator of this. Crash investigation and prevention programmes look at features that contribute to the occurrence and severity of crashes that have already happened. An RSI does not require crash data, but it can be a useful tool in terms of providing guidance towards prioritising which roads should be inspected. For instance, if the road authority only has enough funding to inspect a select number of roads, priority can be given to roads with a high number of crashes per kilometre, or crashes per traffic volume. More detail on prioritisation of policies, projects and treatments can be found in Priority Ranking Methods and Economic Assessment. Road safety inspections can be a useful complement to reactive approaches, such as high crash location investigations.
Sometimes RSI is undertaken on specific themes, for instance to identify issues relating to pedestrians or bicycles. This approach has been developed even further in France, where a method involving a specially equipped bicycle has been established to assess the bicycle network. Further information on this approach can be found at the following link: http://www.ouest.cerema.fr/IMG/pdf/120925_Securite-routiere_Velaudit_cle05dc7d.pdf.
An RSI is not the same as a routine maintenance check, where issues such as vegetation, road surface inconsistencies and poor quality signage are reviewed and remedied. However, an RSI can identify safety issues that are a result of poor maintenance, such as poor signing, line marking or visibility issues.
Road safety inspections can lead to:
Human factors are a crucial part of identifying hazards at a site. Further discussion on this issue can be found in Design for Road User Characteristics and Compliance.
Road safety inspections can be performed on the whole road network or on specific locations that are regarded as being the greatest risk. This is dependent on the road authority. It is important to note that road safety inspections of existing sites can result in a huge number of identified hazards and road safety issues. Under these circumstances, it is not economically viable to attend to all the issues listed. There is also little benefit to conducting an RSI on a site if the resources will not allow the majority of hazards to be addressed following the inspection. Sometimes it is more beneficial to invest in a maintenance programme to address a number of issues rather than conduct a formal RSI.
The PIARC Road Safety Inspection Guideline for Safety Checks of Existing Roads (2012a) provides a number of helpful checklists for different road types to ensure that each investigation of a site considers all the necessary elements. The checklists are similar in nature to those used for road safety audit. The guide also provides examples of appropriate RSI reports for both inter-urban and urban main roads. The African Development Bank (2014c) has recently released guidance on Road Safety Inspection that is specifically intended for use in LMICs.

© ARRB Group
Recognizing the critical need to improve pedestrian infrastructure quality and safety, PIARC developed the Walkability Checklist and the Checklist for Quality and Safety Inspections of Pedestrian Infrastructure. Both of these Checklists are discussed in detail in the following article: Pedestrian Audits - A Checklist for Safety and Quality Inspection of Pedestrian Infrastructure. The intent of these checklists are to find optimal solutions for walking and sojourning. The checklists incorporated Rumar's order of problems approach, where there orders of requirements are defined in three levels (Rumar, 2002). The first level requirements are those visible, tangible and concrete requirement concerning the physical environment, pedestrians, vehicles and the behaviours of other road users. The second order requirements concern the tactical level facilities and services, such as how the network is designed and operates, the traffic rules, and enforcement, management of the system and other like elements. The third order requirements allow the first and second order requirements to be met. These include land use characteristics, mode split, pedestrian quality, the culture, and other aspects that relate to the ease and desire to walk. The Walkability Checklist considers the design of the roadside environment as first order requirements, with traffic rules and traffic flow as second order requirements. The checklist recognise that requirements go beyond objects, facilities and services to consider context, process and procedures. The Walkability Checklist reviews pedestrian quality elements and whether general walkability requirements are fulfilled. The Checklist also helps define the stakeholders' responsibilities for the walkability requirements under consideration and what procedures need to be applied.
The Checklist for Quality and Safety Inspections of Pedestrian Infrastructure (CQSI) builds upon the Pedestrian Quality Needs (PQN) Inspection process. In general, the PQN is a systemic onsite expert review of the walking condition requirements through identification of hazardous conditions, faults and deficiencies that reduce pedestrian demand, conditions, comfort and safety. Because the PQN considers the quality and safety concerns of the pedestrian infrastructure, the CQSI was developed as the next step to the PQN. The checklist is intended to identify all of the relevant deficiencies of the pedestrian infrastructure. The photo below provides an example of a pedestrian deficiency that might be identified through the pedestrian audit process.
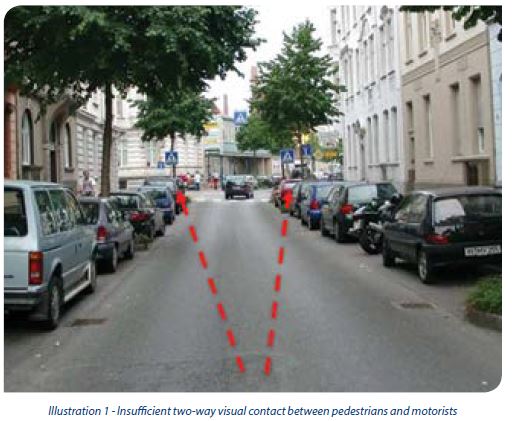
Example of pedestrian deficiency (Source: Routes/Roads 2018 - N 376 - www.piarc.org
The proactive approach has been extended with a method that takes a quantified approach to the inspection of existing roads and road designs. Although several approaches exist, the most commonly applied is the Road Assessment Programme (RAP). Different RAP programmes exist in different regions, including EuroRAP, USRAP, AusRAP, KiwiRAP and ChinaRAP. These all fall under the global banner of iRAP (the International Road Assessment Programme). PIARC (2012b) notes that the iRAP approach is of great benefit where crash data is unavailable or coverage is limited.
RAPs take the concept of road safety audit and inspection a step further by estimating the risk (based on likelihood and severity) for different road sections based on road and roadside characteristics. A number of road elements are collected (e.g. through video and subsequent desk-based assessment; also see Non Crash data and Recoding Systems). Based on research conducted over many years, a lot is known about each of these variables, and the level of risk each produces. As an example, a straight section of road is safer than a road with a severe bend, and this risk level can be quantified. Each of the variables is quantified and an algorithm determines the risk of a fatal or serious injury for each segment of road (iRAP uses 100 m segments).
Such an assessment can be used to identify the highest risk and lowest risk segments of a network or road. A five-star rating system is used, with a one-star road providing the poorest road infrastructure, while on a five-star road the likelihood of a crash occurring and the severity of those that do occur is lowest. This information can also be colour-coded to provide a quick visual indication of road infrastructure safety. The process also allows separate star ratings for different types of road user (e.g. the vehicle occupant, pedestrian, bicyclist and motorcyclist).
The information can also be used to identify safety improvements that may be implemented, both at specific locations and across a whole network. Calculations can be updated to determine the likely safety benefit from such improvements. With knowledge of treatment costs and their benefit, as well as estimates of fatal and serious crash outcomes for a road network, an economic calculation can be undertaken to determine the most beneficial group of treatments to be applied to a road network or at a location. The software for this analysis is available online, and is provided free to road authorities to use. Further details on this can be found in Intervention Selection and Identification while a detailed description of the iRAP approach can be found at www.irap.org.
Reflecting the strong empirical basis behind the iRAP model, there is a strong linkage between the star rating of a road and the actual safety performance. An analysis performed by McInerney & Fletcher (2013) based on star ratings and crash cost (the average vehicle occupant fatal and serious injury crash costs per vehicle kilometre travelled) for almost 1,700 km of highway provides an example of this relationship. For each reduction in star rating (i.e. improvement in safety), the crash cost roughly halved. When moving from 1 star to 2, the crash cost reduced by 40%; from 2 star to 3 costs reduced by 61%; and from 3 star to 4 costs reduced by 44%.
Harwood et al. (2014) assessed the US RAP tools and compared this approach to other methods of assessing risk. They suggested that the approach was the most robust and quantitative in selecting interventions to improve safety, and that the recommendations were accompanied by economic assessment often missing in other methods. However, the approach was also identified as being quite labour intensive, with reliance on collecting roadway data and the coding of this data by skilled staff. However, they also suggested that this could be accomplished in a reasonably efficient manner. The consideration of risks associated with specific road user groups (motorcyclists, pedestrians, bicyclists as well as vehicle occupants) was also seen as an advantage.
A similar approach was adopted in South Africa, with the use of Netsafe
Both the historical crash-based approach (reactive) and the assessment of risk through proactive means provide information on likely future crash locations. Combining these two approaches can provide a fuller picture of current risk locations, and where fatal and serious injury (FSI) casualties are most likely to occur in the future. Several approaches are emerging around the world that attempt to combine these methods to provide a fuller understanding of crash risk.
A ‘systemic’ safety project approach has been in the USA since the mid-1990s, first used in Washington State and recently throughout the USA (Preston et al., 2013). The systemic approach focuses on network-wide solutions and has been used by numerous states in the USA over the past decade. The System Safety Project Selection tool was developed by Federal Highway Administration in the USA. This approach involves several steps, drawing on both crash data as well as other sources of information to identify and treat risk. The steps are as follows:
— by selecting crash types and facilities with the greatest number of severe crashes across the system;
— by identifying and evaluating crash risk factors through examining the traffic volume, roadway/intersection features, posted speed limit, etc.
— by prioritising locations through conducting a risk assessment and prioritising roadway facilities.
The systemic approach identifies treatment sites that are not typically identified through traditional reactive analytical techniques (see Crash-based Identification (‘Reactive’ Approaches)). Central to this approach is the risk assessment approach, which involves the collection of roadway and traffic characteristics that relate to the selected risk factors and crash types. This is used to help identify the potential for locations or road segments to have severe crash outcomes. It is suggested that such information be collected either from existing road and traffic databases or collected as part of a field review. In an example provided by Preston et al. (2013), an assessment of curves on a rural network identified a number of sites that had common risk characteristics as locations with severe crash outcomes, but that did not have a documented severe crash. It should be noted that the approach can be used with or without crash data.
Harwood et al. (2014) reviewed the systemic approach, identifying several strengths as well as areas for potential improvement. They suggested that this approach required less roadway data than other tools, did not require crash data to identify specific crash locations, and provided greater flexibility for target crash types and risk factors. However, this flexibility was also seen as a possible weakness, as there is a reliance on users to identify potential risk factors, weight these risk factors, include issues such as traffic volume, and to conduct a cost-benefit analysis (an optional task) as part of intervention selection.
An approach has been developed in Australia that combines crash data with a more proactive approach. The Australian National Risk Assessment Model (ANRAM) provides road agencies in Australia with a nationally consistent system for identification, measurement and reporting of severe crash risk. ANRAM was developed in close consultation with road agencies and the Australian Automobile Association (AAA) to ensure that the system’s outputs could drive preparation of future road safety engineering programmes. This was especially important for rural and local roads where severe crashes are generally too scattered to attract traditional blackspot funding. However, it was also recognised that these scattered crashes form a large proportion of all fatal and serious injury crash outcomes.
ANRAM draws together a number of approaches, from traditional crash-based assessment, Road Assessment Programmes and the US Highway Safety Manual (HSM; AASHTO, 2010). The HSM proposes a method that identifies a level of safety performance for different types of roads. There will be individual variation from this mean crash frequency, which may be due to each location’s variation in road features and operational factors that differ from the mean represented by the model, and due to statistical error. This variation in road features can be measured and the effect of this variation calculated; and in the case of ANRAM, the iRAP model (AusRAP in Australia) is used to do this. The process leads to a predicted number of crashes based on road design elements and features. This ‘proactive’ assessment of risk forms one of the key inputs to the identification of fatal and serious injury crash locations.
The basic structure of ANRAM is provided in Figure 10.9. Further details on this approach can be found in Steinmetz et al. (2014).
")
Figure 10.10 Structure of the Australian National Risk Assessment Model (ANRAM)
In New Zealand, the High Risk Rural Roads Guide (NZ Transport Agency, 2011) provides guidance on the use of crash data and predictive risk approaches (such as KiwiRAP) to determine high risk locations.
The New Zealand approach involves calculation and assessment of collective and personal (or individual) risk. Collective risk indicates crash frequency as experienced by the community, i.e. annual average crashes per kilometre of road being assessed. Personal (or individual) risk indicates risk to an individual road user expressed per kilometre of travel by a vehicle, i.e. annual average crashes per vehicle-kilometres travelled (VKT). Historical crash data (reactive) and/or predictive risk assessment (proactive) is used. Both approaches use a scale to categorise the level of risk: high (black), medium-high (red), medium (orange), low-medium (yellow) and low (green).
Using historical crash data (reactive approach) to identify the highest risk sections along the road, the collective and personal risk is categorised into different risk levels. Using this information, the highest risk sections of the road can be identified.
Alternatively, or in addition, a predictive risk assessment approach can be used. KiwiRAP star rating and road protection scores assess road crash risk based on road infrastructure (engineering) features. Star ratings (which typically apply to five kilometre road sections) are derived from the road protection scores (which are calculated for each 100 m segment). Figure 10.10 provides an example of risk categorisations that may be applied.
 - Source: NZTA (2011).")
Figure 10.11 Example of predictive assessment (‘proactive’) - Source: NZTA (2011).
The New Zealand Guide (NZ Transport Agency, 2011) recommends crash data analysis and review of key risk factors to inform development of an appropriate treatment programme to address the identified risk. Consideration of a road’s collective and personal risk helps guide the approach to road safety investment (refer to Project-Level and Network-level Approaches).
AASHTO (2010) Highway Safety Manual, American Association of State Highway and Transportation Officials, Washington D.C.
African Development Bank, 2014a, Road safety manuals for Africa - Existing Roads: Reactive Approaches, African Development Bank, Tunis, Tunisia.
African Development Bank, 2014b, Road safety manuals for Africa - New Roads and Schemes: Road Safety Audit, African Development Bank, Tunis, Tunisia.
African Development Bank, 2014c, Road safety manuals for Africa - Existing Roads: Proactive Approaches, African Development Bank, Tunis, Tunisia.
Austroads 2009a, Guide to Road Safety Part 8: Treatment of Crash Locations, Austroads, Sydney, Australia.
Austroads 2009b, Guide to Road Safety Part 6: Road Safety Audit. Austroads, Sydney, Australia.
De Roos, M., Job, R.F.S., Graham, A. Levett, S. 2008, Strategic road safety successes from multi-disciplinary highway safety reviews. Proceedings of Safe Highways of the Future Conference, Brussels, Belgium, February, 2008.
Eenink, R, Reurings. M, Elvik, R, Cardoso, J, Wichert, S & Stefan, C (2008), Accident Prediction Models and Road Safety Impact Assessment: recommendations for using these tools. Deliverable D.2. Ripcord-Riserest.
ETSC 1997, Road Safety Audit and Safety Impact Assessment, European Transport Safety Council, Brussels, Belgium.
EuroRAP 2013, Development of a Safer Road Corridors Investment Plan World Bank project 1080490: Safer Roads Investment Plan, European Road Assessment Programme, Basingstoke, United Kingdom.
FHWA, 2006, Road Safety Audit Guidelines, Federal Highway Administration, Washington DC.
Harwood, D, Souleyrette, R, Fields, M, & Green, E 2014, Comparison of Countermeasure Selection Methods for Use in Road Safety Management, 93rd Transportation Research Board Annual Meeting, Washington DC, USA.
Macaulay, J & McInerney, R 2002, Evaluation of the proposed actions emanating from road safety audits, Austroads, Sydney, Australia.
Marsh, B (2012), Towards Zero Road Planning, Design and Construction, 25th ARRB Conference – Shaping the future: Linking policy, research and outcomes, Perth, Australia
McInerney, R and Fletcher, M 2013, Relationship between Star Ratings and crash cost per kilometre travelled: the Bruce Highway, Australia, International Road Assessment Programme, Basingstoke, United Kingdom.
NRA National Roads Authority of Ireland, 2012, Road Safety Impact Assessment (HD18), Dublin, Ireland.
NZ Transport Agency (2011), High Risk Rural Roads Guide. New Zealand Transport Agency, Wellington, New Zealand.
PIARC (2011) Road Safety Audit Guide, Report 2011R01EN, World Road Association, Paris, France.
PIARC (2012a) Road Safety Inspection Guideline for Safety Checks of Existing Roads, Report 2012R27EN, World Road Association, Paris, France.
PIARC (2012b), Comparison of National Road Safety Policies and Plans, PIARC Technical Committee C.2 Safer Road Operations, Report 2012R31EN, The World Road Association, Paris.
PIARC (2013) Road accident investigation guidelines for road engineers, Report 2013R07EN, World Road Association (PIARC), Paris, France.
Preston, H, Storm, R, Bennett, J D, & Wemple, B, 2013, Systemic safety project selection tool, FHWA, Washington DC.
RoSPA (2007).Road safety engineering manual, Royal Society for the Prevention of Accidents, Birmingham, UK.
Schermers, G, Cardoso, J, Elvik, R, Weller, G, Dietze, M, Reurings, M, Azeredo, S, and Charman, S, 2011, Recommendations for the development and application of Evaluation Tools for road infrastructure safety management in the EU, Deliverables Nr 7 of the European Road Infrastructure Safety Management Evaluation Tools (RISMET) project, Eranet Roads, Leidschendam, Netherlands.
Steinmetz, L, Jurewicz, C & Excell, R 2014, Implementation of Australia’s New Road Crash Risk Assessment Approach, Routes – Routes/Roads no 363, PIARC, Paris, France.
SWOV, 2007, The blackspot approach. SWOV Factsheet. SWOV, Leidschendam, the Netherlands. September 2007. http://www.swov.nl/rapport/Factsheets/UK/FS_Blackspots.pdf.
TRB, (2015), NCHRP Report 600: Human Factors Guidelines for Road Systems: Second Edition, Transportation Research Board, National Cooperative Research Program, Washington D.C., USA
Directive 2008/96/EC of the European Parliament and of the Council on road infrastructure safety management
WHO 2010, Data systems: a road safety manual for decision-makers and practitioners, World Health Organization, Geneva, Switzerland.