10.5 Combining Crash Data and Road Data
Both the historical crash-based approach (reactive) and the assessment of risk through proactive means provide information on likely future crash locations. Combining these two approaches can provide a fuller picture of current risk locations, and where fatal and serious injury (FSI) casualties are most likely to occur in the future. Several approaches are emerging around the world that attempt to combine these methods to provide a fuller understanding of crash risk.
A ‘systemic’ safety project approach has been in the USA since the mid-1990s, first used by the Washington State Department of Transportation and recently throughout the USA (Preston et al., 2013). The systemic approach focuses on network- wide solutions and has been used by numerous states in the USA. The System Safety Project Selection tool was developed by Federal Highway Administration in the USA. This approach involves several steps, drawing on both crash data as well as other sources of information to identify and treat risk. The steps are as follows:
- Analyse road crash data – by system (state and local level), road type, location, and location type (urban/rural, divided/undivided, intersection/segment), with a focus on severe crashes.
- Identify crash locations:
- By selecting crash types and facilities with the greatest number of severe crashes across the system.
- By identifying and evaluating crash risk factors through examining the traffic volume, roadway/intersection features, posted speed limit, etc.
- By prioritising locations through conducting a risk assessment and prioritising roadway facilities.
- Prioritise programmes – through a countermeasure selection decision process, developing safety projects and prioritising their implementation.
- Rank projects – by determining the distribution of safety funds among the projects identified through site analysis and systemic risk assessment.
- Evaluation – of consistency (whether the programme met the spending goals), changes in severe target crash types, and countermeasure performance.
The systemic approach identifies treatment sites that are not typically identified through traditional reactive analytical techniques (see Section 10.3 Crash-based Identification (‘Reactive’ Approaches)). Central to this approach is the risk assessment approach, which involves the collection of roadway and traffic characteristics that relate to the selected risk factors and crash types. This is used to help identify the potential for locations or road segments to have severe crash outcomes. It is suggested that such information be collected either from existing road and traffic databases or collected as part of a field review. In an example provided by Preston et al. (2013), an assessment of curves on a rural network identified a number of sites that had common risk characteristics as locations with severe crash outcomes, but that did not have a documented severe crash. It should be noted that the approach can be used with or without crash data.
Harwood et al. (2014) reviewed the systemic approach, identifying several strengths as well as areas for potential improvement. They suggested that this approach required less roadway data than other tools, did not require crash data to identify specific crash locations, and provided greater flexibility for target crash types and risk factors. However, this flexibility was also seen as a possible weakness, as there is a reliance on users to identify potential risk factors, weight these risk factors, include issues such as traffic volume, and to conduct a cost-benefit analysis (an optional task) as part of intervention selection.
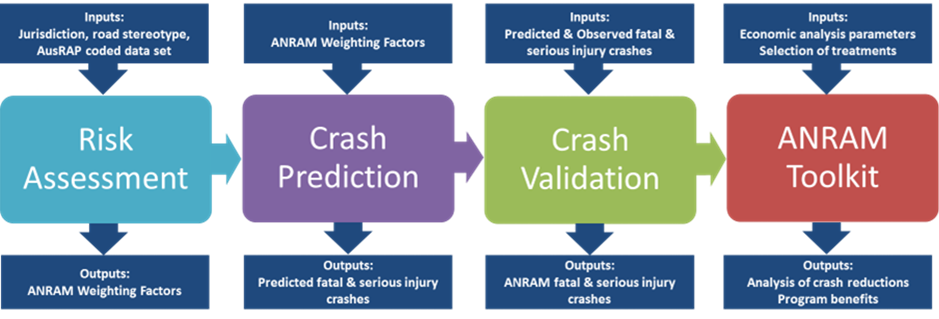
An approach has been developed in Australia that combines crash data with a more proactive approach. The Australian National Risk Assessment Model (ANRAM) provides road agencies in Australia with a nationally consistent system for identification, measurement and reporting of severe crash risk. ANRAM was developed in close consultation with road agencies and the Australian Automobile Association (AAA) to ensure that the system’s outputs could drive preparation of future road safety engineering programmes.
This was especially important for rural and local roads where severe crashes are generally too scattered to attract traditional blackspot funding. However, it was also recognised that these scattered crashes form a large proportion of all fatal and serious injury crash outcomes.
ANRAM draws together a number of approaches, from traditional crash-based assessment, Road Assessment Programmes and the US Highway Safety Manual (HSM) (AASHTO, 2025). The HSM proposes a method that identifies a level of safety performance for different types of roads. There will be individual variation from this mean crash frequency, which may be due to each location’s variation in road features and operational factors that differ from the mean represented by the model, and due to statistical error. This variation in road features can be measured and the effect of this variation calculated. In the case of ANRAM, the iRAP model (AusRAP in Australia) is used to do this. The process leads to a predicted number of crashes based on road design elements and features. This ‘proactive’ assessment of risk forms one of the key inputs to the identification of fatal and serious injury crash locations.
The basic structure of ANRAM is provided in Figure 10.22. Further details on this approach can be found in Steinmetz et al. (2014).

In New Zealand, the ‘High-Risk Rural Roads Guide’ (NZTA, 2011) provides guidance on the use of crash data and predictive risk approaches (such as KiwiRAP) to determine high risk locations.
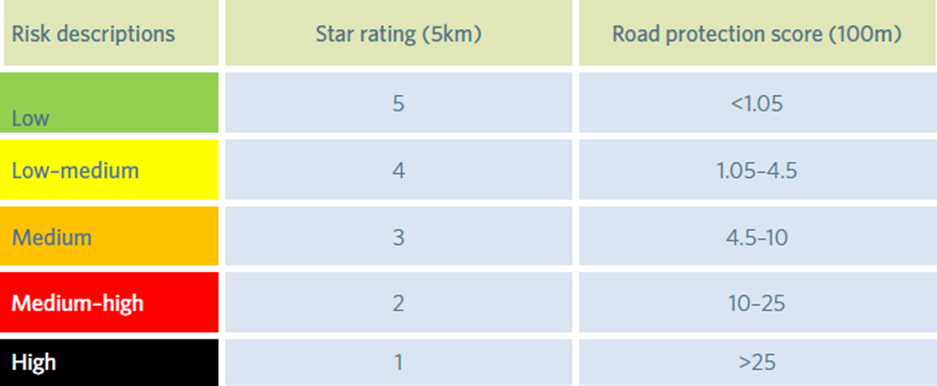
The New Zealand approach involves calculation and assessment of collective and personal (or individual) risk. Collective risk indicates crash frequency as experienced by the community, i.e. annual average crashes per kilometre of road being assessed. Personal (or individual) risk indicates risk to an individual road user expressed per kilometre of travel by a vehicle, i.e. annual average crashes per vehicle-kilometres travelled (VKT). Historical crash data (reactive) and/or predictive risk assessment (proactive) is used. Both approaches use a scale to categorise the level of risk: high (black), medium-high (red), medium (orange), low-medium (yellow) and low (green).
Using historical crash data (reactive approach) to identify the highest risk sections along the road, the collective and personal risk is categorised into different risk levels. Using this information, the highest risk sections of the road can be identified.
Alternatively, or in addition, a predictive risk assessment approach can be used. KiwiRAP star rating and road protection scores assess road crash risk based on road infrastructure (engineering) features. Star ratings (which typically apply to five kilometres road sections) are derived from the road protection scores (which are calculated for each 100 m segment). Figure 10.23 provides an example of risk categorisations that may be applied.

The New Zealand Guide recommends crash data analysis and review of key risk factors to inform development of an appropriate treatment program to address the identified risk. Consideration of a road’s collective and personal risk helps guide the approach to road safety investment (refer to Section 11.2 Project-Level and Network-level Approaches).
In Europe, in accordance with the provisions of Directive 2008/96/EC (as amended by Directive (EU) 2019/1936), an integrated methodology for a common Network-Wide Road Safety Assessment (NWA) and a common safety rating system for classification of the existing road network in categories has been developed in 2023 (EC, 2023). The methodology developed integrates proactive (in-built safety) and reactive (crash occurrence) safety assessments. The NWA-proactive methodology ranks road sections based on their in-built safety characteristics. Sections are classified as Low risk (class 1), Intermediate risk (class 2), and High risk (class 3). The NWA-reactive methodology ranks road sections based on their crash statistics. Sections/ junctions are classified as Low risk (class 1), Unsure (class 2), High risk (class 3). The NWA-integrated methodology, based on a set of rules, combines the ranking of the two methodologies in the final ranking consisting of 5 classes: Very High Priority (class 5), High Priority (class 4), Intermediate Priority (class 3), Low Priority (class 2), Very Low Priority (class 1) (Figure 10.24).
More details on the methodology, its development and use can be found here.


