
Part II "Road Safety Management" presents strategies for delivering targeted improvements and detailed guidance on how to plan, design, prioritize, implement, and manage these interventions within a country’s road network

© ARRB Group
Road safety management is the first and fundamental pillar of the Decade of Action’s Global Plan (UNRSC, 2011) and the Global status report on road safety 2015 (WHO, 2015) and remains critical for successful implementation of the Global Plan for 2021-2030 (UNRSC, 2021). The Decade of Action and the Global Plan emphasise that improving road safety performance requires a systematic and planned approach. Establishing an effective road safety management system is the means by which countries and organisations can achieve this.
This chapter serves as a brief introduction to the key elements of effective road safety management system frameworks and new tools. The aim is to outline the general scope of understanding of the road safety management task to provide background and context for more specific guidance that follows throughout this manual.
The chapter highlights the importance of institutional management at all levels to provide the foundation for successful road safety intervention and sustainable results. It emphasises the overarching importance of governmental leadership at the country level and top management leadership of road safety in organisations. New tools are presented which are designed to help countries and organisations develop or improve their road safety management systems. Practical next steps which countries can take towards these ends are briefly outlined and are developed further in subsequent chapters.
LMICs need to work actively to establish and develop their road safety management systems to address challenging road safety problems in a systematic way.
All countries need to review their performance and benchmark it against effective practice before developing new road safety strategies and plans and projects.
All countries should consider adopting the long-term Safe System goal, set interim targets (initially at project level for LMICs) and move to implement effective measures towards its delivery for example, using funded demonstration projects to build new capacity. All countries should target high concentrations of fatal and serious injuries on sections and areas of the road network where the biggest gains can be made.
New review tools, international professional networks and international development aid can help LMICs get started. Technical assistance in crash database development, infrastructure safety improvements, and general deterrence-based road safety enforcement programmes can be provided by the International Road Traffic Accident Database Group (IRTAD), the International Road Assessment Programme (iRAP), and the International Road Policing Organization (RoadPOL), respectively.
This section presents a brief summary of road safety management system frameworks and related tools for jurisdictions and organisations. The user of this manual is encouraged to consult original sources and the links to detailed information about road safety management frameworks, tools and their use, which are provided throughout the section.
Countries with the safest road networks demonstrate many common characteristics in their management of road safety. They have targeted better safety outcomes, adopted a systematic approach to intervention, and put in place a range of institutional arrangements which have been built up over many years (OECD, 2008; GRSF, 2009, 2013).
For more information:
These tools are designed to assist decision-makers and practitioners anywhere in the world in developing sustainable management systems. They outline pragmatic steps to build initial capacity to achieve road safety results. These tools are designed to be mutually reinforcing. They provide guidance on accountable, results-focused institutional management; promote the adoption of the Safe System goal and approach with interim targets and encourage implementation of demonstrably effective interventions to address known risk factors associated with death and serious injury in road crashes.
The main focus of this section is the country or jurisdictional road safety management system. A brief outline of the international standard for organisations is given in Institutional Management Functions in Management System Framework and Tools.
A road safety management assessment framework has been developed based on effective practice which identifies those elements of management that are crucial to improving country/jurisdictional road safety performance (GRSF, 2009; 2013). Safety is produced just like other goods and services and the production process in the framework illustrated in Figure 3.1, is viewed as a management system with three levels: institutional management functions produce interventions, which in turn produce desired results.

Figure 3.1 The road safety management system
The following sections provide a brief description of the three management system elements shown in Figure 3.1.
The foundation of an effective country road safety management system is institutional management, as indicated in the bottom level of the pyramid shown above. Key elements of effective institutional management have been identified and defined through global study of management systems and leadership arrangements in countries and jurisdictions that have achieved substantial reductions in deaths and serious injuries (as well as those in countries without such arrangements and which have been less effective) (OECD, 2008; GRSF, 2009; 2013, GRSF 2006–09, ITF 2016). These are outlined in Box 3.1.
Source: GRSF, (2009).
The overarching function and the rationale for the management system is to reduce crashes leading to fatal and serious injuries (results focus). This represents the expression of a country or jurisdiction’s desire to achieve better road safety results through performance review; analysis of the scope for crash reduction efforts, setting long-term goals and interim targets for road safety strategies, programmes and projects and providing the means and accountabilities needed to achieve them. The delivery of this function is discussed fully in Road Safety Targets, Investment Strategies Plans and Projects. Supporting this key function are defined arrangements and capacity for coordination, legislation, funding and resource allocation; promotion; monitoring, analysis and evaluation, research and innovation, knowledge development and transfer. In the absence of a clear and accountable focus on fatal and serious crash reduction, all other institutional management functions and interventions lack cohesion and direction, and the efficiency and effectiveness of safety initiatives can be undermined (GRSF, 2009; 2013). For these reasons and as advised in Road Safety Targets, Investment Strategies Plans and Projects, LMICs should exercise caution in establishing complex targeted strategies and plans until data and appropriate management capacity are available. However, measurement of safety performance and targeting specific results is recommended in funded, ‘learning by doing’ demonstration corridor/area projects.
Institutional management functions are delivered primarily by the government agencies with core road safety responsibilities – e.g. transport, land-use planning, roads, justice, police, health, occupational health and safety and education. They are also delivered in government partnerships with civil society and business, in alignment with country and organisational goals and targets. The professional and research community provide key support for demonstrably effective next steps. As highlighted previously, governmental leadership and the setting up of a governmental lead agency are prerequisites for successful activity (Peden et al., 2004; OECD, 2008, GRSF, 2009, 2013).
Institutional management functions and examples of their delivery are referred to throughout this manual. A range of in-depth case studies which illustrate successful country delivery can be found in Annex 2 and Annex 4 of the road safety management guidelines produced and used by the World Bank (GRSF 2009).Road Safety Targets, Investment Strategies Plans and Projects as well as Annex 3 and Annex 4 of global road safety management guidance (GRSF 2009, 2013) provide guidance on establishing or strengthening lead agency arrangements.

The second element of the road safety management system framework outlined in Figure 3.1 is system-wide intervention. Effective intervention focuses on the implementation of evidence based approaches to reduce exposure to the risk of death and serious injury; to prevent death and serious injury; to mitigate the severity of injury when a crash occurs, and to reduce the consequences of injury. Interventions need to address the safety of all users and take future demographics into account, notably the physical vulnerability of very young and of the ageing society.
A common misperception in countries getting started in road safety is to assume that since 90% of crashes may be due to human error, then direct approaches relying heavily upon education and training play a substantial part in saving lives and preventing serious injuries. Although these measures play a supportive role, there is little evidence to confirm that education and training, alone, will achieve road safety results. Speed management, the safety engineering of vehicles and roads and improvements in the emergency medical system response are observed to play the major role (Peden et al., 2004). At the same time, the Safe System goal requires the examination of contributory factors in road safety engineering and other interventions to shift from a focus on crash prevention to a focus on death and serious injury prevention. Again, research on contributory factors to deaths and serious injuries indicates that intervention to improve speed management and the intrinsic safety of vehicles and the road environment all have a major role to play in addressing this new focus (Stigson et al., 2011).
The Global Road Safety Facility (GRSF) has developed an evidence-based guide on "what works and what does not work" when selecting and applying road safety interventions that are effective in reducing fatal and serious injuries (Turner et.al., 2021). The guide highlights that not all road safety interventions are equally effective and that what appear to be "common-sense" interventions will often not be the best, and in some cases may have very limited or even negative impacts, despite being commonly - and mistakenly recommended or accepted. The guide sets out evidence and presents case studies on interventions within a Safe System context and with a focus on LMICs, although the information presented is of relevance to all countries.
Better performing countries implement integrated packages of road safety interventions that have demonstrated significant performance gains as well as implementing innovation based on established safety principles. The findings of the World Report on Road Traffic Injury Prevention provide a substantial consensus-based blueprint for country, regional and global action, and have subsequently been endorsed by successive United Nations General Assembly resolutions (Peden et al., 2004). Reports by the OECD, ITF and World Bank (e.g., OECD, 2008; ITF, 2016; Turner et. al., 2021) also provide international reviews on the effectiveness of interventions. Information is also available from the SUNflower study (Koornstra et al., 2002), the European Road Safety Observatory (2014) and guidance produced by the UNRSC (2006–13). Key recommended intervention strategies include:
Examples of highly effective road safety interventions within a Safe System context are highlighted in Box 3.2.
Highly effective countermeasures
This manual is intended to provide clear and accessible information on the effective management of road safety infrastructure with a focus on the selection and application of road infrastructure interventions. To produce rapid results, road safety programmes must initially target high concentrations of crash deaths and serious injuries on sections of the road network where the biggest gains can be made.
The planning, design, operation and use of the road network is generally called road infrastructure safety management (RISM) as described in the 2008 EU directive (and as outlined in Part 3 of this manual). The products and services used within RISM address the conditions under which vehicles and road users can safely use the road network combined with the safe recovery and rehabilitation of crash victims. In all these areas, specific standards, rules, guidelines, policies and protocols are set with compliance and oversight mechanisms in place
This manual does not set out to provide detailed guidance on road safety intervention in general but relates specifically to the planning, design, operation and use of the road network within the context of the RISM process.. See Part 3 Chapter 9 Infrastructure Safety Management and Chapter 10 Risk and Issue Identification for information on the RISM process including approaches to infrastructure safety management and assessing road network risks, respectively. Then, see Chapter 11, Intervention Selection and Prioritisation for guidance on intervention selection and prioritisation to address these risks. Here, cross references are also made to key work carried out by PIARC which includes its recent work and guidance on road hierarchies which provide a fundamental framework for safety management of the road network.
The final element of the road safety management system shown in Figure 3.1 concerns the measurement of results and their expression as targets in terms of final outcomes, intermediate outcomes, and outputs (Bliss, 2004). Targets define the desired safety performance endorsed by government at all levels, stakeholders and the community. The level of safety is ultimately determined by the quality of interventions that have been implemented, which in turn are determined by the quality of the country’s delivery of institutional management functions. The GSRF highlighted a few examples of success in Leveraging Global Road Safety Successes (2016)
Final outcomes can be expressed as a long-term goal for the future safety of the road traffic system (e.g. as in Safe System, Vision Zero) and interim, short- to medium-term targets towards this expressed in terms of social costs, fatalities and serious injuries usually presented in absolute terms. They can also be measured and targeted in terms of rates per capita, vehicle, and volume of travel. See IRTAD (2014) for further discussion.
Intermediate outcomes are linked to improvements in the final outcomes and typical measures include average traffic speeds, the proportion of drunk drivers in fatal and serious injury crashes, seatbelt-wearing rates, helmet-wearing rates, the physical condition or safety rating of the road network (e.g. iRAP ratings), the standard or safety rating of the vehicle fleet (e.g. Global NCAP ratings), and emergency medical system response. See ITF (2016) for further discussion on intermediate safety performance indicators.
Outputs represent physical deliverables that underpin improvements in intermediate and final outcomes. Examples are kilometres of safety engineering improvements implemented and the number of police enforcement operations required to reduce average traffic speeds, increase seatbelt use or reduce drinking and driving. They can also correspond to milestones showing a specific task has been completed (Bliss, 2004).
Countries active in road safety are increasingly setting measurable final outcome and intermediate outcome targets. In some cases, they also set related measurable output targets in line with the targeted outcomes. As mentioned previously, in many LMICs, where capacity to implement national targeted plans is non-existent or in a fledgling state, countries are advised to adopt the long term Safe System goal but to restrict the setting of quantitative targets to funded corridor and area demonstration projects. Road Safety Targets, Investment Strategies, Plans and Projects provides guidance on road data systems, which allow the setting and monitoring of targets. Case studies are presented in Roles, Responsibilities, Policy Development and Programmes of target-setting in different contexts. See Part 3 Chapter 12 for guidance on Monitoring, Analysis and Evaluation of Road Safety Interventions.
All three elements of the road safety management system – institutional management functions, interventions and results – need to be benchmarked against identified effective practice as countries develop new projects, programmes and strategies, regardless of their stage of development (OECD, 2008). Institutional Management Functions in Management System Framework and Tools outlines recommended steps and available tools to assess the strengths and weaknesses of country road safety management and to implement necessary capacity building initiatives.
Guidance has been published by the World Bank to assist countries which want to improve their road safety outcomes (GRSF, 2009, 2015). These acknowledge that building effective capacity requires long-term investment and will not be achieved overnight. These address the central issue of how to shift from weaker to stronger institutional management to make this happen. The guidance outlines two practical steps to strengthen country road safety management. The first step, noted below, comprises a road safety management capacity review which helps to identify strengths and weaknesses in current approaches.
The recommended first step for countries is to carry out a road safety management capacity review. Road safety management capacity review has been independently evaluated as a cost effective, good practice tool that has been used widely in LMICs. It has also been used in Sweden and Western Australia where it has contributed to strengthening in some aspects of institutional delivery to good effect (GRSF, 2012).
Capacity review objectives: The aims of the capacity review are to:
Road safety management capacity review involves engagement with senior management in key government agencies and the private sector who are able to influence country results. The review is conducted by experienced, internationally recognised, external road safety specialists with senior management experience at country and international levels.
Capacity review steps: A country capacity review is conducted through nine distinctive steps:
Twelve checklists are used to help assess and benchmark all elements of the management system and their linkages according to effective practice (see GRSF, 2009, 2015).
Long-term investment strategy: On the basis of the review, a long-term investment strategy is developed which lays a pathway from weak to strong capacity via establishment, growth and consolidation phases of the investment strategy. These phases are discussed fully in Targets and Strategic Plans.
The first stepping stone for many LMICs in establishing their road safety activity will be to prepare road safety projects rather than embark initially on the ambitious national road safety plans foreseen in the growth phase. Road safety management capacity reviews indicate that LMICs that specify national plans without the funded capacity to achieve them are unsuccessful (GRSF, 2006–13). The practical aim is to deliver key capacity building elements in funded implementation projects, such as those outlined in Section 3.4 in the establishment phase of the investment strategy.
The project involves building core institutional capacity to measure and target safety outcomes in high-volume, high-risk corridors and areas, with specific attention being paid simultaneously to lead agency and related coordination arrangements and monitoring and evaluation. This provides a basis for the scaling up of investment to accelerate this capacity strengthening, and the achievement of improved results across the road network in a national plan for the growth phase.
The second step of the country guidance is the careful preparation and implementation of Safe System road safety projects to deliver the establishment phase of the investment strategy (GRSF, 2009; 2015). As mentioned previously, carefully prepared and funded demonstration corridor projects provide an excellent means for countries starting out in road safety or countries embarking on more ambitious approaches to build initial capacity.
Current World Bank road safety investment in capacity building efforts is focusing on systematic, measurable and accountable investment programmes. These simultaneously advance the transfer of road safety knowledge, strengthen the capacity of participating governmental partners and stakeholders, and rapidly produce results in targeted high-risk corridors and areas. The aim is to provide benchmarks, dimensions and capacity for the next stage of investment (GRSF, 2013). Recommended project components are briefly outlined in the ‘Getting Started’ material at the end of this chapter, while examples are provided in Roles, Responsibilities, Policy Development and Programmes. Complementary guidance has been issued for a streamlined approach to capacity review and project development and ‘mainstreaming’ road safety in regional trade road corridors (GRSF, 2013; Breen et al., 2013).
While the two-step process outlined above has been identified to inform investment priorities in LMICs, the above tools have also been used by HICs which have moved to a Safe System approach (Breen et al., 2008; Howard et al., 2010). Roles, Responsibilities, Policy Development and Programmes provides examples of capacity building demonstration projects that can help build leadership and coordination arrangements, implement multi-sectoral action, and achieve quick results in targeted high-volume, high-risk corridors and areas.
This section has briefly introduced capacity building tools. The main principles which underpin this guidance can be summarised as: the need to address all elements of the road safety management system in reviewing management capacity to produce results; adoption of a phased approach to road safety investment and a ‘learning by doing’ approach; targeting the highest concentrations of deaths and serious injuries across the road network and adopting a Safe System approach; and building global, regional and country road safety management capacity. Practical examples of how these tools are being used worldwide are presented throughout this manual. Readers are referred to the original guidance for a detailed discussion (GRSF, 2009, 2015).

© ARRB Group
Motor vehicle crashes are a leading cause of death and long-term injury at work and in driving associated with work. For example, surveys in several EU countries indicate that between 40–60% of all work accidents resulting in death are road crashes. Studies conducted across the world indicate that the costs of work-related crashes are substantial, both for society and employers (DaCoTA, 2012b). ). To reduce death and serious injury the International Standards Organization developed ISO 39001: Road Traffic Safety Management Systems: Requirements with guidance for use standard has been produced.
The standard is designed to assist organisations in integrating road safety as a core objective into their management systems, as well as aligning with country road safety goals and strategies. The standard is aimed at both small and large organisations, as well as the public and private sector Specific examples given include organisations concerned with transporting goods and people; those generating traffic, such as schools and supermarkets; and those responsible for provision of the road network.
The ISO 39001 standard links to other ISO management systems standards and sets out specific and wide-ranging top management responsibilities and key management functions. ISO 39001 requires organisations to adopt the Safe System goal and to make decisions on objectives and targets for the interim as well as plans to achieve them. The organisation is required to follow a process that starts with a review of its current road traffic safety performance; makes an assessment of the context for the organisation’s activity; and considers specified, measurable road traffic safety performance factors known to reduce the risk of fatal and serious injury within the organisation's sphere of influence. The organisation has to select the road traffic safety performance factors to work on and then analyse what it can achieve over time. When establishing its targets, the organisation is required to consider the management capacity required to achieve them, as well as monitoring results and reviewing its road safety management system towards continual improvement (ISO, 2012).
Early adopters of ISO 39001 include freight and passenger transport organisations and companies in Sweden and Japan. If implemented within the national policy framework, the tool has high potential to engage employers of organisations of all sizes in effective road safety activity. In the case of LMICs, early adoption of ISO 39001 by large corporations in the first instance could assist governments in meeting their serious road safety challenges.
When the main objective is to avoid accidents on the roads, all levels of society need to make a contribution. At the highest level, the way in which society decides on its transport needs, the choice of transport and mobility, the level of provided transport equipment and facilities, the level of education of road users, etc., are all influenced. All these factors, which are controlled at the national and to some extent global level, are also of great importance for the level of road safety at the local level. However, they cannot be directly influenced by individual municipalities.
At a lower level, road safety is also the result of practical planning, in other words, where activities are located and how the transport system is structured. For example, the road and street system can be divided into different categories according to the activities and potential disturbances. A certain level of traffic safety required by one group of road users often contrasts with the level of safety desire by another. How different modes of transport look and how conflicts between them are prioritised is very important in determining the risks to which different groups of transport users are exposed. Longer journeys expose more people to more risks and generally lead to more accidents. Municipalities have the opportunity to influence this through sound planning. It is also needed to create good operating conditions for public transport which reduces crash exposure through the reduction of vehicle volumes.
Road safety can be examined in more detail by looking at the behaviour of road users and how they use and take or reduce risk behaviours on the transport system. The transport environment places demands on the behaviour of road users, and the capacity of road users places demands on the design of the surrounding environment as it interacts with road users and how road users interact with each other can help to understand the causes of individual accidents. It is the responsibility of the municipal system and to maintain the quality level. In this respect local influence is strong.
The design and planning of the municipal transport system therefore directly affects future road safety, but it is important to understand that municipal planning also affects the level of road safety in the municipality well into the future. This is why road safety must be integrated into all planning of the physical environment.
In the context of extended social planning, road safety is one of many factors influencing other aspects. Other aspects also influence road safety. Balanced weighting between different attributes such as urban character, accessibility, safety, road safety and environmental impact will ensure a sustainable outcome in the long term. Features can work for or against each other and can also compete for available resources. Therefore, municipalities need to make their own priorities and adjust their investments according to their needs and resources.
Road safety affects urban space and urban life appropriate speed and well-designed urban space have synergetic effects. Road Safety can act as a catalyst for creating a more beautiful urban space and a safer more vibrant city. Improved road safety can also have positive effects on noise and air quality. More moderate speeds reduce emissions and noise. Lower speeds also reduce the attractiveness of car traffic, which reduces the flow car traffic to some extent.
Success in local road safety work requires the creation of structures and the acquisition of information involving several municipal functions. Different measures need to be prioritised and the most cost-effective ones selected for implementation Intervention and Prioritisation. There is a need to create continuity in the work and for municipal officials, politicians and, above all, the general public to learn to understand the problems better. To this end, a road safety programme must be drawn up, documenting the objectives and the efforts to be made, and to which a commitment must be made, and to which a commitment must be made. It will be easy to monitor progress (see monitoring and evaluation) and new programmes can be drawn up at the end of the programme period. A systematic approach is the basis not only for success but also for increasing knowledge in society a. A systematic approach requires clear objectives, knowledge of the current situation and a clear understanding of how to achieve them.
Bliss T (2004), Implementing the Recommendations of the World Report on Road Traffic Injury Prevention, Transport Note No. TN-1, World Bank, Washington DC.
Breen J, Howard E, & Bliss T (2008), Independent Review of Road Safety in Sweden, Swedish Roads Administration, Börlange.
Breen J, Humphreys RM & Melibaeva S (2013), Guidelines for Mainstreaming Road Safety on Regional Trade Road Corridors, SSATP, World Bank, Washington DC.
DaCoTA (2012a), Road Safety Management Deliverable 4.8d of the EC FP7 project DaCoTA, Brussels
DaCoTA (2012b), Work-related Road Safety Deliverable 4.8d of the EC FP7 project DaCoTA, Brussels
European Road Safety Observatory (2014), http://ec.europa.eu/transport/road_safety/specialist/knowledge/dacota/safety-issues/index_en.htm
EU Directive 2008/96/EC of the European Parliament and of the Council of 19 November 2008 on road infrastructure safety management
Global Road Safety Facility (GRSF) & World Bank (2006-2013), Unpublished country road safety management capacity reviews, Washington DC.
Global Road Safety Facility (GRSF) (2009), Implementing the Recommendations of the World Report on Road Traffic Injury Prevention. Country guidelines for the Conduct of Road Safety Management Capacity Reviews and the Specification of Lead Agency Reforms, Investment Strategies and Safe System Projects, by Bliss T & Breen J; World Bank Global Road Safety Facility, Washington DC.
Global Road Safety Facility GRSF (2012), MDB Staff Training Program: Module 7, African Development Bank, Tunis, Tunisia
Global Road Safety Facility (GRSF) (2013), Road Safety Management Capacity Reviews and Safe System Projects, by Bliss T & Breen J; World Bank, Washington, DC.
Global Road Safety Facility (GRSF) (2013), Leveraging Global Road Safety Successes, World Bank, Washington, DC.
International Standards Organisation ISO (2012), 39001: Road Traffic Safety (RTS) Management Systems – Requirements with Guidance for Use, Geneva.
International Traffic Safety Data and Analysis Group (IRTAD), Road Safety Annual Report 2014, International Transport Forum, Paris
ITF (2016), Zero Road Deaths and Serious Injuries: Leading a Paradigm Shift to a Safe System, OECD Publishing, Paris. http://dx.doi.org/10.1787/9789282108055-en
Koornstra M, Lynam D, Nilsson G, Noordzij P, Pettersson HE, Wegman F & Wouters P (2002), SUNFlower: A comparative study of the development of road safety in Sweden, the United Kingdom and the Netherlands, SWOV, Dutch Institute for Road Safety Research, Leidschendam. Available on the Internet: http://www.swov.nl/rapport/sunflower/sunflower.pdf
Land Transport Safety Authority (2000), Road Safety Strategy 2010: A Consultation Document. National Road Safety Committee, Land Transport Safety Authority, Wellington.
OECD (2008). Towards Zero: Achieving Ambitious Road Safety Targets through a Safe System Approach. OECD, Paris, see OECD 2008 for summary document.
Peden M, Scurfield R, Sleet D, Mohan D, Hyder A, Jarawan E, Mathers C eds. (2004), World Report on Road Traffic Injury Prevention, World Health Organization and World Bank (Washington), Geneva.
Stigson H, Kullgren A & Krafft M (2011), Use of Car Crashes Resulting in Injuries To Identify System Weaknesses, Paper presented at the 22nd International Technical Conference on the Enhanced Safety of Vehicles (ESV). Washington DC, USA. DOT/NHTSA
Turner, B., Job, S. and Mitra, S. (2021), Guide for Road Safety Interventions: Evidence of What Works and What Does Not Work. Washhington, DC., USA: World Bank
United Nations Road Safety Collaboration (UNRSC) (2011), Global Plan for the Decade of Action for Road Safety 2011 – 2020, World Health Organization, Geneva.
United Nations Road Safety Collaboration (UNRSC) (2006-2013) See http://www.who.int/roadsafety/ for range of guidance produced.
United Nations Road Safety Collaboration (UNRSC) (2006-2013)
World Health Organization (WHO)(2021), Global Plan for the Decade of Action for Road Safety 2021-2030, World Health Organization, Geneva. status report on road safety 2013: supporting a decade of action, World Health Organization, Geneva.
Wegman F (2001), Transport safety performance indicators. Brussels, European Transport Safety Council.
This chapter outlines the Safe System approach from first principles to end delivery of safe outcomes, with cross-referencing to the detailed planning and design activities that give effect to a Safe System approach, which are set out in later sections of this manual.
A Safe System approach within the road transport system is built around the premise that death and injury are unacceptable and are avoidable. This approach seeks to ensure that no road user is subject to kinetic energy exchange in a crash which will result in death or serious long-term disabling injury. OECD (2016) endorses the Safe System approach and notes that Safe System principles represent a fundamental shift from traditional road safety thinking, reframing the way in which traffic safety is viewed and managed.
The Safe System represents a major change to past approaches. It overturns the fatalistic view that road traffic injury is the price to be paid for achieving mobility. It sets a goal of eliminating road crash fatalities and serious injuries in the long-term, with interim targets to be set in the years towards road death and serious injury elimination.
This elimination is feasible. It requires system reconfiguration and recognition that the network must eventually be forgiving of routine human (road user) errors. It is important to recognise the fundamental change that road safety agencies, including road authorities, will face in embracing and implementing this Safe System aspiration and in implementing Safe System treatments across their networks (See Responsibilities and Policy for road authority impacts).
ITF (2016) suggest that the key Safe System principles are that:
A video has been produced by the New Zealand Transport Agency (NZTA) describing the Safe System approach, and the role of different parts of the system. This provides a very useful introduction to this topic (See The Difference Between Life and Death – a 20 minute film).
A commitment is needed from agencies to review their road safety capacity (see Safety Management System); to develop understanding of the principles of Safe System and its elements; to adopt a long term goal for elimination of fatalities and serious injuries.
Countries must develop their knowledge to address gaps within the agencies (and of other stakeholders) as to what a Safe System approach is and what practical change this will require in management and intervention approaches. Over time all Safe System elements (See Safe System Elements), and the safety of all road users are to be addressed. Funding needs are to be identified and advocated to government.
Understanding of major crash types (See Crash Causes) should be determined from crash data or if not available, by discussions with police and emergency services workers. Develop a reliable crash data system as soon as possible (See Safety Data).
Road assessment programmes can play a part in identifying higher risk sections of a network and in identifying affordable treatments, especially where reliable crash injury data is not available. Weaknesses in Safe System elements (roads and traffic management - including roadside management and abutting development access controls, see Section 7.3; vehicles, speeds; and road user behaviours) which contribute to fatalities and serious injuries in these crash types should be determined.
In the short term, for new road projects, adoption of Safe System design policies which apply Safe System principles to treatments to reduce fatal crash risk will be developed. Design guidelines would follow subsequently but these would be a substantial development task which requires an incremental medium-term approach.
Seek to improve user behaviour and compliance (See Safe System Principles) across the whole existing network through improved traffic management guidance, reduced speed limits in high risk areas and improved police enforcement, offence penalties and public education See Targets and Strategic Plans for the recommended demonstration project approach.
In the medium to longer term: Carry out progressive retrofitting of the existing system. Do what is feasible to improve infrastructure safety and further improve behaviour and compliance through licensing system reviews and legislative changes re offences. Continue public education campaigns and seek improved vehicle safety regulation and public education.
The Safe System approach is a comprehensive safety philosophy, developed and internationally agreed-upon to form the foundation for safe design and operation of the road transport system. The deficiencies in traditional approaches to achieving a safe road network were highlighted by Tingvall (2005). He noted that the road transport system internationally has traditionally been characterised as follows:
These comments draw attention to the fact that there has been a lack of acceptance of responsibility in this field by most governments. The safest communities (OECD, 2016) will be those that embrace the shift towards a Safe System and begin work now on the interventions required to close the gap between current performance and the performance associated with a genuinely safe road traffic system.
This requires understanding not only of the current system’s safety weaknesses, but also of what change may be possible in the short-term to achieve Safe System compliant outputs. Sufficient management leadership within government road safety agencies (including road authorities), as outlined in Chapter 3, The Road Safety Management System, is essential to achieve meaningful progress in the delivery of these substantially different outputs.
A Safe System will exist when road users are no longer exposed to death or serious injury on the network.
The Safe System approach focuses on eliminating crashes that result in fatal or serious injury outcomes; that is, those crashes that are a major threat to human health. It draws upon the Swedish Vision Zero and the Dutch Sustainable Safety road safety visions and objectives. Safe System Principles provides information on other key elements of the Swedish and Dutch approaches.
The Swedish Vision Zero asserts that human life and health are paramount (Tingvall, 2005) and no long-term trade-off is allowed, reflected in the ethical imperative that “It can never be acceptable that people are killed or seriously injured when moving within the road transport system”. Tingvall (2005) notes that traditionally, mobility has been regarded as a function of the road transport system for which safety is traded-off. However, Vision Zero turns this concept around and resets mobility as being a function of safety (See References(Scope of Road Safety Problem)). That is: no more mobility should be generated than that which is inherently safe for the system. This ethical dimension reflects the principles accepted for workplace safety, where the effectiveness of the working process cannot be traded-off for health risks. Norway (NPRA, 2006), in adopting the Vision Zero goal, has highlighted the ethical approach underpinning it, i.e. “Every human being is unique and irreplaceable and we cannot accept that between 200 and 300 persons lose their lives annually in traffic”. Sweden is looking beyond Vision Zero as well, and in November, 2017 introduced "Moving Beyond Zero." Moving Beyond Zero is a major rethink of the Vision Zero policy and introduces an active transport advocacy campaign.
The objective of the Netherlands Sustainable Safety approach (Wegman & Aarts, 2006) is to prevent road crashes from happening, and where this is not feasible, to reduce the incidence of (severe) injuries whenever possible.
OECD (2016) points out that while Vision Zero is based on an ethical principle to eliminate death and serious injury from the transport system, Sustainable Safety takes elimination of preventable accidents as the starting point and attaches greater weight to cost-effectiveness in determining interventions.
It is clear that this ethical position, which holds that the prime responsibility of a road authority is to support road users to reach the end of each of their trips safely, is being increasingly adopted by jurisdictions. The following literature supports the need for measures to save lives through achieving a ‘forgiving’ system:
The Safe System’s ethical goal of serious casualty elimination will not be achieved overnight. It requires a long-term timeframe for actions to be developed and implemented in successive intermediate timeframes, to deliver incremental serious casualty reductions (to meet interim targets over the medium-term) and support progress towards the long-term goal. The following case studies from Belize and China show two long-term approaches to reducing fatal and serious crashes.
It also requires commitment to interim step-wise targets, which gives prominence to the long-term goal (OECD, 2016; GRSF, 2009; 2012; Breen, 2012).
PIARC (2012), in its National Road Safety Policies and Plans Report, notes that best practice in target setting is represented by government commitment to a long-term goal of zero fatalities with strong interim targets that establish the path to success. Adoption of a long-term Safe System approach is identified good practice for managing for results and is supported by other key international road safety stakeholder organisations as outlined in Road Safety Management. Following the request of the United Nations General Assembly, on November 22, 2017, member states reached consensus on 12 global road safety performance targets. For more information see Developing Global Road Safety Targets. There is an increasing number of countries that have adopted a “Towards Zero” or fatal and serious injury elimination goal — the aspiration underpinning the Safe System approach. This long-term commitment to elimination of road crash fatalities and serious injuries at the highest level of government will influence and support road safety management and road safety policy in a jurisdiction and will be clearly reflected in the proposals described in a strategy and action plan to achieve ambitious interim targets. The following case study from the United States of America, discusses the Minnesota's Towards Zero Deaths initiative.
The safe system approach often requires road agencies to rethink their approach to how projects and programmes are implemented. It is important to begin with some understanding of the how the system is currently operating through objective performance measurement. The first case study discusses the Road Safety Manual which was developed to help the practitioner on the Safe System journey. Some nations have also started the journey through the "Star Rating" system developed as part of iRAP. This is shown in the second case study.
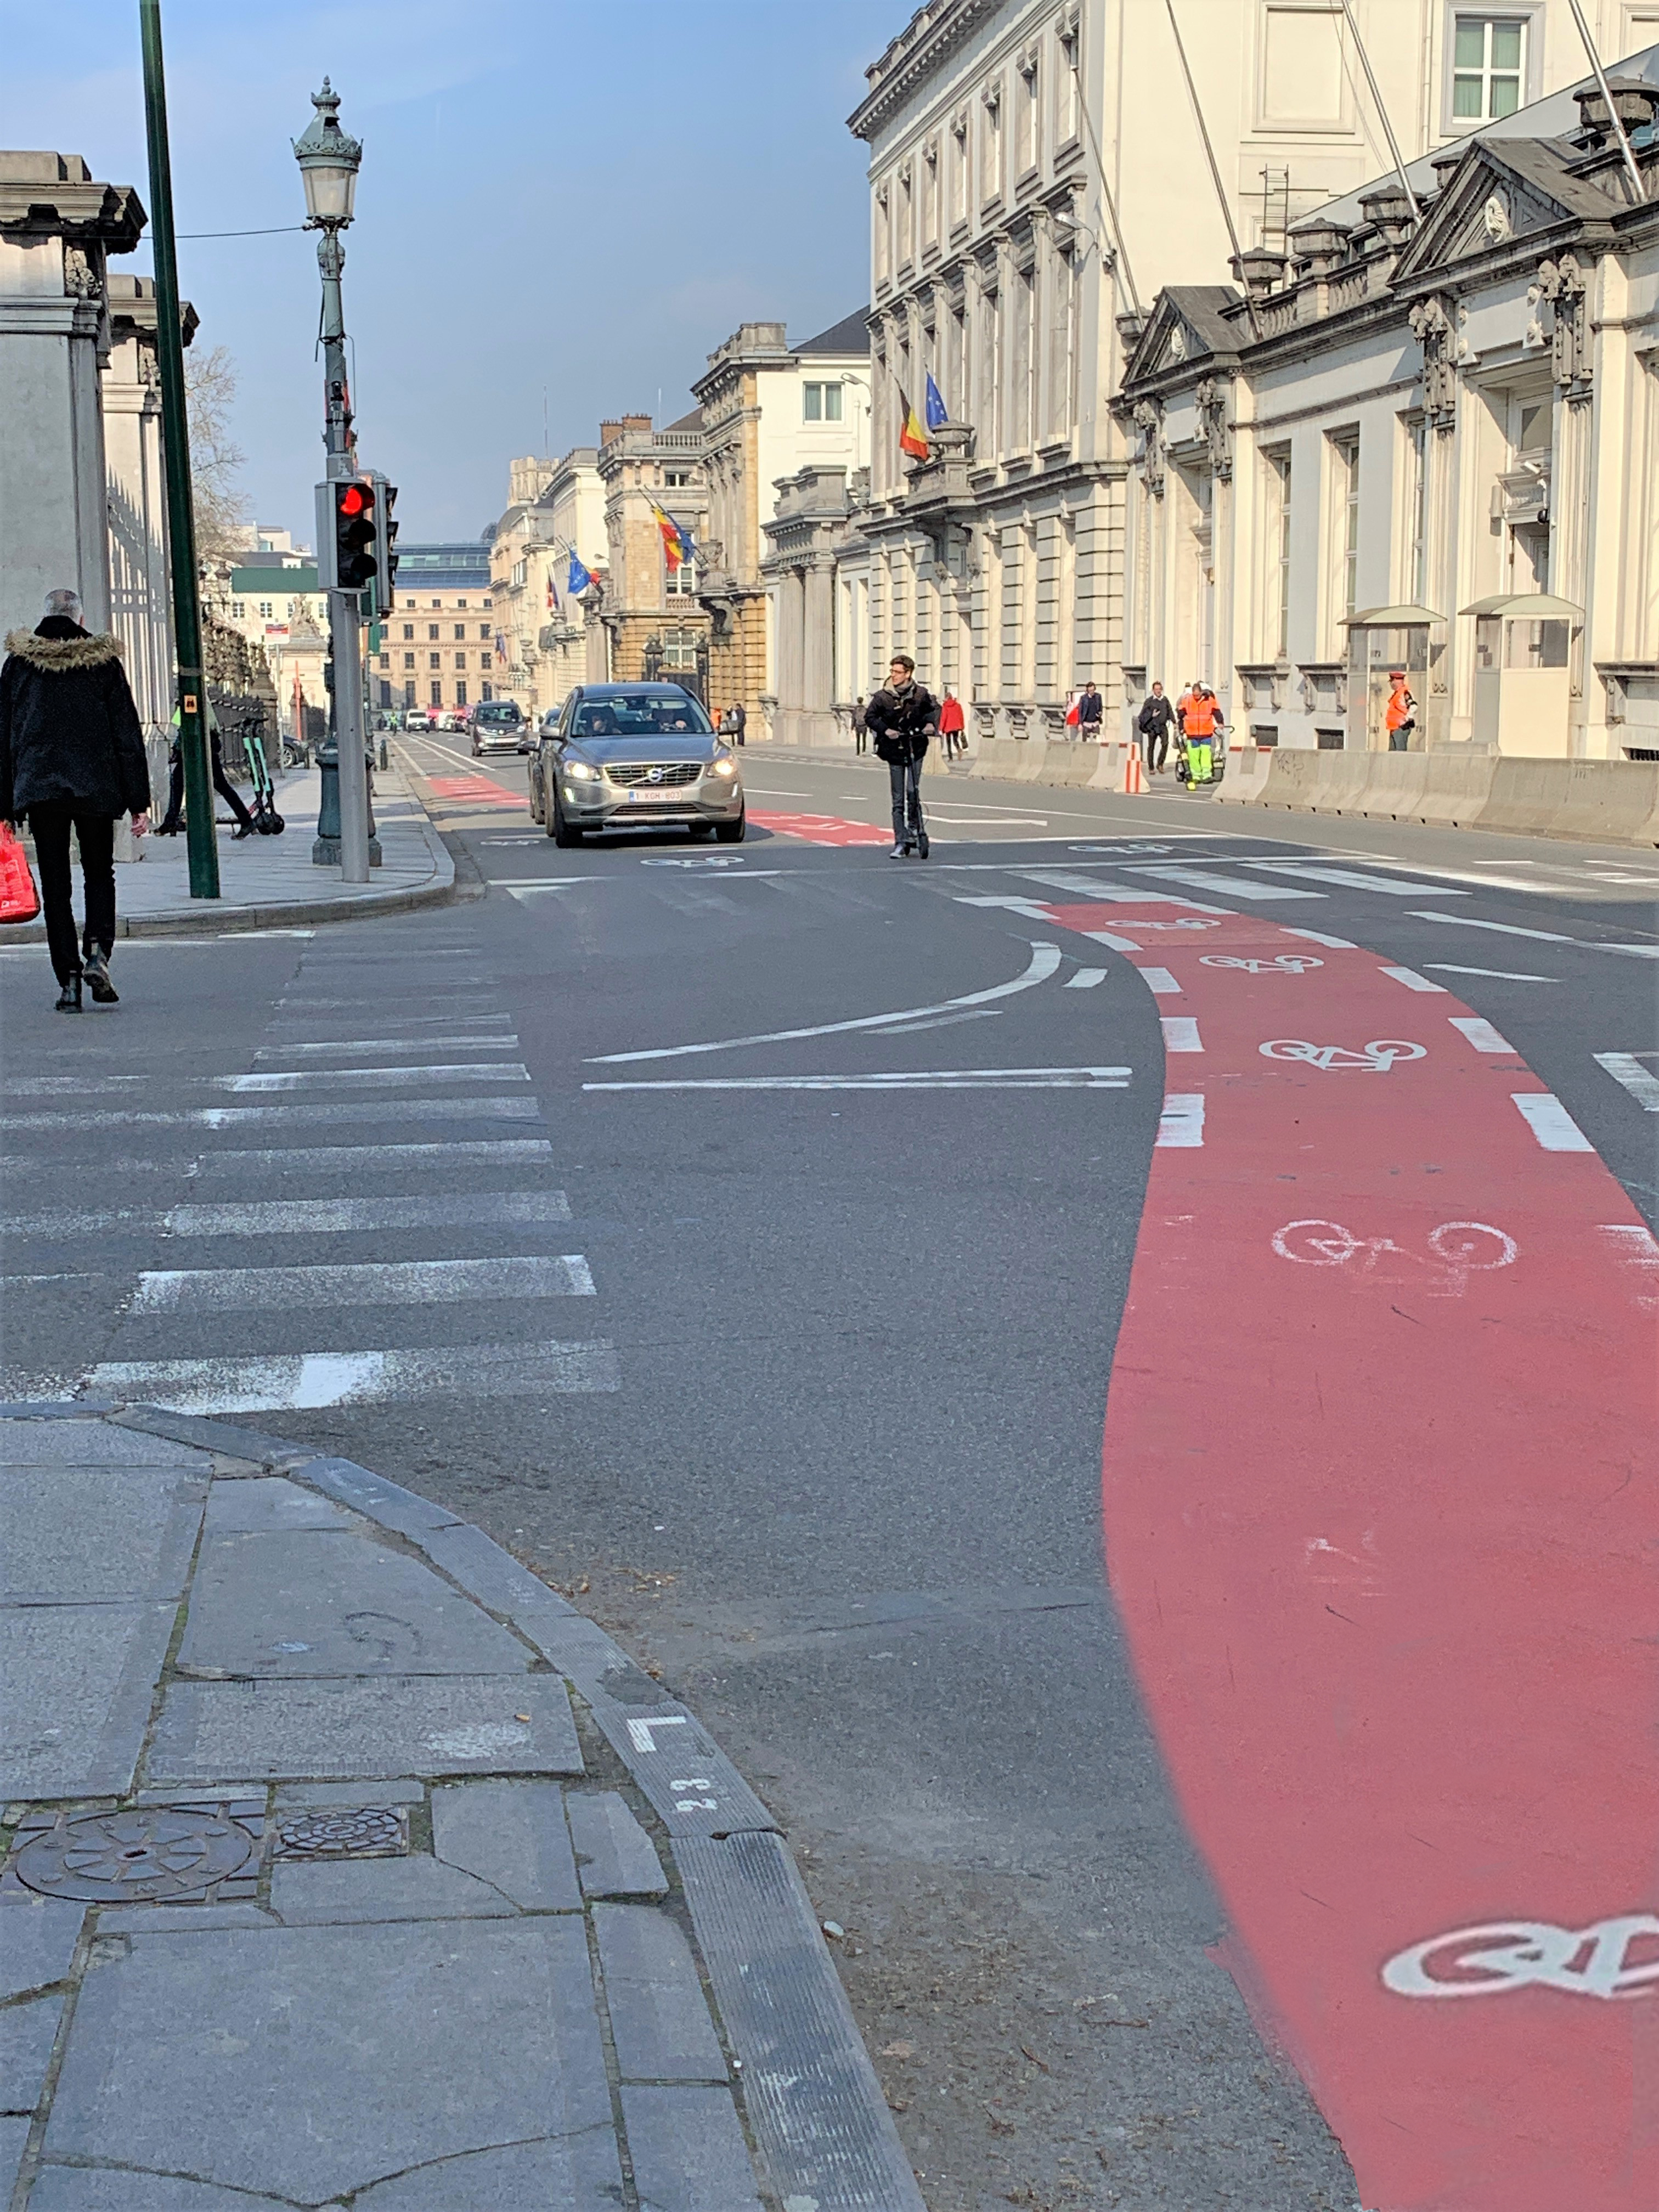
Brussels, Belgium (Source: J. Milton)
The Safe System approach provides a different way to look at crash causation, and at the key crash types that contribute to fatal and serious injury.
The traditional understanding of crash causation supported the perception that the driver or other road user error was the cause of most crashes and was therefore the major issue that needed to be addressed. While road user error is a contributing factor to many crashes, there are a number of key research findings that challenge the traditional allocation of most causation to driver/rider error (human behaviour) and the associated notion that human behaviour can easily be altered (also See the discussion in Designing for Road Users on this issue).
Kimber (2003) suggests past post-crash assessments of crash contribution by researchers resulted in too great a focus on driver behaviour at the time the data was collected. Interventions with potentially greater effect were easily overlooked. Driver behaviour is a wide category and it was easy to populate it by default when the evidence was incomplete or a better explanation was not available. Due to this perceived driver failure predominance, the main priority for many years was to concentrate on measures to change driver behaviour (rather than focusing on reengineering other parts of the road, vehicle or driver system) to eliminate the failures.
This mindset is changing, but the misguided focus on the significance of driver error still remains predominant in too much of the thinking across international communities.
Human error is to be expected. It is unhelpful to regard all human error as being capable of somehow being eliminated and the consequences of it therefore being avoided. When the circumstances of road and vehicle allow, routine driver errors translate into collisions, sometimes with injury or death resulting. A focus on the infrastructure and vehicle safety levels that interact with routine driver error is a much more useful means of identifying actions to reduce serious casualty outcomes.
Elvik and Vaa, (2004) indicate that, even if all road users complied with all road rules, fatalities would only fall by around 60% and injuries by 40%. Specifically, they note that around 37% of fatalities and 63% of serious injuries do not involve non-compliance with road rules. This indicates that routine human error leading to crashes, rather than deliberate or unintentional breaking of road rules, is a feature of human existence and road use.
While achieving compliance with road rules by road users remains critically important, this approach alone will not achieve the desired road safety gains in any country.
As practitioners from LMICs recognise, there is often a lower level of compliance with road rules and a lesser respect for the rule of law in most LMICs than for many HICs. This deliberate reluctance to act in accordance with the law would affect fatality and serious injury rates in these countries and this is one key difference in comparison to serious crash experience in many HICs.
While a substantial potential benefit is available in the medium term through changing this illegal road user behaviour in LMICs, a further focus upon improvements in infrastructure and vehicle safety over the medium to longer term will be essential in providing a forgiving system (a Safe System) for crashes arising from underlying (and not illegal) human error, as is the current and strengthening focus in many HICs. Therefore, research findings from HICs about the role of safer roads and vehicles are very relevant to LMICs.
Stigson (2011) conducted further analysis on the different weaknesses in the traffic system’s traditional components and determined that they play a greater or lesser role in influencing the outcome of crashes. The analysis confirms the potential for road infrastructure to more substantially impact upon fatal crash outcomes for car occupants than other factors in HICs.
While system weaknesses should usefully be analysed for two wheeler, cyclists and pedestrians in HICs and also in LMICs, vehicle safety improvement (as users shift over the next decades from two wheelers to vehicles) and improved behavioural compliance will offer great opportunities for reducing crashes in most LMICs compared to most HICs. However, the potential contribution of safer infrastructure to substantially reduce fatalities should be reinforced with all road authorities.
The movement to a focus on fatal and serious casualty injury reduction through the Safe System approach (as opposed to casualty crash reduction) has had a profound impact on the understanding of key crash types.
The shift in focus from crash numbers to casualties has a subtle but important impact on crash assessment and the strategies to address risk. Different types of crashes will produce different crash outcomes, including greater or lesser numbers of injuries per crash. For example, analysis from New Zealand on crashes and casualties demonstrates this point. Table (NZTA, 2011) shows the proportions of the three most common types of crashes and casualties that result in fatalities and serious injuries for rural roads (excluding motorways).
| Key crash types | % of high severity crashes on New Zealand rural roads | % of high severity casualties on New Zealand rural roads |
|---|---|---|
Run-off-road | 56% | 51% |
Head-on | 19% | 25% |
At intersections | 16% | 16% |
The table shows that 92% of fatal and serious injuries on rural roads in New Zealand are attributed to three key crash types. The table also shows that a higher proportion (1.30 to 1) of severe casualties (fatal and serious injuries) occur through head-on crashes (25%) than is reflected in the proportion of severe head on crashes (19%). This indicates that the head-on crash type is of greater significance for overall fatalities than the severe crash numbers would indicate.
Similarly, analysis of crashes by fatal and serious injury (compared to all injuries) is likely to provide a different picture of the risk across the network.
The relative incidence of various fatal and serious crash types will differ from most HICs to most LMICs due to the differences in traffic environments. The types of vehicles and their relative share of the overall traffic volume are two examples of likely difference. It is essential for the road safety agencies and road authorities to know what the major crash types are in their country and where they are occurring (also see Roles, Responsibilities, Policy Development and Programmes and Assessing Potential Risks and Identifying Issues). Agencies should be in a position to identify the higher fatal and serious injury crash risk lengths of roads on their networks.
The predominant road crash types that result in deaths and serious injuries in high-income countries are typically:
For many low- and middle-income countries, key crash types include:
The case study from India discusses the implementation of a speed regulation system.
CASE STUDY - India: Implementation of speed regulation system on highway A10
An innovation in engineering design practice was piloted in India on the Kamataka State Highway Improvement Project (550km). The project demonstrated how the iRAP Star Rating protocol can be used to rate the safety of a road prior to construction or rehabilitation with information drawn from the road design plans. Final designs for construction are anticipated to provide a reduction in severe injuries of 45% in India. Read more (PDF, 860 kb)
The Safe System approach places requirements on the road safety management system. These requirements include:
The system will ultimately need to protect all road users, including those who act illegally, from death and serious injury. In the interim period the focus should be on protecting those who do not act illegally and those who could be killed or seriously injured by the illegal actions or errors of other road users.
As noted above, as well as road user behaviour, road- and vehicle-related safety factors play a substantial part in fatal injury crashes. Progressive movement towards a Safe System requires all key stakeholders to accept their responsibilities to provide for safe overall operation of the network. This is in addition to the responsibilities that individual road users bear. This concept of ‘shared responsibility’ is at the core of the shift in traditional thinking about road crash contributing factors that a Safe System requires.
The Safe System approach looks to infrastructure design, speed limits and vehicle safety features that individually (and together) minimise violent crash forces. It relies upon adequate education, legislation and enforcement efforts to gain high levels of road user compliance with road rules; effective licensing regimes to control the safety of drivers using the system (particularly novice drivers and riders); and the cancelation of licences when serious offences are committed. A good standard of emergency post-crash care is also needed.
This fundamental shift away from a “blame the road user” focus, to an approach that compels system providers or designers to provide an intrinsically safe traffic environment, is recognised as the key to achieving ambitious road safety outcomes (OECD, 2016).
While individual road users are expected to be alert and to comply with all road rules, the ‘system providers’ — including the government and industry organisations that design, build, maintain and regulate roads and vehicles — have a primary responsibility to provide a safe operating environment for road users (See Box 4.1). This requires recognition of the many other system providers (beyond the road engineers and vehicle suppliers) who impact on use of the network and who also carry a major responsibility for supporting achievement of safer, survivable outcomes.
The studies noted in Crash Causes confirm the fundamental importance of those responsible for delivering safer roads and roadsides, safer travel speeds and safer vehicles, as well as safer behaviours. Road users should not have to operate in a system full of flawed designs that increase the probability of error. Sweden’s Vision Zero “envisages a chain of responsibility that both begins and ends with the system designers (i.e. providers)”. The responsibility chain (Tingvall, 2005) has three steps:
Many challenges are involved in monitoring ongoing performance of the responsibilities of system providers or system designers. They need to accept accountability for their outputs.
While the principle of shared responsibility has been naturally accepted in the road safety strategies of those countries who have adopted the Safe System approach, the necessary substantial (and often subtle) adjustment required to become accepted operating practice will take some time to achieve across agencies (including road authorities).
Road safety responsibilities also extend to the broader community. For example, health professionals have a role in helping their clients to manage their safety on the roads; and parents contribute significantly to the road safety education of their children — not only through their direct supervision of learner drivers, but also as role models through their own driving and road user behaviour. The Danish Road Safety Accident Investigation Board case study provides an example of shared responsibility.
Road Safety decisions should not be made in isolation but should be aligned with broader community values, such as economic; land use planning; human, occupational and environmental health; consumer goals; and mobility and accessibility as outlined in Scope of the Road Safety Problem. There is strong alignment between the Safe System and these goals. The following two case studies show how alignment of policies can be beneficial to safety.
The Safe System approach marks a shift from a sole focus on crash reduction to the elimination of death and serious injury. Well-established safety principles underpin the Safe System approach as set out in Key Developments. Further principles include the following:
As noted earlier, the Safe System approach builds upon the ground-breaking road safety efforts of the Netherlands and Sweden.
Wegman & Aarts (2006) outlines a set of guiding principles (based on the Dutch Sustainable Safety Vision) considered necessary to achieve sustainably safe road traffic. The principles are based on scientific theories and research methods arising from disciplines including psychology, biomechanics and traffic engineering, and are set out in Table 4.2 below.
| Sustainable Safety Principle | Description |
|---|---|
Functionality of roads | Single function of roads as either through roads, distributor roads, or access roads, in a hierarchically structured road network. |
Homogeneity of mass and/or speed and direction | Equality in speed, direction, and mass at medium and high speeds. |
Predictability of road course and road user behaviour by a recognisable road design | Road environment and road user behaviour that support road user expectations through consistency and continuity in road design. |
Forgiveness of the environment and road users | Injury limitation through a forgiving road environment and anticipation of road user behaviour. |
State of awareness by the road user | Ability to assess one’s task capability to handle the driving task. |
Tingvall (2012) commented on the challenges Sweden faces in redefining transport policy principles to reflect Vision Zero (or the Safe System approach):
“You can travel from A to B at 100 km/h and we will make some improvements to this two lane two way rural road to improve your travel safety:
“You can travel at this safe speed from A to B based on the safe system elements which are operating and which will avoid fatal and serious injury in the event of a crash. You can only travel faster if infrastructure safety is improved.” (eg, roundabouts at intersections, median barriers, run off road barriers to protect from roadside objects, etc.)
The elements of the integrated, human-centric Safe System model for safe road use and their interactions can be depicted as follows (Figure 4.1):
Figure 4.1: A model of the Safe System approach - Source: Adapted from OECD/ITF, 2008; ATC, 2009.
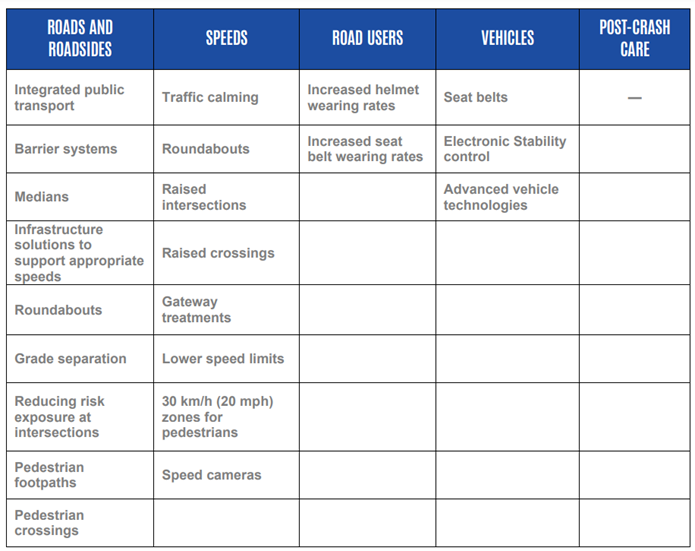
The Safe System design model has four main elements (including alert and compliant road users) plus five supporting activities that can be adjusted and applied in agreement with the four main elements to assist in making crashes more likely to be survivable.
The four main design elements are:
The key supporting Safe System elements include:
The last three elements in the list above support achieving road user compliance with the road rules.
In summary, for alert and compliant road users, a combination of vehicle safety features, safety characteristics of the infrastructure and travel speed are required, together with effective emergency medical post-crash care, in order to avoid a fatal or disabling serious injury outcome in the event of a crash.
Travel speeds are a critical variable within a Safe System with allowable safe speeds on any part of the network being dependent upon vehicle types (and their protective features), the forgiving and protective nature of the infrastructure and roadsides, the restrictions upon roadside access to the roadway and the presence of vulnerable road users. All of these factors will determine a maximum vehicle speed on each section of the network above which an unacceptable probability of death is likely from any collision.
Injury outcomes and the creation of an inherently safe road system are largely dependent on the kinetic energy in the system. At the moment of impact, the force on the body can exceed the body's tolerance.
The amount of kinetic energy (Ek) is calculated according to the following formula:
Ek = 1/2 mv2
where m = mass (kg) and v = velocity (m/s)
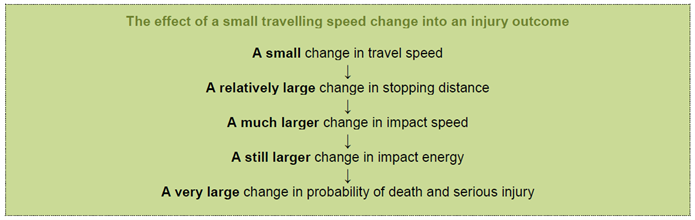
The formula shows that kinetic energy does not increase linearly with speed, but with the square of the speed. This has important implications for how speed affects the road safety. A small increase in travel speed can significantly increase the probability of a serious injury outcome.
Source: Austroads (2018)
Reducing speed is one of the most effective ways to improve safety, saving lives and debilitating injuries. However, the opportunities that lowered travel speeds offer to other societal goals are generally under-appreciated. Reducing speed also generates multiple other benefits fundamental to sustainable mobility: reduced climate change impacts of road transport, increased efficiency (fuel and vehicle maintenance), improved inclusion and walkability (Job et. al. 2020)
Job et. al. (2020) highlighted that when taking into account the full range of economic impacts (GHGs, emissions, fuel, etc.), economically optimal speeds are lower than expected and typically lower than prevailing speed limits compared to limited evaluations of impacts based on travel time savings alone.
Speed management can be achieved through a range of interventions including road infrastructure and vehicle technology, as well as enforcement and promotion.
Crash outcomes, especially fatal crash outcomes, are influenced directly by the travel speed of vehicles at the time of impact.
Elvik et al. (2004) report that “Speed has been found to have a very large effect on road safety, probably larger than any other known risk factor. Speed is a risk factor for absolutely all accidents, ranging from the smallest fender-bender (crash) to fatal accidents. The effect of speed is greater for serious injury accidents and fatal accidents than for property damage-only accidents. If government wants to develop a road transport system in which nobody is killed or permanently injured, speed is the most important factor to regulate”.
Table 4.3 from Elvik et al. (2004) sets out the effects of variations in mean speeds on crashes of various severities. This relative change relationship applies on all lengths of road, over comparable periods of time and refers to the effects of changes in mean speed of travel of all vehicles.
| Relative change (%) in the number of accidents or victims | ||||||
|---|---|---|---|---|---|---|
| Change in speed (%) | -15% | -10% | -5% | +5% | +10% | +15% |
| Accident or injury severity | ||||||
Fatalities | -52 | -38 | -21 | +25 | +54 | +88 |
Serious injuries | -39 | -27 | -14 | +16 | +33 | +52 |
Slight injuries | -22 | -15 | -7 | +8 | +15 | +23 |
All injured road users | -35 | -25 | -13 | +14 | +29 | +46 |
Fatal accidents | -44 | -32 | -17 | +19 | +41 | +65 |
Serious injury accidents | -32 | -22 | -12 | +12 | +25 | +40 |
Slight injury accidents | -18 | -12 | -6 | +6 | +12 | +18 |
All injury accidents | -28 | -19 | -10 | +10 | +21 | +32 |
Property damage only accidents | -15 | -10 | -5 | +5 | +10 | +15 |
Fatal crash outcomes are the crash type most affected by speed variation. As the above table shows, even small changes in speed (+5%) are associated with very large changes in the number of road crash fatalities (+25%).
As indicated in the safety principles above, an important way to reduce fatal or serious injury crash outcomes is through better management of crash energy, so that no individual road user is exposed to crash forces that are likely to result in death or serious injury.
Conditions that support limiting crash energy to levels below which fatal or serious injury crash outcomes are relatively unlikely, are now becoming better understood, but are still not well recognised or applied system-wide in most countries.
A key strategy is therefore to move (over time) to set posted speed limits in response to the level of protection offered by the existing (or improved) road infrastructure and the safety levels of the vehicles and vehicle mix in operation on sections of the network.
Mobility needs to be constrained by Safe System compliance. Future safe infrastructure investment will often be necessary before considering raising the speed limits on sections of the network in order to avoid increased fatalities or serious injuries.
McInerney & Turner state that the discipline of managing energy exchange and related forces currently exists in the fields of structural engineering for buildings and mechanical engineering for machines, but is rarely sighted in the design of roads. For infrastructure to provide the key building blocks for a Safe System, road engineering design practice worldwide must include provision for the management of kinetic energy. For example, there are simulation programs that examine an errant vehicle departure into a roadside environment, which calculate the change in kinetic energy as the errant vehicle encounters roadside hazards. The rate of kinetic energy dissipation can then be translated into differing collision severity potential.
While the Safe System approach has been adopted as the foundation of many countries’ road safety strategies, concept adoption and effective implementation are two different things. Implementation remains a considerable challenge.
The supporting enabler for planning, development and implementation of Safe System interventions is the road safety management system operating in any country (See Safety Management System for guidance).
The potential for road infrastructure safety treatments to provide certain and immediate reduction in crash likelihood and severity is well recognised. With adequate resources, infrastructure has the ability to eliminate nearly all fatal and serious crash outcomes. Many national and provincial road safety strategies have highlighted the role of infrastructure in making progress towards a Safe System.
Some examples of high-performing infrastructure treatments from these and other studies include typical findings (McInerney & Turner, in press; also see Intervention Option and Selection) that:
All road users need to be considered when designing or upgrading road infrastructure. This includes:
Netherlands Sustainable Safety in Safe System - Scientific Safety Principles and their Application outlined the important principle of safe travel speed which underpins a Safe System approach. Critical speed threshold levels in traffic crashes differ depending upon the type of crash being considered.
Table 4.4 presents the crash severity risk associated with travel speeds which are above a specific threshold level for key crash types. The crash types examined are vehicles with a pedestrian or other vulnerable road user, single vehicle side impact into a pole or tree, side impact between vehicles at intersections, head on crashes between vehicles and single vehicle run off road crashes.
| Impact speeds above which chances of survival or avoiding serious injury decrease rapidly | ||
|---|---|---|
| Crash Type | Impact Speed | Example |
Car/Pedestrian or Cyclist | 30 km/h | Where there is a mix of vulnerable road users and motor vehicle traffic |
Car/motorcyclist | ||
Car/Car (Side impact) | 50 km/h | Where there is a likelihood of side impact crashes (e.g. intersections or access points). |
Car/Car (Head-on) | 70 km/h | Where there is no separation between opposing traffic streams |
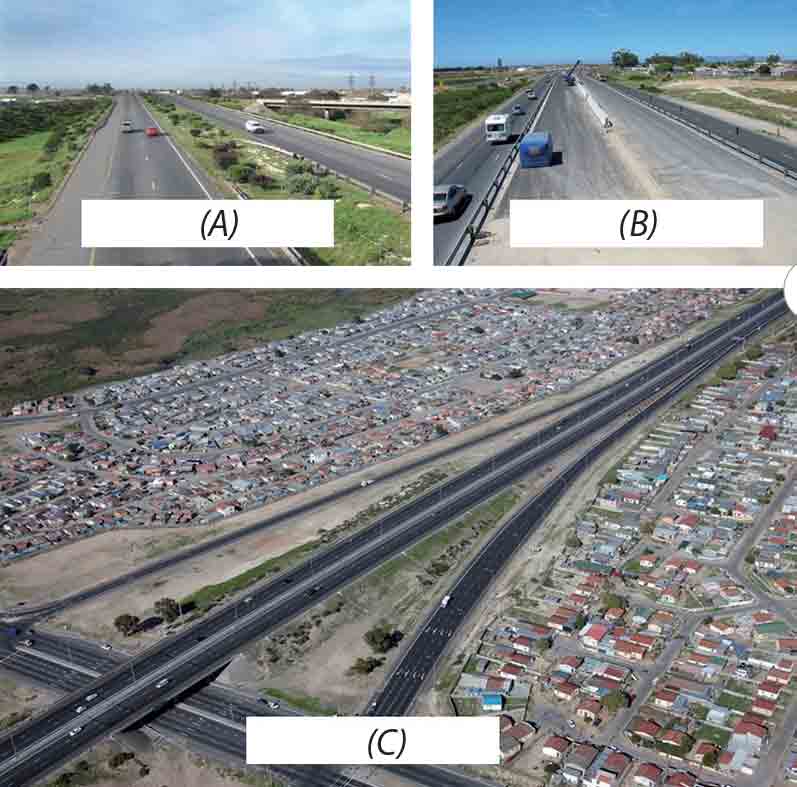
In certain parts of the transport network, such as high standard freeways, the risk of crash outcomes involving high levels of energy transfer (and therefore being fatal) is low in relation to the total distance traveled by vehicles on freeway standard links.
These freeways would typically have no at-grade intersections, would have median barriers installed to prevent head-on crashes, and side barriers installed to protect vehicle occupants from roadside objects, and would also segregate vulnerable road user activity such as pedestrians, cyclists and motorcyclists from higher speed traffic.
In these circumstances, and subject to limitations on vehicle flow volumes per lane, higher operating speeds (such as 100 or 110 km/h) can generally be safely supported for vehicles with a high standard of safety features.
On the other hand, for two-lane, two-way roads in rural environments with unprotected roadside hazards, frequent intersections, unsealed shoulders and variable standards of horizontal and vertical geometry, the risks of serious casualty crash outcomes are much higher.
Table 4.4 illustrates that for these situations, even for a vehicle with the best currently available safety features, the road cannot support a travel speed much above 50 to 70 km/h if fatalities are to be avoided. If roadside hazards are protected (with barriers) and intersections are treated to reduce speeds to 50 km/h the travel speeds on the road can be 70 km/h. The addition of median barriers would enable higher operating speeds to be considered.
Where motorcycles are a large proportion of the traffic, lower speed limits, perhaps 40 km/h, may be necessary.
Lower speed in urban areas is also critical to improving road safety. Speed limits must be adapted to the prevailing traffic situation and to groups of different road users often using the same space. Complementary infrastructure measures such as speed humps and small roundabouts at key locations can help to ensure that speeds are controlled effectively to ensure that vulnerable road users are not exposed to impact speeds above 30km/h.
On higher-order urban arterial or distributor roads the function and use can be prioritised around achieving high traffic flows on road sections, whilst managing exchange at intersections or dedicated mid-block facilities. On these roads, vehicles can drive somewhat faster and tend to travel longer distances. Speed management on these roads should be supported by camera based (fixed or flexible) speed limit enforcement on corridors and at traffic lights. Pedestrians and cyclists can cross at intersections or dedicated mid-block facilities with appropriate localised speed management in place. Ultimately, the aim is to reduce exposure to high-speed motor vehicles, particularly at conflict points.
On the other hand, lower-order roads such as access roads must be managed to facilitate exchange between different road users at lower speed. Speeds in these areas and on these roads are low, not through police enforcement, but by traffic calming and speed management measures. In some areas it may be appropriate to limit vehicle access.
Below is a case study that illustrates the effectiveness of lowered speed limits in urban road environments.
The following four case studies from New Zealand, Mexico, Paraguay and Slovenia show how each country is improving road safety. New Zealand uses a safe systems approach with Mexico, Paraguay and Slovenia using the iRAP to assess the risk on the road network to allow for safety plan and programme development.
Speed management is at the centre of developing a safe road system. Where infrastructure safety cannot be improved in the foreseeable future and a road has a high crash risk, then reviews of speed limits, supported by appropriate and competent enforcement to support compliance, are a critically important option. Support through targeted infrastructure measures to achieve lower speeds should be considered.
For example, lowering 100 km/h speed limits to 90 km/h may reduce mean speeds by 4 to 5 km/h if there is a reasonable level of enforcement. The scientific and evidence-based research shows that this will deliver a reduction of up to some 20% in the fatalities occurring on these lengths of roads (e.g. (Sliogeris, 1992). This of course assumes some enforcement support.
Since 1996, vehicle safety (or at least, car occupant safety) has been subjected to market forces rather than solely relying upon regulation throughout Europe through EuroNCAP (European New Car Assessment Programme). There is wide acknowledgment that this enhanced approach to advancing rapid development in vehicle safety has been successful. The automotive industry has reacted very quickly to the expectations of the market with regard to car occupant protection. Other New Car Assessment Programmes (NCAP) have been introduced in many regions and countries (Australasia, Japan and many more). The introduction of Electronic Stability Control/Programme (ESC or ESP) in vehicles has been very successful, with unexpected high effectiveness and a market penetration that is quicker than any other previous example (Tingvall, 2005). ESC is now a mainstream part of NCAP ratings.
The opportunities from new safety technologies in vehicles, which are now available or likely to become available, together with the level of inherent crashworthiness of many new vehicles in HICs are remarkable. These benefits should be sought by LMICs as an early priority. LatinCAP in Latin America and ASEAN NCAP are two examples of recent extension of NCAP to LMICs, which will arm consumers with safety information and drive market change. Furthermore, Global NCAP has recently been established and is likely to be highly influential.
Appropriate promotion of the benefits of safety features and overall vehicle safety levels needs to be carried out by road safety agencies. Road authorities should develop their awareness of these new vehicle safety features, particularly ways in which specific infrastructure treatments could leverage improvement in crash outcomes. Road safety agency actions (VicRoads, 2013) could include:
Progress with emerging technologies such as collision avoidance, intelligent speed adaptation, and inbuilt alcohol and fatigue detectors should be monitored by road safety agencies. Pilot studies have been conducted in many vehicle fleets internationally for research purposes in order to establish costs and benefits.
Other initiatives that countries need to pursue include:
Younger drivers should be made aware of the safest used vehicles available in the market in relevant price brackets to encourage their purchase and improve the chances of survival of young drivers in their higher risk early years of driving.
Developments in heavy vehicle safety include ESC responsive braking systems, and fatigue and speed monitoring equipment. New Truck Assessment Programmes may emerge in coming years for heavy vehicle prime movers. Again, road safety agencies need to be aware of these developments.
Many opportunities for improvement exist in the vehicle safety features available to LMIC markets. There are reports of vehicles imported from other countries without safety features fitted, which are standard inclusions in the automobile supplier’s home market (this is reportedly in an endeavour to limit costs). Some countries impose higher rates of tax on safety equipment in vehicles as a misplaced luxury item revenue raising measure, which discourages their fitment. Some key issues are:

© ARRB Group
Maximising road user behaviour that is compliant with road rules remains an important issue. This requires the presence and active implementation of effective legislative arrangements; data systems for vehicles, driver licensing and offences (and their linkage); enforcement; justice system support; and offence processing, as well as follow-up capacities.
Human error, rather than deliberate illegal behaviour, is an important contributor to fatal and serious crashes. Measures to reduce the prospect of human error need to be taken to guide use of the network. Clear consistent guidance and reasonable information processing demands upon the road users along a route is necessary to reduce uncertainty and indecision. These issues are discussed in detail in Design for Road user Characteristics and Compliance, but key issues include:
Developing a respected and effective police enforcement capability requires high-level management competence, good standards of governance, quality research to guide efforts, and a strong results focus.
Progress in LMICs will depend heavily on substantial expert support to accelerate a ‘learning by doing’ approach. A key thread running throughout this manual is practical guidance concerning the implementation of the Safe System approach. A suggested path for road safety agencies in LMICs for moving from weak to stronger institutional capacity, by implementing effective practice through demonstration programmes (or projects), is outlined in Road Safety Targets, Investment Strategies, Plans and Projects. The programmes should include area-based projects involving all relevant agencies and some national level policy reviews. This approach will support the production of steady improvement in road safety results from all agencies.
Development of a more complete understanding and uptake of a Safe System approach, after adoption as official policy by a country, will take time. It will rely upon a continuous improvement process that examines and implements options, often in innovative ways, to improve performance.
While the key principles of a Safe System are well established (OECD, 2008 and 2016) and underpin the UN Global Plan for the Second Decade of Action for Road Safety (WHO, 2021), the challenge now is to translate these aspirations into practical policy implementation. This is especially important in low-and middle-income countries, where the burden of road injury is highest.
A joint International Transport Forum - World Bank Working Group on "Implementing the Safe System" has developed a theoretical framework to guide those seeking to implement the Safe System approach (ITF, 2022). The framework describes how to improve safety across each of the Safe System pillars through the various key components of a Safe System
The framework provides a mechanism to help identify the current level of Safe System progress, which can be applied to a project, region, country, or organisation, as well as to interventions and activities.. It can be tailored to the relevant stage of Safe System development (emerging, advancing, mature). The framework makes it possible to evaluate the extent to which an existing or planned road-safety project can be considered to align with the Safe System approach and where there is room for improvement.
The Safe System framework serves several possible purposes:
The Safe System framework is structured around three dimensions:
The five key components build on the four fundamental principles of a Safe System by adding institutional governance as a critical enabler of a Safe System. Institutional government is required to organise government intervention covering research, funding, legislation, regulation and licencing and requires mechanisms for coordinating and funding actions as well as maintaining a focus on delivering improved road safety outcomes.
The Safe System framework is based on a matrix that can be used to describe any example of a Safe System intervention based on two dimensions: key components and pillars (see Table 4.5). Within such a matrix it is possible to define the current level of alignment to Safe System for an individual cell or any combination of cells as well as to evaluate the expected level of progress that would occur through improvements leading to better Safe System alignment. In each of the cells, improvements in safety can be made, Safe System principles can be implemented and assessed, and opportunities for improvement can be identified.
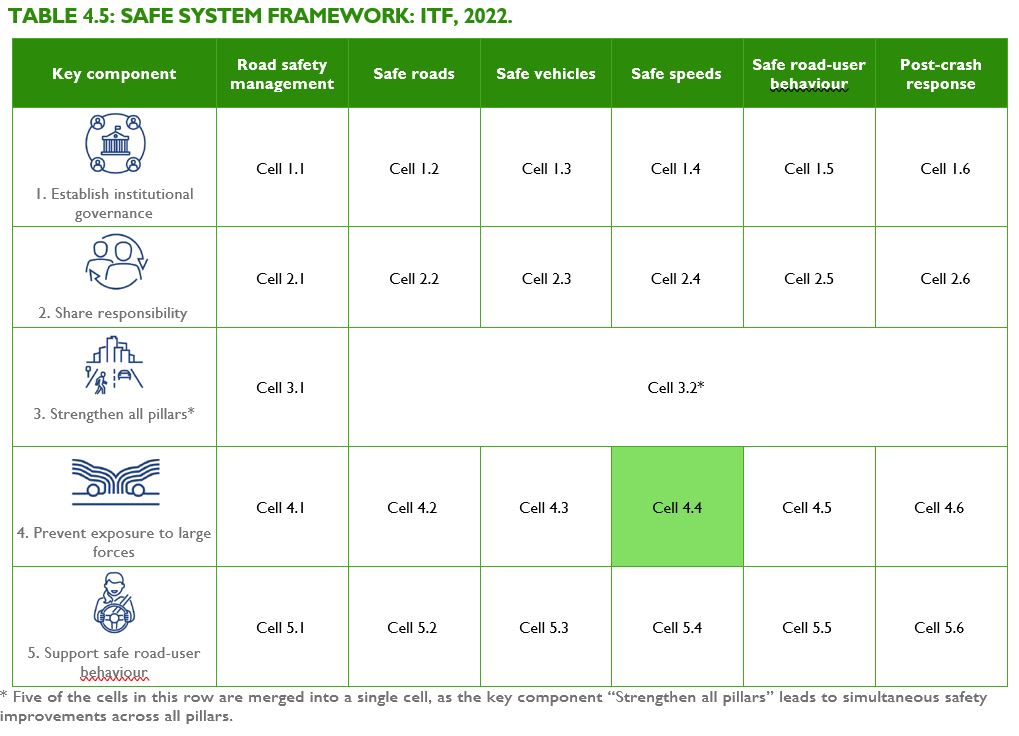
To assess progress towards a Safe System and to identify implementation gaps the framework also includes five possible stages of Safe System development (see Table 4.6) applicable to any country, region or city. At one end of the scale, an emerging system combines straightforward interventions and an initial process of co-operation and integration. At the other, a mature system combines sophisticated interventions and progress towards an ideal situation. For some countries or cities working towards Safe System implementation progress may be in the starting stage in some cells, and in the emerging or advancing stage in other cells.
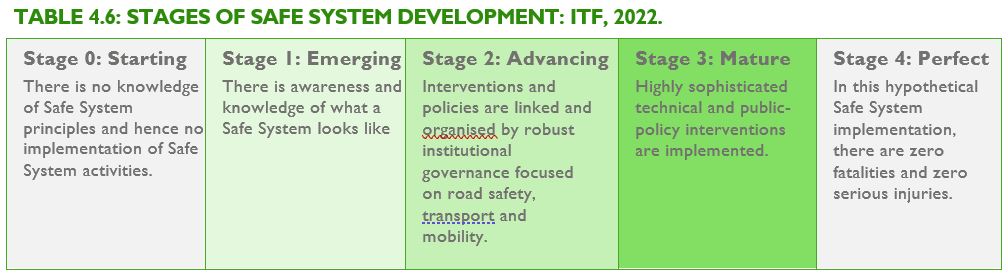
At a strategic level the framework examines the combination of key components and pillars in terms of a conceptual alignment with the Safe System. For example, speed limits that aim to prevent exposure to large forces (refer Cell 4.4 or Table 4.5) are set based on human vulnerability and supported by road design, enforcement , driver education and vehicle technologies. At an operational level the framework outlines descriptions of what road-safety situations to expect in each of the three different stages of development of Safe System implementation. An example three-dimensional framework for Safer Speeds (refer Cell 4.4 of Table 4.5) is presented in Box 4.4.
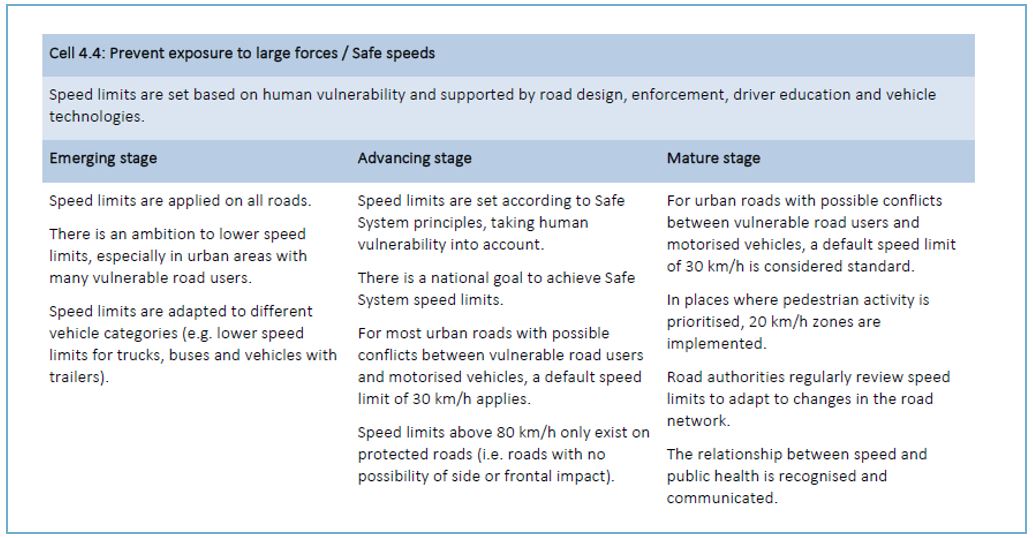
The Working Group also present lessons from 17 case studies of road-safety interventions across the Safe System with reference to the Safe System framework in the Safe System Approach in Action research report. The case studies demonstrate that there is no simple recipe for successful implementation of the safe System approach and requires tailor-made adjustments depending on context including consideration of the specific socio-economic circumstance of each country, city or region.
Understand what a Safe System would look like.
The following four case studies from New Zealand, Mexico, Paraguay and Slovenia show how each country is improving road safety. New Zealand uses a safe systems approach with Mexico, Paraguay and Slovenia using the iRAP to assess the risk on the road network to allow for safety plan and programme development.
Australian Transport Council (2009), National Road Safety Action Plan, Canberra, Australia.
Australian Transport Council (2011), National Road Safety Strategy 2011-2020, Canberra, Australia.
Austroads, (2012), Effectiveness of Road Safety Engineering Treatments, AP-R422-12, Austroads, Sydney, Australia.
Austroads, (2018), Towards Safe System Infrastructure: A compendium of Current Knowledge, AP-R560-18, Austroads. Sydney, Australia.
BITRE, (2012), Evaluation of the National Black Spot Program, Bureau of Infrastructure, Transport and Regional Economics, Canberra, Australia.
Bliss, T & Breen, J (2009). Implementing the Recommendations of the World Report on Road Traffic Injury Prevention. Country guidelines for the Conduct of Road Safety Management Capacity Reviews and the Specification of Lead Agency Reforms, Investment Strategies and Safe System Projects, Global Road Safety Facility World Bank, Washington DC
Bliss, T & Breen, J (2011).Improving Road Safety Performance: Lessons From International Experience. A resource paper prepared for the World Bank , Washington (unpublished).
Bliss, T & Breen, J (2013), Road Safety Management Capacity Reviews and Safe System Projects, Global Road Safety Facility, World Bank, Washington, DC.
Breen, J (2012), Managing for Ambitious Road Safety Results, 23rd Westminster Lecture on Road Safety, 2nd UN Lecture in the Decade of Action, Parliamentary Advisory Council for Transport safety (PACTS), November 2012, London.
Elvik, R, Vaa,T (2004), The Handbook of Road Safety Measures, TOI, Norway
Elvik, R, Christensen P, Amundsen A, (2004) Speed and Road Accidents, an evaluation of the Power Model, TOI, Norway
FHWA, (2013), CMF Clearinghouse website, http://www.cmfclearinghouse.org/, accessed 30th July - 2013.
Global Road Safety Partnership, Geneva, (2008) Speed management: a road safety manual for decision-makers and practitioners, Module 1.
ITF (2022), The Safe System Approach in Action, Research Report, OECD Publishing, Paris, France.
Job, RFS. & Mbugua, LW. (2020). Road Crash Trauma, Climate Change, Pollution and the Total Costs of Speed: Six graphs that tell the story. GRSF Note 2020 . I. Washington DC: Global Road Safety Facility, World Bank.
Kimber, R (2003), Traffic and Accidents: Are the Risks Too High? TRL, Lecture June 2003, Imperial College London.
Larsson, M., Candappa, N.L., and Corben, B.F., (2003), Flexible Barrier Systems Along High-Speed Roads – a Lifesaving Opportunity , Monash University Accident Research Centre, Melbourne, Australia.
McInerney R, Turner B, Infrastructure: A key building block for a Safe System, The International Handbook of Road Safety, Monash University and FIA Foundation.
Ministry of Transport, (2010), Safer Journeys, New Zealand’s road safety strategy 2010–2020, NZ Ministry of Transport, New Zealand.
Norwegian Public Roads Administration, (2006) Vision, Strategy and Targets for Road Traffic Safety in Norway, 2006 – 2015,National Police Directorate, Directorate of Health and Social Welfare, Norwegian Council for Road Safety.
NZ Transport Agency (NZTA), (2011), High Risk Rural Roads Guide, New Zealand Transport Agency, Wellington, New Zealand.
OECD (2008), Towards Zero: Achieving Ambitious Road Safety Targets Through a Safe System Approach, OECD, Paris
OECD (2016), Zero Road Deaths and Serious Injuries: Leading a Paradigm Shift to a Safe System, OECD, Paris.
PIARC (2012), Comparison of National Road Safety Policies and Plans, PIARC Technical Committee C.2 Safer Road Operations, Report 2012R31EN, The World Road Association, Paris.
Sliogeris J (1992), 110 kilometre per hour speed limit: evaluation of road safety effects, Report No. GR 92-8, VicRoads, Melbourne.
Stigson H, Kullgren A & Krafft M, (2011) Use of Car Crashes Resulting in Injuries To Identify System Weaknesses , Paper presented at the 22nd International Technical Conference on the Enhanced Safety of Vehicles (ESV). Washington DC, USA. DOT/NHTSA http://www-nrd.nhtsa.dot.gov/pdf/esv/esv22/22ESV-000338.pdf
Tingvall, C. (2005) The 7th European Transport Safety Lecture, Europe and its road safety vision – how far to zero? Swedish Road Administration.
Tingvall, C and Haworth, N (1999) Vision Zero - An ethical approach to safety and mobility, 6th ITE International Conference Road Safety & Traffic Enforcement: Beyond 2000, Melbourne.
Tylsoand Declaration (2007), https://online4.ineko.se/trafikverket/Product/Detail/44598
Western Australia Road Safety Council, (2009) Towards Zero – Road safety Strategy, To Reduce Road Trauma in Western Australia 2008-2020.
Wegman, F & Aarts, L (2006) Advancing Sustainable Safety: National Road Safety Outlook for 2005-2020, SWOV Institute for Road Safety Research, Leidschendam, The Netherlands.
WHO (2004) World Report on road traffic injury prevention, World Health Organization, Geneva, Switzerland.
WHO (2013) Global Status Report on Road Safety, World Health Organization, Geneva, Switzerland.
Wramborg, P. (2005) A new approach to a safe and sustainable road structure and street design for urban areas. Proceedings of the Road Safety on Four Continents Conference, Warsaw, Poland.
Wundersitz LN, Baldock MRJ (2011), The relative contribution of system failures and extreme behaviour in South Australian crashes, CASR, Adelaide, Australia.
Comprehensive safety data is required for effective road safety management. Safety data is essential for an evidence-based approach, particularly in producing results-focused strategies, action programmes and projects; identifying key crash types and locations; diagnosing the causes of serious and fatal injury in road traffic crashes; selecting treatments; and monitoring and evaluating progress. The establishment and support of data systems is specifically identified as part of the Global Plan for the Decade of Action, with Pillar 1 (Road Safety Management) highlighting the importance of this activity (UNRSC, 2011).
Crash data is a key type of safety data, which can provide a valuable source of information to assist in road safety management. However, this is only one type of data required for the effective management of road safety. Crash data needs to be supplemented by other information, including road inventory and survey data of key behaviours, enforcement data, road network and vehicle fleet safety, and emergency and medical system quality. This data is important in providing intermediate measures of safety. In LMICs where crash injury databases are not fully established or operational, such survey data is particularly important for the measurement and targeting of safety problems. Road safety management capacity reviews in LMICs indicate weak capacity for identification and measurement of road safety problems. As such, there is a need to build capacity to improve road safety data collection, storage, analysis and sharing.
This chapter provides information on the types of data required to effectively manage safety; the establishment of data systems; and the collection and use of this data. It also provides guidance on combining the different types of safety data to manage road safety more effectively.
Uses of this data can be found throughout this manual, including on:
Much of this chapter discusses the effective management of safety data at network level (e.g. for the whole country). However, it is recognised that establishment of a national data source (although essential) may be some way off for some countries. At the very least, the information in this chapter should be used to commence the collection of data on high risk routes, including through corridor and area demonstration projects (see Road Safety Targets, Investment Strategies Plans and Projects).
As indicated elsewhere in this manual, the focus for effective road safety management is on the elimination of death and serious injury (both of which are defined in Identifying Data Requirements), and this is also where greatest efforts should be made in the collection of safety data. Information on fatal and serious injuries, and the crash types (such as those identified in The Safe System Approach) and factors that lead to such injuries, should form the highest priority in data collection. However, there are also important uses for data on minor injuries and even non-injury crashes, and such information should also be collected where possible.
Countries must assess what safety-related information they already collect, who the key stakeholders (collectors and users) are; how this data is used; and what further information is required. Identifying Data Requirements and Establishing and Maintaining Crash Data Systems discuss these issues.
Countries must commence collection of ‘final outcome’ injury data (especially fatal and serious injury data). Initially this may come from high risk routes or corridors (usually high volume national roads). This is discussed in Establishing and Maintaining Crash Data Systems.
Countries must also start collecting ‘intermediate outcome’ data or information on performance indicators (see Identifying Data Requirements). Information on road and roadside elements is a high priority, and can be used to identify problems and solutions; even in the absence of detailed crash data (see Non Crash Data and Recording Systems). Other intermediate data includes compliance data (such as speed, drink-driving and helmet wearing rates; Non Crash Data and Recording Systems). This data can be used to identify issues and solutions, as well as in the broader management of road safety outcomes.
There are a wide variety of uses for safety data, with many different users. As identified later in Analysis of Data and Using Data to Improve Safety, safety data can be used by policy-makers, traffic engineers, police, the health sector, the research community, insurance companies, prosecutors, vehicle manufacturers and others. Although summary data (particularly on crash fatalities) is available in most countries, more detailed information is required to fulfill the requirements of these users. Without this collection of data, it is not possible to take an evidence based approach to the management of road safety.
WHO (2010) provides discussion on the use of data for a public health approach to road safety. This document provides a comprehensive account of crash data systems, including their place in effective road safety management, and their establishment and use. It is essential reading on this topic, particularly for those working within LMICs who wish to establish or improve upon a crash data system. This document suggests a cyclic approach of:
This process is then repeated.
WHO (2010) also provides guidance on the linkage between safety data and effective safety management (Figure 5.1), giving a framework for the collection and use of this data. The WHO document makes it clear that crash data alone is not sufficient to manage safety, but rather it must be used in combination with other sources of information. This additional information is required to better interpret risks, thereby assisting in the monitoring of performance and achievement of results.
; GRSF, (2009).")
Figure 5.1 Data requirements for road safety management - Source: Adapted from WHO, (2010); GRSF, (2009).
As identified in Figure 5.1 and Box 5.1 (and further discussed in WHO, 2010; GRSF, 2009, 2013), the desired results or outcomes of road safety management are expressed as goals and targets, and occur at a number of different but related levels. These include institutional outputs from the policies, programmes and projects that have been implemented, which influence a range of intermediate outcomes. These intermediate outcomes subsequently influence final outcomes. Ultimately, these should reduce fatal and serious injury, in alignment with Safe System outcomes.
Final outcomes: Outcome indicators may include the number of fatalities and serious injuries, crashes relating to certain road users (e.g. pedestrians, motorcyclists) or types (e.g. intersection, head-on), crash rates (e.g. crashes per population, vehicle registrations, or amount of travel)
Intermediate outcomes: Safety performance indicators may include behavioural measures such as average vehicle speed, drink-driving, helmet wearing rates, seatbelt wearing, attitude survey information; vehicle safety ratings; infrastructure measures, including road safety ratings, % of high volume high speed roads that are divided by a median, % of roads where pedestrians are present with adequate footpaths; and post-crash care indicators such as emergency vehicle response times.
Outputs: Process/implementation indicators may include the policies, plans or programmes that have been implemented and details of this implementation (e.g. campaigns to promote seatbelt use, hours of additional speed enforcement, investment in safe road infrastructure, number of new ambulances).
For example, analysis of data may have identified vehicle speed as a risk factor. A policy to improve compliance with speed limits will require an increase in speed enforcement. The output results of this intervention would be evidence of this increase in enforcement. Intermediate outcome measures might include the percentage of drivers exceeding the speed limit at selected locations. Changes in this measure (i.e. a reduction in speeding motorists) would help identify whether the intervention is having the desired effect. The final outcome indicators would include total deaths and serious injuries (ideally including a record of those that were identified as being speed-related), proving the ultimate benefit of this intervention.
Although crash data is a primary source of safety-related information, other data sources also serve a very important role. There is growing recognition of the use of asset data (including road design features) in road safety, and in many cases this information may already be collected and available for use. As identified later in this chapter, many countries do not have accurate information on crashes, and until such data is available, information about road design features and key safety behaviours provides an important means of identifying high risk locations and ways to address them.
Often different sources of information will be available on similar issues. Although multiple sources of information can be useful to help understand road safety issues more fully, it can also lead to confusion if the sources provide conflicting information. Differences can result from inaccuracies in data or differences in how the data is collected (see Quality and Under-reporting for further discussion of these issues). Where there is potential for confusion from the use of multiple sources of information, it is important to select a ‘single source of truth’ from a data source that will ultimately inform decision-making. Once this source of information is selected, justification needs to be provided as to why this source is preferred.
Different terms for injury severity are included throughout this manual. Definitions for different types of injury are provided in Box 5.2.
Fatal injury: any person killed immediately or dying within 30 days as a result of a road traffic injury accident, excluding suicides.
Serious injury: Injury that requires admission to hospital for at least 24 hours, or specialist attention, such as fractures, concussions, severe shock and severe lacerations. Some countries have adopted the Maximum Abbreviated Injury Scale (MAIS), and suggested that serious injury be defined as MAIS3+.
Other/minor injury: Injury that requires little or no medical attention (e.g. sprains, bruises, superficial cuts and scratches).
Property damage/non-injury: No injury is sustained as a result of the crash but there is damage to vehicles and/or property.
Source: WHO, (2010).
This section provides guidance on the establishment and maintenance of crash data systems. Information on the collection and use of other sources of data can be found in the following sections. Full details on the establishment and maintenance of crash data systems can be found in WHO (2010). The following is a summary of key issues.
Identified effective practice acknowledges that no single crash injury database will provide enough information to give a complete picture of road traffic injuries or to fully understand the underlying injury mechanisms (IRTAD, 2011). A number of countries which have improved their road safety performance use both crash injury data collected by the police as well as health sector data.
National crash data are typically collected by police (WHO (2013) reports that over 70% of countries use police data as the primary source), and entered into crash database systems for easy analysis and annual reporting. In some circumstances, data are collected from hospitals, or from both of these sources. The use of health sector data for meaningful injury classification at country level is necessary to complement police data and to provide an optimal means of defining serious injury. IRTAD (2011) recommends that police data should remain the primary source of road crash statistics, but that this should be complemented by hospital data due to data quality issues and to identify levels of under-reporting (see Section 5.4). Furthermore, in-depth data is needed from crash injury research to lead to meaningful conclusions concerning crash and injury causation.
The police are well placed to collect information on crashes as they are often called to the scene. Alternatively, they may receive information about the crash following the event. Attendance at the crash scene allows for collection of detailed information that is useful for identifying crash causes and possible solutions.
A crash report form is typically completed (traditionally a paper-based form, although recently computer-based systems have been used), allowing collection of quite detailed information on the crash. Key variables typically collected include:
Examples of crash report forms, including the types of detail that should be collected as a minimum can be found in WHO (2010). The advice provided in the WHO document is based on the European Common Accident Dataset (CADaS). In addition, a number of countries have developed their own minimum criteria. For example, the US has a Model Minimum Uniform Crash Criteria (further information is available on a dedicated website at http://www.mmucc.us/).
A balance needs to be reached between collecting the required information, and the time it takes to perform this task. If too much burden is placed on the police, it is less likely that the crash report form will be completed. Police are key stakeholders in the establishment and continued collection and use of crash data, and should be included at each stage of the process.
Hospital data is used to identify levels of under-reporting or to obtain better injury information, particularly when police report data is not available or is inadequate. IRTAD (2011) suggests that because of under-reporting of crash data, hospital data should also be collected, and is the next most useful source of information for crash statistics.
Encouraged by the WHO and other institutions, medical authorities have established international recording systems that include road traffic injury. In particular, the International Classification of Diseases and related Health Problems (ICD) and the Abbreviated Injury Scale (AIS) coding systems are used widely. IRTAD (2011) recommend that an internationally agreed definition of ‘serious’ injury be developed, and that the Maximum Abbreviated Injury Scale (MAIS) be used as the basis for defining crash injury severity. This scale is based on maximum injury severity for any of nine parts of the body. A score of 3 or greater for one or more regions of the body (MAIS3+) is recommended as the point at which an injury is considered to be serious. An example of the use GIS analysis and hospital data from Thailand is provided below.
A further example is provided in the case study from Egypt, demonstrating the integration of data from different sources, as well as the use of this data by various key stakeholders.
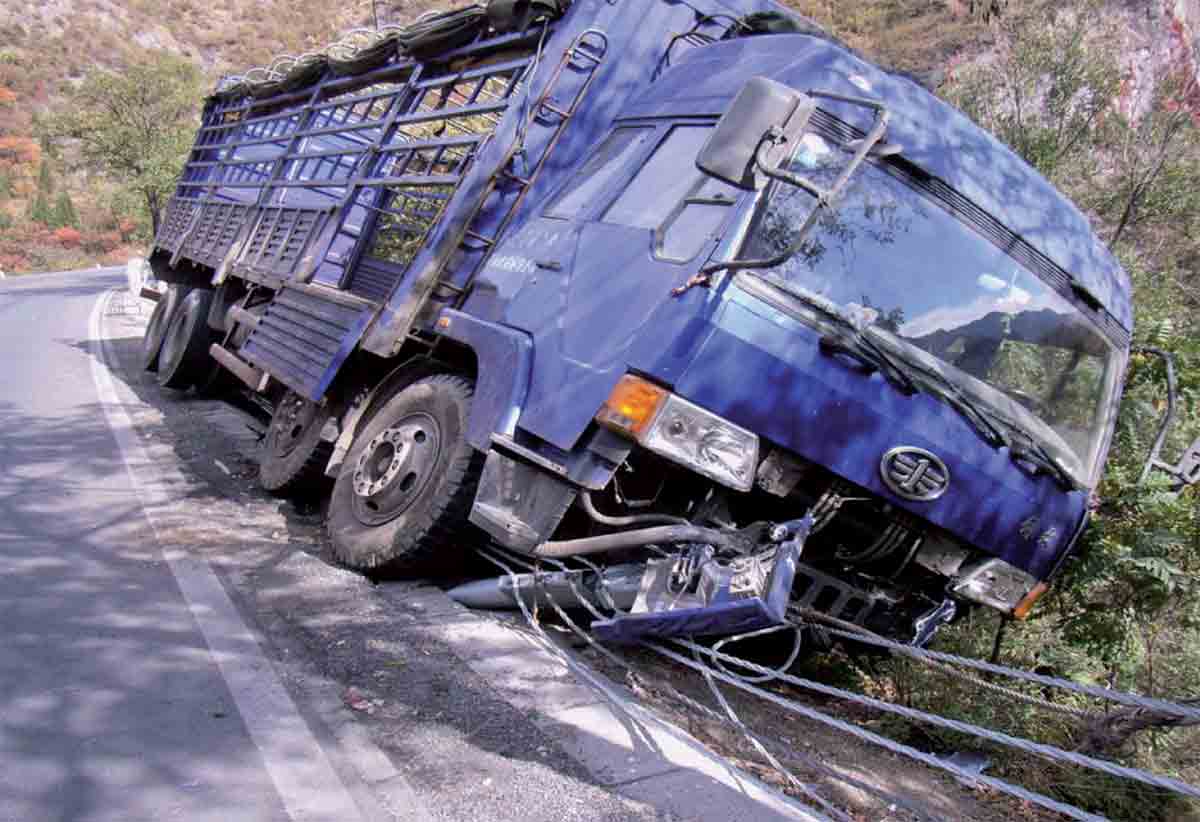
‘Vital registration’ data can be used as a source of information on road deaths. This information comes from death certificates completed by doctors which state the cause of death. WHO (2010) reports that around 40% of WHO member countries collect vital registration data of the detail required for monitoring road traffic deaths. WHO and other organizations have instituted an international registration system that includes those injured in traffic crashes.
Other sources of data on crashes can come from emergency services, tow truck drivers, members of the public, insurance companies, etc. However, it is important to recognise that the quality and extent of this information may be limited when compared to police and hospital reported data.
Before establishing a new crash database system (or improving a current system), it is recommended that a situational assessment be undertaken (WHO, 2010). This involves:
These same steps are also required when establishing or improving on the collection of non-crash data (see Non Crash Data and Recording Systems).
A stakeholder analysis involves identifying organisations and individuals who have (or should have) a role in the collection and use of road safety data. Critical stakeholders will include police, transport agencies and health departments, but there are likely to be many others.
An assessment of data sources is required to determine what information is already collected, and the quality of the data. This is often a significant problem in many countries.
An end user assessment involves understanding who the key users are and, how these key stakeholders use the information. This knowledge will help improve the usability of the data.
An environmental analysis involves understanding the political environment and critical partnerships required for the successful collection, analysis and use of the data. Without this understanding and appropriate collaboration, it is likely that collection and use of crash data will be severely hindered. There are many examples where expensive crash data systems have been established, but data has not been entered into the system due to inadequate communications and poor cooperation.
Following this situational assessment, the recommended process for establishing a crash database system is to:
Crash location is a key element in collecting and analysing data, particular for road engineers. Without this information, it is not possible to determine what locations to treat in the future. In addition, if the crash location is known (whether from police reports or other sources of data), there is potential to link this crash data to asset or other data sources (see Analysis of Data and Using Data to Improve Safety). This information may be of use in identifying other road-based elements that may have contributed to the crash risk.
Several methods are available for the accurate location of crashes, including the use of global positioning systems, reference to a local landmark (e.g. a link-node system), or reference to a route kilometre marker post (a linear referencing system).
Historically, crash data records were kept in paper-based filing systems, but now computerised database systems are used to store information on crashes. This allows relatively easy analysis of data, and is particularly useful in the identification of trends, high risk locations or areas, key crash types, etc. There are a number of computer software packages available for this task. At a minimum, such a system should have the capacity to:
Crash data systems have become very advanced in recent years, with features added that allow quicker and more useful analysis. WHO (2010) and Turner and Hore-Lacy (2010) provide a list of other desirable features of crash data systems. These include:
An example of the successful implementation of a crash data system is provided in the case study below from Cambodia.
The Swedish Strada system is a unique database that integrates police and hospital data. It is important to recognise that although this linkage provides valuable additional information, it does occur at additional cost. Further details are provided in the Swedish case study.
Some countries have undertaken in-depth studies of serious crashes to provide a more thorough understanding of crash causation factors and possible solutions. Such studies typically investigate a sample of high severity crashes. As an example, in the UK, the ‘On the Spot’ project collected detailed and high-quality crash information over two regions. More than 2000 variables were collected for each incident based on scene investigation soon after the crash occurred, as well as follow-up communication with medical services and local government. The information was analysed to provide insight about human involvement, vehicle design, and highway design in crash and injury causation. Mansfield et al. (2008) provide an initial analysis of around 2000 incidents from this program. Such investigation can provide far more detail than what is typically available through a crash report, and to a higher degree of reliability.
Similar examples can be found in many other countries, including the USA, Germany, France, Malaysia, India and Australia. Some of these programmes have been in place for many years, and have produced large amounts of valuable information. One of the key outputs from the EU DaCoTA project (which collected and analysed data from European countries on various road safety topics) was guidance on the collection of such data, as well as standardised procedures (Thomas et al., 2013). A Pan-European In-depth Accident Investigation Network has been established, and tools such as an online manual for in-depth road accident investigations have been developed (see http://dacota-investigation-manual.eu).
The US has established the second Strategic Highway Research Program (SHRP2). SHRP2 is perhaps the most comprehensive database of information on factors occurring before and during crashes and near-crash events. The information collected includes data from the Naturalistic Driving Study (NDS) database. This dataset includes information from over 2300 drivers, collected through equipment installed in their own vehicles, and through normal driving. The massive amount of data collected through the NDS is supplemented through the Roadway Information Database (RID) which includes comprehensive information on road elements in the study areas as well as other relevant data (including crash data). This globally significant database is expected to provide the research basis for studies on driver performance and behaviour. More information can be found at http://www.trb.org/StrategicHighwayResearchProgram2SHRP2/Pages/Safety_153.aspx.
UDRIVE is the first large-scale European naturalistic driving study using cars, trucks and powered-two wheelers. The acronym stands for “European naturalistic Driving and Riding for Infrastructure & Vehicle safety and Environment”. Whilst road transport is necessary for the exchange of goods and people. There are significant negative consequences to road safety and the environment. To meet EU Target crashes and vehicle emissions will need to be reduced, with new approaches to achieve these targets developed. It is the aim of UDRIVE to provide a better understanding road user behaviour leading to crashes and wasted vehicle emissions.

Sharing of data from different sources is required for the comprehensive collection, analysis and integration of data. Efficient data sharing, particularly between the police and the highway authority, is essential for good practice road safety management.
However, it is important to note that some organisations may be reluctant to share certain data, particularly personal identifiers, due to the issues it poses surrounding the privacy and anonymity of those involved. One response is to collect the personal details on a separate page of the crash report form (e.g. name and address information). This page can then be removed before sending the remaining pages on to partner agencies. In some cases, it may be necessary to develop appropriate privacy policies to ensure this issue is addressed, or for certain variables to be removed to prevent the identification of individuals.
Crash data on its own is a valuable source of information on crash risk, and when combined with other sources of data, this value can be greatly increased. The following section discusses some of the other data sources, while Analysis of Data and Using Data to Improve Safety discusses combining these sources.
Crash data is generally considered a key source of information when assessing and treating risk. However, in some countries, particularly LMICs, crash data may not be reliable or available at all. Additional surveys and data sources other than crash data may be the only reliable source of safety data available. As discussed in Identifying Data Requirements, this additional information (safety performance indicators) is also important in road safety management. These enable assessment of different policies, programmes and projects to identify their effect on road safety outcomes. This occurs through the collection and assessment of details on the interventions implemented and the intermediate outcomes.
A variety of other data sources are available, including information on road design and features, traffic data, survey data and exposure data.
Road inventory data are a major source of information that can assist in assessing safety. Because the impact of different road elements is well known, different elements or combinations of elements can provide vital insight into crash problems, including the key crash types contributing to fatal and serious injury outcomes (see The Safe System Approach). The following data are of particular use:
This presents a basic list of relevant road element types, but there are many other factors that may have an influence on safety outcomes. The International Road Assessment Programme (iRAP) collects around 70 attributes (see http://www.irap.org/about-irap-3/methodology for details of these attributes, and Proactive Identification for more information on iRAP, and Box for examples of the data collection undertaken in Mexico). In the United States, the Model Inventory of Roadway Elements (MIRE) provides a list of 202 elements that may be needed for making road safety decisions. Further information on MIRE can be found at https://safety.fhwa.dot.gov/rsdp/mire.aspx.
Road features need to be spatially located (ideally through a GIS-based system) to allow effective analysis and cross-linkage.
Road inventory data relevant to road safety may already exist (e.g. through road asset database systems) or it might need to be collected. A situational assessment should be performed to see whether this data exists (see Establishing and Maintaining Crash Data Systems). Road inventory data has traditionally been used for road safety audit or inspection (see Assessing Potential Risks and Identifying Issues), but in more recent times, methods have been developed to quantify the likely safety outcomes based on these elements. The case study below shows Mexico's efforts to collect data on 46,000 km of its Federal Highways.
The collection of this data can be based on ad hoc approaches (e.g. through periodic inspection, public complaints, etc.), but should ideally be through a comprehensive programme conducted on a regular basis. The most common approach involves the collection of data through video images, and subsequent rating or coding of this data by trained experts. This information is then fed into a database or asset register (see Box 5.3).
For more extensive data gathering, computer-aided collection can be undertaken using a tablet or laptop, or information can be collected via video and coded safely back in the office. With a tablet, information is added to a database while travelling along the road of interest. Touch screen technology is typically used to select relevant road variables. Different symbols may be displayed on screen to facilitate quick data entry. As mentioned earlier, it is often difficult to enter all relevant variables when travelling at high speeds or in busy environments, and so video is often recorded to assist in later data entry and checking.
Another option involves the desktop assessment of video data. One or more video cameras can be used to collect data along the network of interest. A single camera can be used to gather information in a forward direction. Alternatively, more cameras can be used to allow better collection of road and roadside information. This video imagery is then used to code the variables of interest. The video images can be calibrated to allow measurement for more accurate collection of information (such as road width or distance to roadside hazards) and to ensure accurate spatial location of assets.
Video images are assessed, and can be paused to study more complex environments. Information from the images is added to a database for later analysis. This data entry may be through a dropdown menu system or manual population of a database. Data is typically collected for a discrete length of road (e.g. a 10 m section).

Figure 5.4: Populating a database with safety-related inventory data.
New technologies are being developed that will assist in more automated collection of road and roadside data. As an example, it is possible to collect information on features such as road width, horizontal and vertical alignment, and road surface condition using Light detection and ranging (LiDAR) and other vehicle sensors.
Traffic data is important to collect and analyse, particularly traffic volumes (or Average Annual Daily Traffic, AADT). This data can be used to generate crash rates, which provide a good indication of safety performance, including the safety performance of specific routes, road types or even infrastructure elements. Other types of traffic data include the traffic mix (e.g. percentage of different vehicle type; motorcyclists, bicyclists and pedestrians) and vehicle speeds (mean and 85th percentile speeds, compliance with speed limits). Traffic data can be collected using manual traffic counts or through automated means (e.g. pneumatic tubes or permanent data collection devices installed in the pavement).
Aside from traffic data, other sources of exposure data include population data (total number of people; number by each age group) for an area or country. This data is typically available from national census data. Vehicle registration data is also often collected and used.
Attitude surveys collect information on the views of drivers, other road users and residents. This information is considered an important source of feedback for assessing the effectiveness of a new programme or treatment, and can provide insight into driver behaviour (for example, low compliance levels with the posted speed limit).
Information on the number of police checks (e.g. for speed, alcohol, restraint use), number of violations (e.g. number of vehicles speeding; motorcycle riders without helmets), and number of drivers punished (e.g. fined, penalties provided or imprisoned) are all useful measures. These will help assess the impact of new policies or actions on safety outcomes.
In addition to the data sources mentioned above, other useful information can be gathered from the following sources, where available:
Other types of compliance data are discussed in the following section.
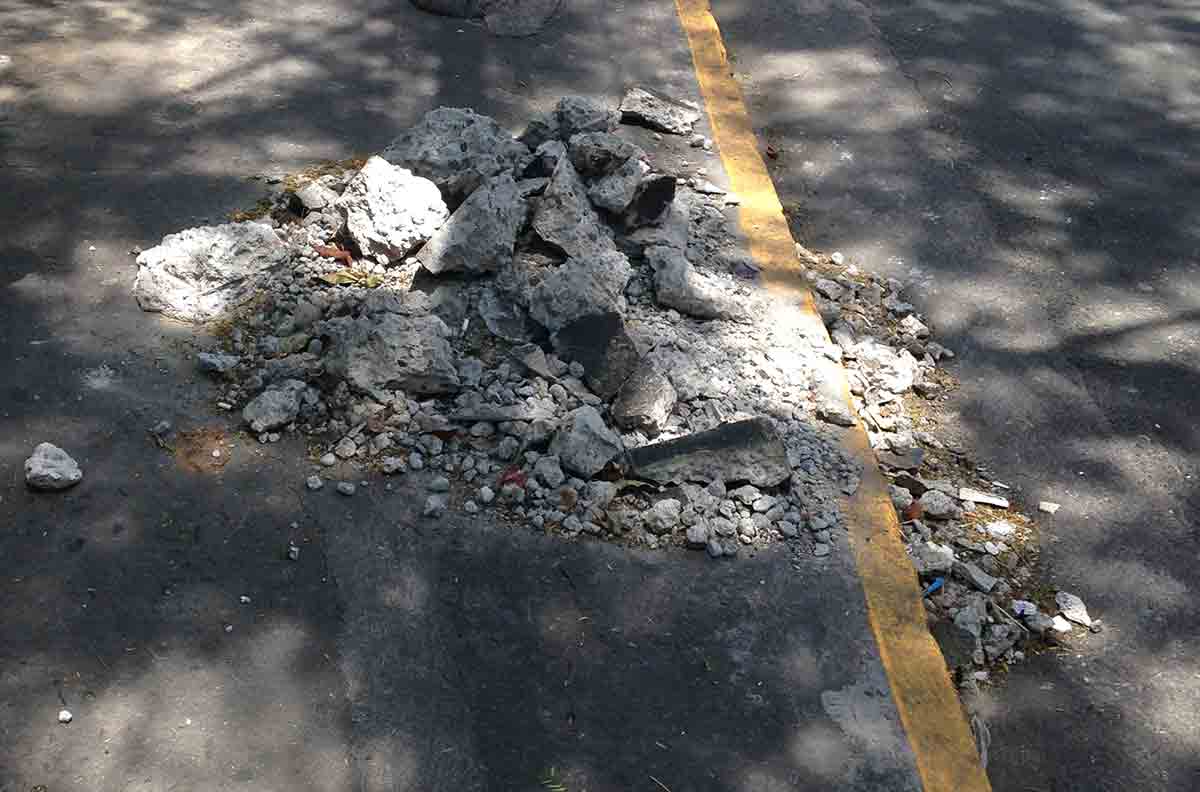
Often traffic data and driver behaviour data are not readily available. There is no set list of additional data that must be collected, and given the cost of any type of data collection, careful thought needs to be given to this task, regardless of whether this is conducted at national level or for specific locations. Additional data should be collected when there is a need for it, and collection of this data should be cost-effective.
The following section provides a brief description of some of the more common data surveys performed, as well as different methods that can be used. References to useful material is also provided.
A spot speed survey involves the collection of a sample of speeds at a specific road location, or at a number of locations. This can then be used to determine the speed distribution of vehicles, which is useful for the following reasons:
Vehicle speeds can be measured using manual methods (radar or laser guns, stop watch), or using automatic methods (loops or tubes). Automatic methods are better for studies that require a larger sample. Loops and tubes can also record more than just average speeds, such as traffic volumes, vehicle turning movements and traffic mix. These components are essential to understanding the safety issues that exist at a location. The GRSP Speed Manual (GRSP, 2008) and the UK government (DTR, 2001) provide in-depth guides to speed and volume measurements and how to manage speed-related safety issues. See case study on speed data collection in India.
GRSP has developed two separate manuals, one dedicated to seatbelts and child restraints (GRSP, 2009) and the other dedicated to helmets (GRSP, 2006). Each of the manuals provides information on how to assess the extent of non-seatbelt and non-helmet use in a project region, as well as how to design, implement and evaluate a programme to target these issues. With regard to measuring seatbelt and helmet usage, the guides list possible sources of this information, as well as how to collect the data through conducting community surveys and observational studies.
Much like measuring helmet and seatbelt usage, GRSP has developed a road safety manual for drink-driving (GRSP, 2007). This provides information on how to assess the situation and choose priority actions, as well as how to design, implement and evaluate a drinking and driving programme.
The guide suggests collecting data from relevant authorities, such as the police, road authorities and health sectors, to understand the size of the problem. Data on the level of compliance with existing laws can be collected through a combination of crash data (i.e. crashes involving drivers and riders with Blood Alcohol Content (BAC) levels exceeding the legal limit), the number of alcohol offences detected by police, the percentage of drivers stopped with a BAC over the legal limit, and by performing driver surveys (GRSP, 2007).
There are a variety of other intermediate outcomes that could be measured, depending on the interventions implemented.
As for crash data, it is important that survey data be recorded in a way that can be analysed easily. It is also beneficial for the system to be developed so that data can be linked with other data sources. This is particularly important for surveys that cover a broad geographic area (such as traffic volume, asset or population data). Such systems may already exist for this data. A common method is to link data by location using a Geographic Information System (GIS). These systems can typically store information that is linked geographically for future analysis. Different types of data can be added to such systems as a ‘layer’, allowing more powerful assessment of risk (see Analysis of Data and Using Data to Improve Safety).
When collecting, managing or utilising road safety data, it is important to remember that data quality can be compromised at any stage of the data process. This can be due to:
There are a number of consequences associated with poor data quality and under-reporting of crash data (Austroads, 2005; OECD, 2007). Some include:
This section will consider factors that affect data quality, as well as methods for studying inconsistencies in data and how to improve data quality. Although this section concentrates on crash data, quality issues are also relevant to non-crash data, and care needs to be taken in the collection and interpretation of this.
Data can sometimes be recorded incorrectly by the police or data entry staff. A major issue to note is that the person who fills in the form at the scene is, in most instances, not the same person who enters the data into the database (OECD, 2007). Missing, incomplete and incorrect data is often unintentional and is the result of human error. Due to officer priorities and workloads, the police cannot always attend the scene of a crash or may not have the time to completely fill out the crash report (which can be made worse by unnecessarily long data collection forms). Unclear variable definitions, as discussed in the next section, can also result in incomplete or incorrect data entry. Similar issues can also occur with non-crash data. For example, road asset data can be coded incorrectly, or data entry errors made during the analysis of speed data.

© ARRB Group
The definition of each variable (crash type, injury severity, location, etc.) can differ between data sources (for example, police crash files, hospital records, insurance claims), jurisdictions and countries. This can lead to complications in the identification of crashes of interest, the comparison of datasets, and the evaluation of data quality within a dataset. Common confusing definitions are discussed below.
The most common categories of injury severity are fatal, serious/severe and slight/minor injury. However, the exact methods used by police and hospital staff to determine which injuries fit into which severity categories can be problematic.
A recurring issue when comparing datasets from different countries is the timeframe that applies to ‘fatal’ injuries and crashes. The 30-day rule defines a fatal crash as when any person is killed immediately or dies within 30 days as a result of a road crash injury, excluding suicides. The 30 day rule is the most common classification used around the world, particularly by high- and middle income countries (WHO, 2010). Other countries, particularly lower-income countries, use the definitions of ‘at the scene’ or ‘within 24 hours’ to classify fatalities, which can create inconsistencies between databases. Adjustment factors have been developed to account for this (WHO, 2010); however, this assumes that similar proportions of vulnerable road users exist in each system, which is not necessarily the case (WHO, 2010).
The 30-day rule also implies that there is some coordination between the police officers who attended the scene and hospital staff in order to check for updates on patient status after 30 days. This is often not the case due to different priorities and workloads of those involved (WHO, 2010). The same issue arises with regard to non-fatal injury classification: a serious/severe injury is often classified as ‘admission to hospital’; however, police often classify this as all people who leave the scene in an ambulance (Austroads, 2005). Similarly, there is variation in what hospitals consider to be a ‘serious injury’ (see IRTAD 2011 for a detailed discussion of this issue). An increasing number of patients are being referred to specialist clinics (e.g. fracture clinics) instead of being admitted to hospital. Therefore, in some databases it is difficult to tell whether trends showing fewer admissions are a result of a change in the severity of crashes or a change in the health care management system (Ward, Lyons & Thoreau, 2006). IRTAD (2011) recommends that serious injury should be determined by trained hospital staff and not the police at the scene of a crash. In reality, such checks on crash severity outcome are often not made, and it is to the police in attendance to determine the severity outcome.
In some countries ‘property damage only’ or ‘non-injury’ crashes are required to be reported, and in others they are not. Sometimes the level of damage must exceed a certain monetary limit before it must be reported. Such additional information can be of use, especially in the identification of crash locations and likely causation, although it does entail a higher cost in terms of data collection and entry.
The definition of a road traffic crash may incorporate or exclude crashes involving non-motorised vehicles. It may also exclude crashes that occur on private roadways or in off-road locations such as parks and parking lots. On the other hand, some countries collect information regardless of the location (WHO, 2010).
Another common issue is that hospital outpatient files often simply focus on the nature of the injury (e.g. broken femur) and sometimes neglect to mention the external cause of the injury. This can make it practically impossible to identify which cases are crash-related, and it also reduces the information available to identify and treat crash locations (WHO, 2010).
There are a number of different methods used to determine the location of a crash (as discussed in Establishing and Maintaining Crash Data System). Each of these methods can be subject to error, which can lead to inaccurate or non specific crash locations recorded by police. This can make it difficult to assess the significance of particular crash locations.
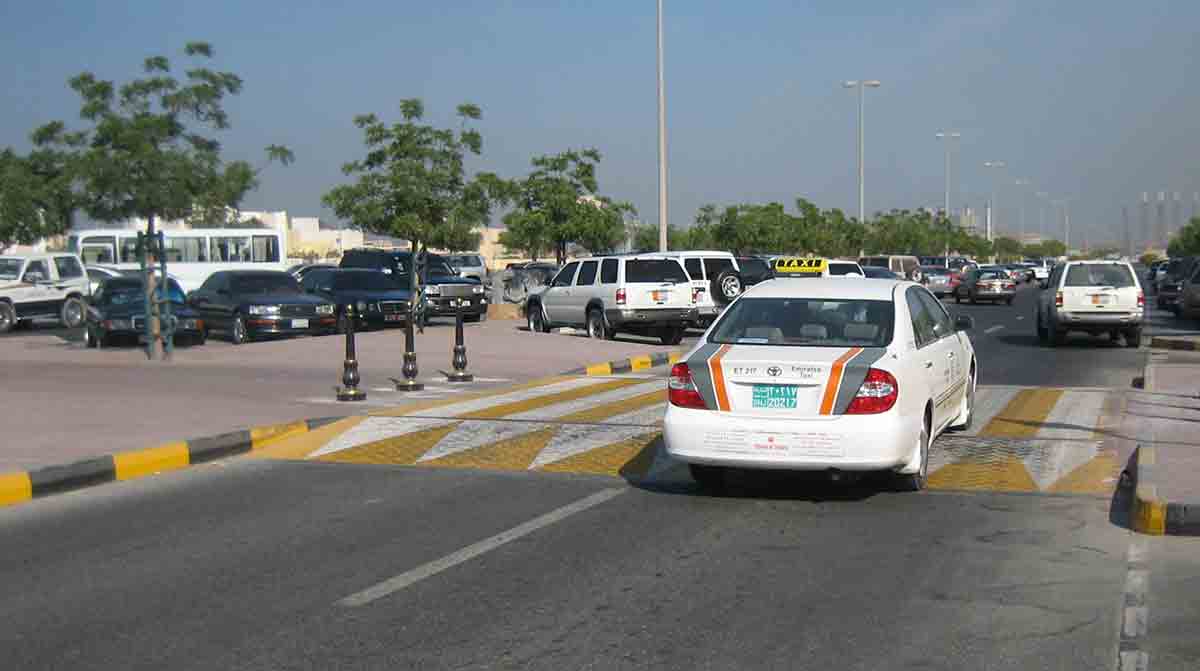
Under-reporting can occur at any point in the data collection and data entry processes. WHO (2010) discusses the factors contributing to under-reporting in police data and health facility data in detail. Under-reporting often varies with crash severity, transport mode, road user types involved, victim age, and the crash location. Common findings are that (Austroads, 2005; Ward, Lyons, Thoreau, 2006):
This under-reporting issue can be a significant problem in all types of countries, but has been a particular issue in LMICs (see Box 5.4 and Box 5.5).
.")
Figure 5.5 - Source: WHO, (2013).
However, as indicated by WHO (2013), this activity had the unintended outcome of indicating a substantial increase in road crashes for 2010. This apparent increase is not a result of an actual increase in road deaths, but rather an improvement in the recording of existing deaths. Several countries are experiencing similar apparent increases in road deaths, when in reality the level of data accuracy has improved. The improved data allows for better identification and management of road safety issues. However, the impression that crashes are increasing substantially is an issue that also needs to be managed.
Source: WHO, (2013).
It is typically the case that higher levels of severity have better levels of reporting. Many countries (especially in HICs) record all fatal crashes, and have reasonable records of more serious injury (e.g. hospitalisation). Information for minor injury is typically less well reported. One quick way to determine the likely scale of under-reporting rates for non-fatal crashes is to compare the ratios for fatal crashes to other crash types between countries or regions. Although a number of factors need to be considered (e.g. road types, vehicle fleet, average speeds, etc.), the discrepancy in these ratios can indicate differences in reporting rates.
Datasets can be assessed for under-reporting levels and data quality by comparison with other databases. A common comparison to make is between police crash data and hospital in-patient data. Another source is to use insurance claim data. Although these evaluations are very useful, it is not possible to determine the real number of total road crashes as there is no way to know the exact intersection of the two databases (OECD, 2007). There will be some crashes that are recorded in police crash report databases, but as victims are not always sent or admitted to hospital (i.e. in property damage only or minor injury crashes), they do not always appear in the hospital database. Conversely, there will undoubtedly be hospital injury records that are not crash related.
Matching hospital and police data allows cases to be checked for accuracy (ensuring the information provided in both databases is the same) and also provides a basis to estimate the proportion of under-reported cases in both the police and hospital files, as shown in the diagram below (OECD, 2007).

Figure 5.6 - source : OECD, 2007.
A common problem with this technique is that some countries do not allow the release of victim names and sometimes even personal identification codes. Cases can then only be linked by other characteristics, such as time, date and location (Austroads, 2005). Data can only be reliably maintained when the data quality is regularly monitored. WHO (2010) and IRTAD (2011) provide details on methods for assessing data quality and under-reporting rates.
It is typically not possible to successfully collect data for every crash on a network, but not all crashes need to be reported to be able to draw conclusions and identify key priorities to improve road safety (Austroads, 2005; ; FHWA, 2017). However, the more comprehensive the data set, the higher the reliability.
The main steps to improving data quality include:
Section 3.4.1 of WHO (2010) discusses in detail how the above steps can be put into action. It discusses effective solutions such as the benefits of data entry systems with built-in checks to minimise mistakes, and engaging with police so that they see the value and importance of this task and their role within it. It is also important to acknowledge that a balance must be found in the number of details the police must record at a crash scene. Too many questions will lead to incomplete or missing crash reports, whereas too few will limit essential details that are required for future analysis.
Crash data can be extremely useful to a number of agencies and individuals, including:
This section considers the availability of crash data, different users, and current international cooperative efforts to improve crash data.
Crash data is useless to organisations that cannot access it. Appropriate methods for distributing data should be developed for each agency that requires it, through the use of statistical reports, newsletters, websites and workshops (WHO, 2010). If the funding is available, an excellent way to make crash data available is through the use of online public searchable databases, which can provide customised reports based on location, injury type, or other crash characteristics (WHO, 2010). An example of such a system is provided in Box 5.6.
Another effective method to distribute data is through the media, which can act as an agent of change by influencing public and political opinions.
It is important to remember that regardless of the method of distribution, those responsible for crash data also hold the responsibility to protect the privacy of individuals involved. Steps can be taken to assist with this as outlined in WHO (2010).
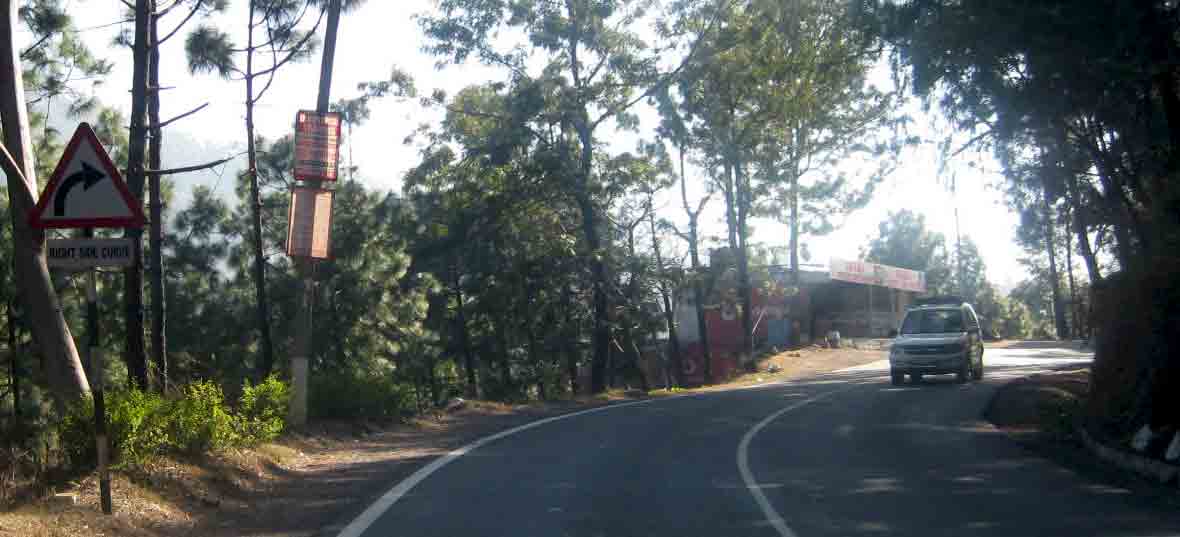
Data can be used to raise awareness about particular road safety issues, and to act as evidence and draw support for a certain policy, programme or allocation of resources (WHO, 2010). Common advocacy activities include workshops, news reports and campaigns. Advocacy is an important part of road safety – it can be the source of funding and public support. It is important to note that any advocacy material must take the target audience and the context of the recommendation/cause into account in order to have a desirable affect. WHO (2010) provides a number of tips for developing advocacy messages for policy-makers. The Cambodia case study demonstrates the use of road safety data for advocacy purposes.
Road safety engineers are often the most common users of police-based crash databases for road safety work. Crash data is used to identify high crash risk sites, as well as possible identification of risk factors that are specific to the site. This is explained in further detail in Assessing Potential Risks and Identifying Issues.
In the identification of problematic crash locations, target groups or particular risk factors, policy makers use crash data to approximate the size of the problem in terms of counts, severity, trends and the costs of road traffic injuries (WHO, 2010). It is therefore important that these individuals have access to crash characteristics, such as age group, crash type and road user group, so that they can make informed decisions about which high-risk problems get priority and what solutions can be effectively implemented.
Police can also utilise crash data to target enforcement towards a particular issue or location. It is important that the police receive regular feedback so that they can see how their efforts in the collection of crash data, and in traffic enforcement, are having a positive impact (WHO, 2010).
Crash data is essential to evaluate treatments and policies that have been introduced. Evaluations provide a knowledge base about the effectiveness of a given treatment, as well as ensuring that current programmes are providing the expected and desired results.
New analyses can strengthen the known effectiveness of an initiative, such as through the development of crash modification factors (CMFs). Further information is provided in Monitoring and Evaluation of Road Safety on the monitoring, analysis and evaluation of road safety countermeasures, including the effectiveness of treatments and development of CMFs.
International cooperation is essential for data coordination and benchmarking. International assessments can help to identify and monitor national road safety issues, as well as to evaluate the effectiveness of any methods implemented on a wider scale. Benchmarking (through a comparison of safety performance with similar peer countries, regions, cities, etc.) can lead to the identification of road safety issues that need to be addressed. It is important to note that this cannot be achieved unless there is consistency across crash variable definitions. Coordination also helps countries and governments to improve their road safety data quality and collection systems (see Box 5.7).
.")
Figure 5.8 - Source: OECD/ITF, (2014).
In 1988, the Organisation for Economic Co-operation and Development (OECD) established the International Road Traffic and Accident Database (IRTAD). This database includes crash and traffic data from over 30 countries, which is continuously updated and analysed for trends.
The database includes data such as crash severity, road user group and road user age, and also includes relevant country details such as population, vehicle composition, road network length and seatbelt usage rates. This has allowed very useful benchmarking to occur, allowing comparison of fatality rates (e.g. road fatalities per 100,000 population) between countries.
The IRTAD Group is a working group consisting of road safety experts and statisticians from all over the world. Its main objective is to contribute to international cooperation on safety data and analysis. This is achieved through the exchange of data collection and reporting systems and trends in road safety policies, research and publications on key and emerging issues in road safety and through providing advice on specific road safety issues to member countries.
The IRTAD Group is also in charge of the development of the IRTAD network and database coverage, twinning programmes to assist LMICs in improving their data collection and reporting systems, the IRTAD Conference, and publication of the Annual Report. It also provides standardised definition and methodologies for comparison purposes (e.g. defining injury and crash severities)
Source: OECD/ITF, (2014).
Within the framework of its outreach strategy in LMICs, IRTAD has launched a twinning programme to assist countries. IRTAD is working with a number of organisations in an effort to assist LMICs improve their data collection methods and database setup and management. Several such arrangements exist, including twinning between Cambodia and the Netherlands, Jamaica and the UK, and Argentina and Spain. Other partnerships are currently being developed. The case study in Box 5.15 provides information on the twinning arrangements between Argentina and Spain. Box 5.16 provides details of a broader regional observatory in Latin America. Box 5.17 provides details of the IRTAD/OISEVI Buenos Aires declaration on better safety data for better road safety outcomes.
Example of data collection and use of data are shown in the following two case studies, highlighting Argentina and Spain, as well as the Ibero-American Road Safety Observatory.
In November 2013, 40 countries met at the Joint IRTAD/OISEVI Conference in Buenos Aires. The meeting agreed on 12 recommendations on better safety data for better road safety outcomes, including that:
Full details can be found at the following website: http://www.internationaltransportforum.org/jtrc/safety/Buenos-Aires-Declaration.html
In Europe, a centralised database of road crashes has been developed. The Community Road Accident Database (or CARE) is hosted by the European Commission and includes information on fatal and injury crashes. Details on individual crashes are retained (i.e. the information is not combined), thereby allowing for more powerful analyses to be conducted. A protocol for the collection of data has been developed, with common variables specified. The intention of the database is to provide the basis for analysis to:
Further information on CARE can be found on the European Commission website (http://ec.europa.eu/transport/road_safety/index_en.htm).
The integration of safety data provides a large number of benefits, including:
In addition, linked data can be used to validate other sources of information. As an example, crash database systems can either draw information directly from asset data to provide additional information on road elements, or this linkage can be used to reduce the likelihood that data entry errors will occur by validating the presence of different road features or assets. It can also be used for research on specific topics.
Key linkages include combining crash data with:
The linkage process involves several stages, and can be temporary (e.g. for a specific project or policy need) or permanent (e.g. for ongoing analysis and monitoring). Data needs to be collected in a format to facilitate linkage. This typically involves provision of a common data element, most usefully the spatial coordinates for road based elements (including crashes), while for non-spatial data, another unique identifier will be required for the datasets to be linked. A comprehensive safety information system may have a large number of component files.
Once the data has been linked, it can be analysed through merging of data files. For spatial data, a GIS software package is able to assist greatly in this task, and is particularly useful for mapping information from different sources.
Once the initial investment in collecting data has been made, it may be a relatively low cost task to join different sources of information together to meet a variety of needs, especially if a unique identifier has been used in each dataset. In other circumstances, especially where data is not in a compatible format, the task might be quite substantial involving considerable investment.
One of the more commonly used linkages is the calculation of crash rates to allow either benchmarking or identification of high risk locations. For example, crash data can be combined with population figures, traffic volumes, or vehicle registrations to provide a useful comparison of risk. Ideally, each of these would be presented as fatal and serious injury crash rates. Each of these measures is useful for different purposes, as outlined below:
Crash data can also be combined with road inventory data. At a simple level, this can provide information about current road features that may be present, providing information about possible infrastructure safety improvements. For example, crash data of run-off-road crashes could be presented alongside information on current roadside barrier locations on a map to allow for a quick visual analysis of locations that might benefit from further barrier installation.
Combining data on crashes with roadway, asset, environment, and traffic volume data can lead to some important outcomes relating to safety performance of infrastructure. It is possible to compare the safety performance of different types of infrastructure for different traffic volumes. For example, the performance of divided and undivided roads can be compared for different traffic volumes. In addition, crash performance of different infrastructure can be compared at different levels of traffic volume, for different road user types, or for different environment types (e.g. low versus high speed environments). Box 5.9 provides information on the US Highway Safety Information System.
A large number of studies have been conducted using this rich source of information. This has led to the production of various research reports, summaries and tools. Recent examples include a study that examined the safety effects of horizontal curves and grades on rural two-lane highways; a safety evaluation of lane and shoulder width combinations; an evaluation of the safety benefits of transverse rumble strips on approaches to stop-controlled intersections in rural areas; and a review of the safety benefits of ‘road diets’ (converting four lane arterial roads to two lanes, plus a central two-way turn lane).
Further information on the HSIS can be found at the following website: www.hsisinfo.org
Recent initiatives in integration have involved the combination of crash data and road risk assessment data. This provides a very powerful tool for identifying risk locations and possible solutions. Further information on the combination of this data can be found in Combining Crash Data and Road Data and Intervention Selection and Prioritisation.
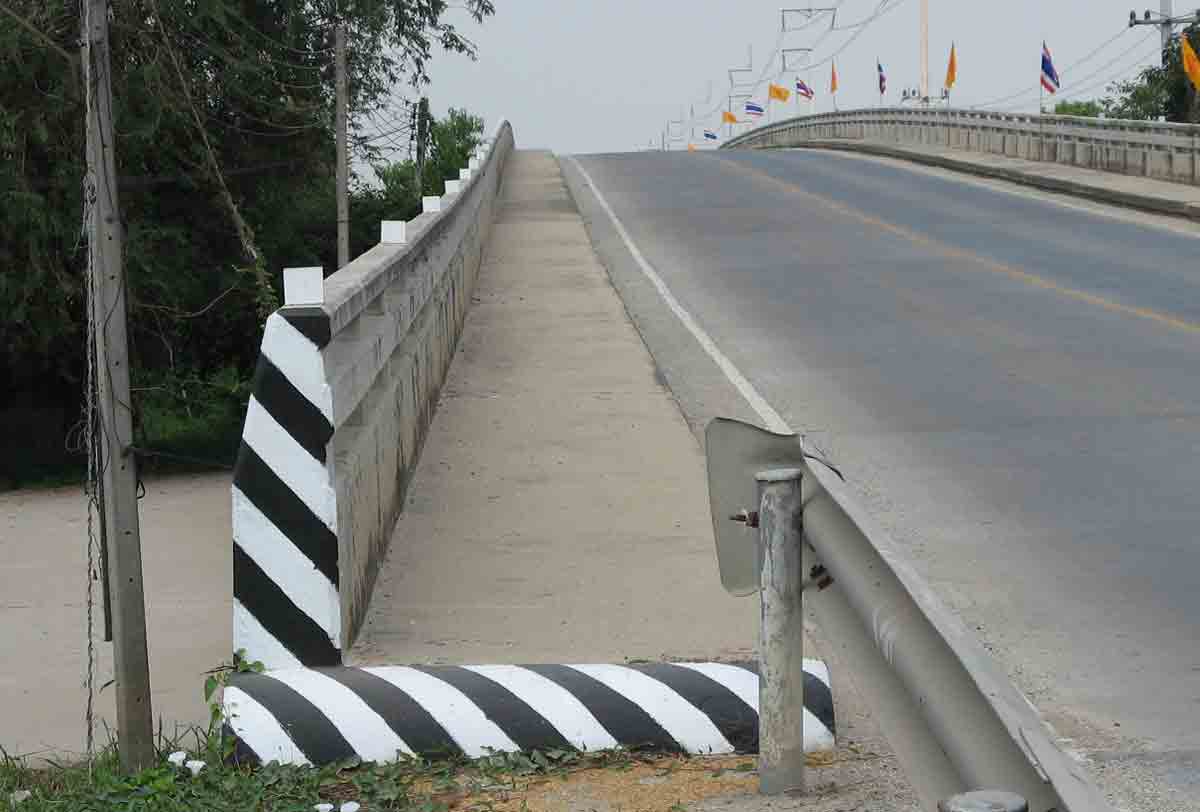
The Denmark case study shows how data can be integrated to create a more accurate picture of contributing factors to crashes.
Austroads, (2005), Australasian road safety handbook volume 3, Why we continue to under-count the road toll, Austroads, Sydney, Australia.
DETR (2001), A road safety good practice guide for highway authorities, DETR, London, United Kingdom.
Global Road Safety Facility GRSF (2009), Implementing the Recommendations of the World Report on Road Traffic Injury Prevention. Country guidelines for the Conduct of Road Safety Management Capacity Reviews and the Specification of Lead Agency Reforms, Investment Strategies and Safe System Projects, Global Road Safety Facility World Bank, Washington DC.
Global Road Safety Facility GRSF (2013), Road Safety Management Capacity Reviews and Safe System Projects, Global Road Safety Facility, World Bank, Washington, DC.
GRSP (2006), Helmets: a road safety manual for decision-makers and practitioners, WHO, Geneva, Switzerland.
GRSP (2007), Drinking and driving: a Road Safety Manual for Decision-makers and Practitioners, Global Road Safety Partnership, Geneva, Switzerland.
GRSP (2008), Speed management: a Road Safety Manual for Decision-Makers and Practitioners, GRSP, Geneva, Switzerland.
GRSP (2009), Seat-belts and child restraints: a road safety manual for decision-makers and practitioners, FIA Foundation for the Automobile and Society, London, United Kingdom.
IRTAD, (2011), Reporting on serious road traffic casualties: combining and using different data sources to improve understanding of non-fatal road traffic crashes, Organisation for Economic Co-operation and Development (OECD), Paris, France.
Mansfield, H Bunting, A, Martens, M & van der Horst, R (2008), Analysis of the On-the-Spot (OTS) road accident database. Road Safety Research Report 80, Department for Transport, London, United Kingdom.
OECD (2007), IRTAD special report: Underreporting of road traffic casualties, OECD, Paris. France.
OECD/ITF (2014) IRTAD Road Safety Annual Report 2014, Organisation for Economic Co-operation and Development (OECD), Paris, France.
Ruengsorn, D, Chadbunchachai, W, & Tanaboriboon, Y, (2001), Development of a GIS based Accident Database through trauma management system: the developing countries experiences, a case study of Khon Kaen, Thailand, Journal of the Eastern Asia Society for Transportation Studies, 4, 5, 293-308.
Thomas, P, Muhlrad, N, Hill, J, Yannis, G, Dupont, E, Martensen, H, Hermitte, T, Bos, N (2013) Final Project Report, Deliverable 0.1 of the EC FP7 project DaCoTA.
Turner, B & Hore-Lacy, W, (2010), Road safety engineering risk assessment part 3: review of best practice in road crash database and analysis system design, Austroads, Sydney, Australia.
United Nations Road Safety Collaboration (UNRSC), (2011), Global Plan for the Decade of Action for Road Safety 2011 – 2020, World Health Organization, Geneva.
Ward, H Lyons, R Thoreau, R (2006) Under-reporting of road casualties: phase I. Road Safety Research Report 69, Department for Transport, London, United Kingdom.
WHO (2010), Data systems: a road safety manual for decision-makers and practitioners, World Health Organization, Geneva, Switzerland.
WHO, (2013), Global Status Report on Road Safety 2013, World Health Organization, Geneva, Switzerland.
This chapter outlines the requirements for effective road safety performance and critical success factors for road safety work.
After a thorough analysis of the country’s road safety management system and the analysis of the major risk factors, it is advisable to develop action plans with defined targets at the country level and performance measures. To determine the success of a program, or the implementation of intervention, a review of performance outcomes is needed. Because not all countries are at the same performance levels, it is often advisable to start with demonstration or pilot projects. This is particularly true for LMIC, who would benefit from the learning and building of road safety expertise through these types fo projects.
Once a country recognises that it can no longer accept the level of death and serious injury occurring on its road network, the common first response is to adopt a target performance level with a supporting road safety strategy and plan (either a programme or a group of projects) to achieve that performance. The approaches to target setting, investment strategy and plan development of HICs are usually more developed and build upon a more established road safety programme than is feasible for most LMICs at the beginning of their road safety work. This is due primarily to the differences in road safety capacity available to HICs in comparison to LMICs. Another reason is the absence of reliable crash data for LICs. Investment strategies and plans with agreed targets need not only to be developed but also successfully implemented. This is a substantial challenge.
It is useful to consider goals or targets being developed for three timeframes — there are long-term goals, medium- and short-term targets. The setting of short and medium-term targets should always be considered as milestones on the journey to achieving the ultimate target of eliminating death and serious injury. Adoption of this long-term goal will shape actions planned and taken in the interim. The setting of quantified targets for these timeframes is discussed in Setting Targets. Within any timeframe, targets can be set for final outcomes (the usual measure), for intermediate outcomes and for institutional outputs as defined in The Road Safety Management System. These options are discussed further in Performance Indicators
The underlying objective for LMICs will be the development of capacity to manage road safety, through ‘learning by doing’. An important first step is identification of weaknesses within the road safety system (both for management and for risks on the network). This should be followed by adoption of a demonstration project – across the sectors – as an establishment investment phase to build technical and management knowledge. Adequate government commitment and funding will be critical.
This first step will enable informed later stage targets (for the medium and long-term timeframes) and strategies/actions (for the associated growth and consolidation investment phases) to be devised and implemented successfully, building – in the case of LMICs – on the roll-out across the country of the interventions piloted in the demonstration corridor, the implementation of key policy reviews carried out as part of the demonstration project, and the conduct of further reviews.
Funding and implementing a demonstration project (a multi-sectoral treatment of a corridor or urban area plus some key policy review activity) is the strongly recommended means to develop capability in whole-of-government road safety management for LMICs. It should be the initial action taken, following a road safety management capacity review.
For LMICs, a commitment to improving road safety outcomes may lead to an aspirational ‘top down’ target being adopted for the short-term (e.g. next five years) with recognition that delivery of that initial target will be most challenging. However, the prime focus must be on a demonstration project or projects.
To achieve good performance a strong linkage between road safety agencies and elected members and Ministers in a country is essential. Political commitment is required to lead a country’s efforts in addressing road safety and to contend institutional management functions.
A coordination framework that links road safety senior managers through executive management, across relevant sectors, to a group of ministers meeting regularly – which makes operational decisions at lower levels and formulates policy recommendations for, and reports on strategy performance to ministers – reflects the necessary systematic view of road transport operation and its professional and political challenges. Provision for public inquiry at parliamentary level and broad consultation arrangements with stakeholders, including special interest groups, are recommended.
Model Jurisdictions: Victoria, Japan, New Zealand, Norway, Western Australia, Sweden, The Netherlands.
Source: PIARC (2012).
Success in road safety work will not come overnight. The need to develop management capacity and implementation of interventions needs time. Bliss and Breen (2012) indicate that achieving results will require long-term political will that is translated into road safety investments that are targeted across a range of sectors and in governance and institutions, infrastructure, vehicle fleets, licensing standards, safety behaviours and the health system. Adequate lead time for the development of organisational and staff capability is needed.
Critical success factors (for HICs and LMICs) include:
A guide to assist nations in Africa to improve their road safety capacity in order to develop a national strategic road safety action plan is described in the case study below. The Association of Southeast Asian Nations (ASEAN) also highlights the need to build capacity.
A regular assessment of a country’s road safety management system is appropriate to consider the achieved results, the scope and quality of applied interventions, and the efficiency of institutional management capacity. Results will reflect the interventions introduced and the effectiveness of that set of interventions, as determined by the extent of critical supporting systems in place. This will include the commitment to funding; the extent of relevant legislation; and the level of deterrence in place, including enforcement and justice system support.
Source: PIARC (2012).
Key questions that need to be considered are:
Identifying Existing Network-level Crash Risks
Capacity to identify network-level crash risks is critically important. Countries face a variety of road safety challenges on their networks. HICs have high light passenger vehicle motorisation rates, while LMICs usually experience high two-wheeler motorisation rates, high roadside pedestrian volumes, and high proportions of heavy vehicles (trucks and buses) in the vehicle fleet.
Issues influencing comparative crash risks on networks in different countries include:
the levels of safe infrastructure provision | the mix of vehicle types using the network | the controls on drivers and vehicles entering and remaining on the network |
the safety levels of the vehicle fleet | the levels of road user compliance with the laws and road rules (respect for the rule of law) | the emergency medical management of crash victims |
Understanding the relationships between road safety performance and road safety conditions is a critical requirement for assessing underlying crash risk on the road network and in taking action to reduce the risks. Relevant aspects could be
An understanding of the scale of existing problems in a country requires availability of relevant data. A lack of data makes it difficult to have a consistent evidence-based approach to identify problems and implement specific countermeasures. Furthermore, good data systems are essential to measure the outcomes of implemented interventions. The value of extensive and accurate data being available has been demonstrated in Analysis and Use of Data to Improve Safety.
Examples for the assessment of relationships between road safety performance and road safety considerations are two European studies – SUNflower and SUNflower +6 – that provided insights into this relationship in various European countries (see Box 6.2).
The SUNflower study covered Sweden, UK and Netherlands. For these countries, relationships for safety performance and underlying conditions were assessed, e.g.
The assessment lead to factors that may have contributed to differences between road users or road types and between the countries. Many of the report recommendations have been implemented in the three countries, with positive results achieved.
The SUNflower +6 study additionally covered the Central European Countries Czech Republic, Hungary, Slovenia, and the South-European Countries Greece, Portugal and Spain.
Development of road safety in the three Central European countries varied considerably. Results reflected differences in national road safety management and enforcement strategies. In the South-European countries, vertical coordination of safety activities from central and regional to the local level was not well-developed. For some countries the identified changes were related to political changes (e.g. Portugal, Hungary, and the Czech Republic). Generally, an increase in motorized traffic resulted in a growing number of casualties. These growing numbers lead to increased attention on road safety, leading to new road safety policies and organizational measures and safety measures in the countries analyzed.
Source: Koornstra et. al., 2002; SWOV, 2005
Indications of the challenges faced in understanding network-level crash risks as illustrated in Figure 6.2.
 - Source: Eric Howard.")
Figure 6.2 Assessing risk on the network – major rural highways (Sri Lanka) - Source: Eric Howard.
This is just one example demonstrating the inherently unsafe condition of infrastructural conditions. In this case, the unrestricted access to the road from the roadside, and the overall poor level of management of road safety on this section of the road network poses risks. It is a situation which occurs in many countries across the world.
Target-setting can be based on the estimated outcomes of agreed action plans. Alternatively (and most commonly) targets can simply be aspirational in nature. Establishing a road safety target is a major opportunity to involve and inform the community about the road safety risks which exist in the community, the measures available to reduce the risks and to actively and openly seek the support for improved performance. There are two possibilities for target-setting – a top down declaration or a bottom up approach. A mix of these approaches is possible as well.
Top down target-setting, such as applying the Decade of Action 50% fatality reduction target for the period from 2011 to 2020 (see Typical Numerical Targets Adopted below), is much more likely to be applied in LMICs, as there is often little other evidence-based information on which to start their road safety journey. However, this aspirational approach can often lead to disappointing short-term and medium-term results.
Bottom-up target setting is based upon a negotiated set of strategic actions with a calculated (estimated) impact on fatalities and (serious) injuries. Prerequisite for this approach is good crash data, an understanding of the safety issues, knowledge of potential solutions and adequate resources. Thus targets that are more specific can be developed. Before target setting linkages between the administrative and the political level are often useful for discussion and resolution of potential implementation issues (often beyond transport impacts) that could otherwise block initiatives.
Whether the top down or bottom up approach is used to produce a target, this knowledge and experience will back strategy and action plan development and implementation. Either approach is capable of supporting improved road safety performance. However, until sufficient capacity to manage road safety is in place in a country, it is unlikely that a bottom up approach will be feasible. For this reason, Table 6.1 indicates that for the ‘establishment’ and early ‘growth’ investment phases a top down approach to target setting is likely to be the only feasible option for LMICs.

Table 6.3: Feasible target setting options
Some issues are relevant for target setting in most cases:
While LMICs could usefully base any short-term target they adopt on the five to ten year targets currently being adopted by good practice countries, there are major shortcomings in doing so:
Regional/state and local plans and targets should reflect the adopted national approach, with variations for local circumstance and intent. In this way, a more consistent understanding by the community, road safety practitioners, and politicians at various levels of government can be established. However, target-setting at the local level (as distinct from the regional/state level) is likely to be problematic as the data, resources and level of expertise are generally not readily available. Therefore, national or state targets are often adopted, that is why national plans should provide sufficient flexibility for local preferences and priorities to be identified and expressed in local plans.
Case Studies – Target-setting
Contained below are a number of case studies on target setting:
A bottom up approach to interim target-setting was followed in the state of Western Australia
Top down or aspirational target-setting is the most widely used method – and it is the only feasible approach which can be used in the establishment phase. It can also be used effectively for the growth and consolidation phases. For example, Sweden operates a mix of top down and bottom up approaches to interim road safety target-setting.
Typical Numerical Targets Adopted – Examples
Road safety targets need to be quantitative and measurable so that the level of aspiration is clear, the extent to which the target has been achieved can be determined, and if it has not been achieved, then the extent to which the result is short of the target can be measured.
Quantified road safety targets have been set in a number of regions (see Key Developments in Road Safety,) and countries in recent decades, including Finland, France, The Netherlands, Sweden, the United Kingdom, Australia, New Zealand, Ireland and the United States.
Example Indonesia: targets and policy actions expressed in the National Road Safety Master Plan 2011-2035 (Republic of Indonesia) are:
In addition to final outcome targets for overall fatalities and serious injuries being defined in a strategy, outcome targets can be set for different at-risk road user groups and for various risk categories under the Safe System pillars.
For example, the current New Zealand Safer Journeys 2010–2020 Strategy (Ministry of Transport, 2010) targets a 40% reduction in the fatality rate of young people and a 20% reduction in fatalities resulting from crashes involving drug or alcohol impaired drivers, as shown in Table 6.2.
| Target focus | Target reduction | Target focus | Target reduction |
|---|---|---|---|
Increase the safety of young drivers | Reduce the road fatality rate of young people from 21 per 100 000 population to a rate similar to that of young Australians of 13 per 100 000 | Achieve safer walking and cycling | Achieve a reduction in the crash risk for pedestrians and particularly cyclists, while at the same time encouraging an increase in use of these modes through safer road infrastructure |
Reduce alcohol/drug impaired driving | Reduce the level of fatalities caused by drink and/or drugged driving, currently 28 deaths per one million population, to a rate similar to that in Australia of 22 deaths per one million population | Improve the safety of heavy vehicles | Reduce the number of serious crashes involving heavy vehicles |
Achieve safer roads and roadsides | Significantly reduce the crash risk on New Zealand’s high-risk routes | Reduce the impact of fatigue and address distraction | Make management of driver distraction and fatigue a habitual part of what it is to be a safe and competent driver |
Achieve safer speeds | Significantly reduce the impact of speed on crashes by reducing the number of crashes attributed to speeding and driving too fast for the conditions | Reduce the impact of high risk drivers | Reduce the number of repeat alcohol and speed offenders and incidents of illegal street racing |
Increase the safety of motorcycling | Reduce the road fatality rate of motorcycle and moped riders from 12 per 100 000 population to a rate similar to that of the best performing Australian state, Victoria, which is 8 per 100 000 | Increase the level of restraint use | Achieve a correct use and fitting rate of 90% for child restraints and make the use of booster seats the norm for children aged 5 to 10 |
Improve the safety of the light vehicle fleet | Have more new vehicles enter the country with the latest safety features. The average age of the New Zealand light vehicle fleet will also be reduced from over 12 years old to a level similar to that of Australia, which is 10 years | Increase the safety of older New Zealanders | Reduce the road fatality rate of older New Zealanders from 15 per 100 000 population to a rate similar to that of older Australians of 11 per 100 000 |
Final outcome, intermediate outcome or output targets can also be devised at an organisational (road safety agency) level, compared to an overall target for final outcomes across the country – which are to be achieved as a consequence of all agency contributions.
It is most useful for all organisations to have their own strategic plan, actions and targets, based on the jurisdiction’s overall strategy. The agency strategy should indicate, in as measurable a manner as possible, how and what they intend to achieve with their own activities to meet their obligations as part of the overall country target.
Both strategies and actions are investment plans. However, Austroads (2013) notes that there is a considerable difference between countries as to what is included in a strategy document and what is included in action plans. It notes that one key point of difference is the level of detail on specific measures. Some include greater detail within the strategy, some leave detail to the action plans, while others provide detail for the initial period of the strategy (e.g. the first two years), but rely on action plans (reviewed perhaps every two years) to supply detail for later stages of the strategy. It concludes that there is no answer as to which is the best approach on this issue. The important point is that the strategy should allow enough flexibility to address any specific problems that arise as the strategy unfolds (for instance, in light of new information on potential problem groups), changes in the political environment (including changes in funding or priorities), or with the emergence of new techniques with which to address risk.
Investment strategies and actions need to be adopted to support improved road safety performance and the achievement of targets – in the short-term (one to three years), the medium-term (three to ten years) as well as in the long-term (beyond ten years). For LMICs, steady progress through demonstration projects is the recommended option for the short-term, with or without an aspirational (notional) short-term target.
For both LMICs and HICs, thoughtful investment plans and strategies will be essential to achieve steady progress towards medium-term targets and eventually to move further towards the ultimate long-term goal (see The Road Safety Management System). An understanding of the relationship between investment phases and strategy timeframes is necessary.
.")
Figure 6.3 The phases of investment strategy: World Bank Guidelines, 2009 Source: Adapted from Mulder and Wegman (1999).
The establishment (short-term timeframe) phase of road safety investment planning focuses on building core capacity to enable effective targeted road safety performance to begin and grow. The two key purposes of activity in this phase should be:
Tasks to be accomplished in this phase may include development and implementation of necessary data systems, tools and guidelines and a strengthened legislation to be in place in time to support later implementation phases.
In the growth (medium-term timeframe) investment phase, key priorities are:
In the consolidation (long-term) investment phase, key priorities are
As stated above, action plans and investment plans can deal with different timeframes (short-term, medium-term, long-term). However, a definition of some aspects is essential, as they are important for the success of the plans in any timescale:
The challenge in LMICs is to achieve the preconditions necessary to deliver the planned outcomes. This usually requires a number of years of effort. Road safety improvement is a continuous process requiring ongoing commitment.
For all countries, in the establishment phase, there are known interventions, which if implemented effectively, will deliver results (see Intervention Selection and Prioritisation). These interventions include:
These recommended measures are applicable to all countries. However, there are further measures which would be relevant in targeting improved safety in LMICs. These measures include:
Apart from such interventions, accompanying tasks may be necessary to support road safety performance, especially in LMICs. In LMICs, demonstration projects and other means, including ongoing strengthening of existing road safety activities and the development of digital data systems for licensing and offence records (and their linkage) will be a challenging, but rewarding process. Improvements to public sector governance and the implementation of the supportive, enabling systems necessary to underpin good public policy and good road safety performance, will take considerable focused effort over a number of years.
These are substantial challenges. This is not to discourage immediate action, but there needs to be a realistic sense of what can be achieved in the short-term. This will depend heavily upon:
It is also vital that actions which increase road crash risks are not taken, even if the outcome is unintended. Box 6.5 details the unanticipated impact of resurfacing of roads leading to higher travel speeds and therefore increased fatalities in the former East Germany before remediation measures were taken.
An early action reflected the lack of available knowledge. A programme of new asphalt resurfacing of existing roads without corresponding safety mitigation measures resulted in increased speeds and greater numbers of fatalities. Time was required to identify appropriate road safety actions. Within a few years road safety success was eventually achieved, with a reduction of 72% in severe accidents and 81% in fatalities within 20 years in a sustainable way.
Source: Wenk & Vollpracht (2013).
For the growth and consolidation phases of investment, development of comprehensive strategies and action plans will be necessary and there will be capacity available by then to build meaningful proposals which can be fully assessed for their likely contribution to proposed targets. In the later part of the growth phase and beyond, the estimated aggregate impact of implementable actions can be utilised to provide a target (see Setting Targets).
In this phase developed capacity data, tools and knowledge have to be available to
In HICs and LMICs there will be many potential interventions which can be applied in the growth phase and beyond. Later chapters address road safety engineering interventions in detail (see Intervention Selection and Prioritisation), and other interventions (such as improved road user behaviour through legislation, enforcement, and licensing; improved vehicle standards; and improved post-crash care) are also important.
Interventions (i.e. countermeasures) to address the identified risks in the growth and consolidation investment phases can be developed based on evidence from demonstration projects and other jurisdictions, as well as from research. The Austroads Guide to Road Safety Part 2 (2013) provides a conceptual framework for countermeasure selection, based on the Safe System approach, and sets out steps for:
After setting targets, developing action and investment plans and the implementation of interventions it is of utmost importance to review the performance. Intermediate outcomes (performance indicators) (OECD, 2008) are valuable in predicting final outcomes (see also The Road Safety Management System and Effective Management and Use of Safety Data).
A number of possible intermediate outcome measures are specified in those chapters, for example, seatbelt wearing rates or speed monitoring. For LMICs e.g. truck rear lighting operational rates, wrong-way vehicle travel rates, proportion of length of high pedestrian areas with footpaths, rate of provision of raised speed reduction devices with highly visible advanced signage at pedestrian crossings on arterial roads in urban areas, and more can be mentioned.
One option (Austroads, 2013) to link these measures to adopted targets is to develop an ‘outcome management’ framework which directly links the outputs from the strategy (i.e. what will be done) with outcomes (i.e. what is to be achieved). This is a useful approach which focuses attention on key outcomes, encourages modelling of effectiveness of outputs on final and intermediate outcomes achieved, and assists in the monitoring process.
Establishing road safety targets and investment strategies and plans is complex, requiring
As recommended in Institutional Management Functions in Management System Framework and Tools, the first step for LMICs in establishing their road safety activity (their establishment investment phase) will be to prepare demonstration projects rather than embark on ambitious national road safety plans and aspirational targets which are more appropriate for the growth investment phase in the medium-term. Box 6.6 outlines the high-level objectives of Safe System demonstration projects.
Source: GRSF(2013).
It is important to note that a demonstration project must be carefully adapted to each country. Even though the project will generate expertise, it is vitally important to prepare an ongoing programme for future actions, based on each country’s capacity.
For HICs, demonstration projects across road safety agencies that trial innovative treatments can also be an effective way to prepare for wider roll-out. It can strengthen institutional leadership and capacity, including knowledge and delivery partnerships. Projects of this nature provide a focused opportunity; for example, the chance to trial and embed Safe System approaches within new strategies and within the practices of the road safety agencies.
Road Safety demonstration projects could be multi-sectoral activities on selected road corridors or in specific urban areas, and they could also include selected jurisdiction-wide road safety policy reviews. All require coordinated action, by and across the road safety agencies, but with projects at a smaller and more manageable scale than for the complete country or for all potential policy reviews. Note that the term ‘demonstration project’ is sometimes used to describe a small-scale trial of a specific treatment type (e.g. a new innovative treatment). Advice on these and other lower cost approaches is provided elsewhere in this manual (see from Infrastructure Safety Management: Policies, Standards, Guidelines and Tools).
Capacity needs to be progressively developed, with coordination and decision-making mechanisms agreed to between the road safety agencies, and then successfully introduced and experienced on a day-to-day basis. Links up to decision-making at the political level (between Ministers) need to be achieved. In this environment of unavoidably slower development of understanding and capacity, most benefit will be derived by ‘learning by doing’. The key deliverable would be improved capacity of the country’s road safety agencies to deliver road safety improvement. It would also provide a clear message to the community that improved performance is achievable.
Coordinated on-road corridor treatments of demonstration projects can be:
Separate from those corridor actions policy development components of demonstration projects (separate from the corridor actions) will usually include some of the following:
The resourcing, guidance and persistence needed to achieve even small changes in approach by the agencies will be substantial. Experience has shown that the level of effort required for this is consistently under estimated and under-resourced. The measurement (both baseline and ongoing) and monitoring of intermediate outcome performance is an essential component of demonstration project activity and is important for the later phases of broader road safety activity.
While detailed digital crash record databases may not be in place, the level of overall fatalities can be collated from local police records and hospital records for the demonstration project corridor activity, and usually (with effort) for a larger area. The country would then be in a position to assemble the evidence base to assess demonstration project benefits and this would support a broad roll-out programme for the subsequent medium term or growth phase.
Detailed project objectives and project components for a road safety demonstration project, drawn from recommendations for the establishment phase arising from a typical recent World Bank road safety management capacity review, are set out in Table 6.3 and Table 6.4.
| 1 | Strengthen road safety management capacity in Country A to deliver a demonstration project. Establish road safety decision-making arrangements at executive and working group level of the key agencies, and consultation arrangements with stakeholder groups/experts |
|---|---|
| 2 | Designate a lead agency to conduct the demonstration project and specify its formal objectives, functions and resourcing requirements. This will include a small road safety cell to provide advice and secretariat services to the coordinated decision-making of project partners. |
| 3 | Develop and implement interventions by the sectors in a selected corridor. Monitor and measure changes in road safety performance. |
| 4 | Identify and conduct selected policy reviews to address key road safety priorities. Make recommendations to improve road safety results. |
| 5 | Accelerate road safety knowledge transfer to strategic partners. |
These five objectives are interrelated and mutually reinforcing. The aim is to create a joint project which encourages agencies to work together constructively to: deliver (and then evaluate) a set of well-targeted, good practice interventions across the sectors in identified higher-risk corridor(s); conduct further policy reviews; and accelerate road safety knowledge transfer. It is anticipated that the road safety demonstration project may typically cost around US $20 million (and at least $10 million as a minimum), have four major components and be implemented over a four year timeframe (see Table 6.4).
| Component | Typical US $m. | |
|---|---|---|
| 1 | A resourced project executive committee to lead and manage components 2,3 and 4 | |
| 2 | Interventions in high-risk, high-volume demonstration corridors (urban and rural sections) with monitoring and evaluation systems in place. | 19.0 |
| 3 | Policy reviews of road safety priorities, e.g. from projects such as driver licensing standards; heavy vehicle safety; safe infrastructure design, operation, management standards and principles; crash investigation capability strengthening for Police; developing road safety research capability; penalty frameworks for offences | 0.4 |
| 4 | Building knowledge through technical assistance, study tours to other countries, and a fully resourced road safety group (or cell) | 0.6 |
| TOTAL | 20.0 | |
The recommended scale of demonstration projects is around this amount and timescale because minor funding is unlikely to realise benefits described earlier in this section. The substantial change in the management of road safety from individual agency ‘best efforts’ to a coordinated and well led whole-of-government management approach, which builds the skills necessary to manage a whole of country improvement, requires significant investment and leadership. Governments and funding agencies need to recognise this requirement. An example of a demonstration project is provided in the Kerala, India case study
Austroads, (2013) Guide to Road Safety Part 2: Road Safety Strategy and Evaluation, Austroads, Sydney, Australia.
Bliss T & Breen J (2012), Meeting the management challenges of the Decade of Action for Road Safety, IATSS Research 35 (2012) 48–55
Bliss T & Breen, J (2013), Road Safety Management Capacity Reviews and Safe System Projects, Global Road Safety Facility, World Bank, Washington, DC.
Global Road Safety Facility (GRSF) (2009), Implementing the Recommendations of the World Report on Road Traffic Injury Prevention. Country guidelines for the Conduct of Road Safety Management Capacity Reviews and the Specification of Lead Agency Reforms, Investment Strategies and Safe System Projects, by Bliss T & Breen J; World Bank Global Road Safety Facility, Washington DC.
Global Road Safety Facility (GRSF) (2013), Road Safety Management Capacity Reviews and Safe System Projects, by Bliss T & Breen J; World Bank, Washington, DC.
Koornstra M, Lynam D, Nilsson G, Noordzij P, Pettersson HE, Wegman F & Wouters P (2002), SUNflower: a comparative study of the development of road safety in Sweden, the United Kingdom, and the Netherlands. SWOV, Dutch Institute for Road Safety Research, Leidschendam.
MUARC, (2008), Development of a New Road Safety Strategy for Western Australia, 2008 – 2020, Report No. 282, Corben B, Johnston I, Vulcan P, Logan D.
Mulder, J & Wegman, F, (1999), A trail to a safer country, PIARC XXIst World Road Congress, Kuala Lumpur, SWOV, Leidschendam, Netherlands.
New Zealand Ministry of Transport, (2010), Safer Journeys 2010–2020 Strategy, New Zealand Ministry of Transport, Wellington, New Zealand.
OECD (2008), Towards Zero: Achieving Ambitious Road Safety Targets Through a Safe System Approach, OECD, Paris, France.
PIARC (2012), Comparison of National Road Safety Policies and Plans, PIARC Technical Committee C.2 Safer Road Operations, Report 2012R31EN, The World Road Association, Paris.
Republic of Indonesia, (2011) National Road Safety Master Plan 2011-2035,
Road Safety Authority, (2013), Road Safety Strategy, 2013—2020, Government of Ireland, http://www.rsa.ie/Documents/About%20Us/RSA_STRATEGY_2013-2020%20.pdf
SWOV, (2005), SUNflower+6; A comparative study of the development of road safety inthe SUNflower+6 countries: Final report, Wegman F, Eksler V, Hayes S, Lynam D, Morsink P, and Oppe S.
Wenk, S & Vollpracht, H (2013), A comprehensive approach for road safety exemplified by the State of Brandenburg 1991-2012, World Road Association (PIARC), Routes/Roads 360, 88-93.