
Part III "Planning, Design & Operation" demonstrates the safety impacts and value created by adopting the global strategies

Responsibilities of a road authority include safe road design for new roads, safety improvements of existing roads, safer outcomes from road maintenance and network operation activities. Actions need to be undertaken within the whole-of-government road safety efforts. These activities need to be conducted within a Safe System framework, a transforming safety agenda that will influence all the activities of a road authority, not just those activities traditionally considered to be the functions of a road authority’s safety division. It challenges road authorities to rethink their activities. This is a major challenge for every road authority – how to build Safe System principles and elements into all of its activities.
Case 1. In some jurisdictions, the road authority will be the lead road safety agency, particularly where the authority is also responsible for traffic management, driver licensing and vehicle registration.
Case 2. However, in many instances, the road authority will have reduced responsibilities and will not be the lead agency.
What can we do in such case? In this situation it will need to rely more heavily on the cooperation of other stakeholders to achieve the desired safety outcomes. In all cases, road authorities need to have a strong external focus to achieve gains in other Safe System elements that are outside their normal areas of operation.
Key stakeholders include:
This cooperative role requires strengthened knowledge and new skills in outreach and communication because it is necessary to work with others outside of one’s typical profession.
The focus in this chapter is on embedding the Safe System approach within the responsibilities, (planning, policies, programmes and operational activities) of the road authority in a jurisdiction, particularly the identification of necessary changes, their progressive introduction and their ongoing application. It is important to recognize change is necessary to achieve the safe system approach and it is important to consider the steps necessary to achieve this overall goal. It is also important to recognise that the level of effort may vary depending on the will of the decision makers responsible for providing resources to the effort.
STEP 1: gathering and collecting information on the existing system
The starting point should be mapping the alignment of existing functions and responsibilities of the road and other safety authorities participating in the effort to implement the Safe System principles. This will produce an understanding of the extent of alteration required to align the activities of all authorities. This adjustment will have to be substantial and will need to take place progressively as understanding and experience with application of principles increases.
STEP 2: consultation and discussion
Effective change management strategies are supported by corporate-wide processes for input, consultation and discussion. A strategic framework with clear objectives needs to be put in place and progressively strengthened with policies and guidelines as knowledge increases. All changes will need to include a continuous improvement and feedback process to refine and identify necessary adjustment to current approaches and priorities in all areas of the authority’s activity.
STEP 3: institutionalization and formalization
The new approach will need to be fully embedded in the road network management approach of the road authority and formalisation of this positioning is recommended in time. Regular assessment of the coverage and effectiveness of this ‘embedding’ activity will be needed.
FUNDING POINTS:
Relevant legislation and regulations will prescribe the functions and responsibilities of a road authority in a country. While the nature and extent of these responsibilities varies from country to country, it will usually encompass planning and construction for major new road projects, safety, asset management, traffic management, road maintenance, and of way and abutting development regulation, to varying degrees. The responsibility for the setting of speed limits on all roads, or perhaps just for national or state roads, while issuing guidance for speed limits and design standards on local roads is likely to rest with national or state road authorities. However, this is less likely to be the situation in a number of LMICs.
As a basic starting point, the legal obligations of a road authority for safe operation of its network will require risk management systems and procedures to be in place that:
As an example, road authorities may have a duty of care to identify, assess and prioritise risks, and take reasonable measures to address them. This obligation typically covers all road users (including pedestrians, bicyclist, and emerging mobility devices), and covers the full road reserve (i.e. including roads and roadsides).
However, countries will have varying legislative and regulatory responsibilities setting out safety requirements that are binding upon their road authorities.

A priority safety focus for road authorities will include infrastructure safety, land use and access control from land abutting road reservations and speed limit setting, the Safe System approach requires all the elements affecting safety on the network to be taken into account by the road authority when discharging its responsibilities.
This can be complicated in situations where responsibilities are divided or separated between departments. Examples of this may include the setting of speed limits, traffic management planning and the management of heavy vehicle operation. These functions may be carried out by a different department to the road authority (e.g. Department of Transport or Police). In these instances, there is the challenge of reaching agreement with other departments about consistent practice.
It is recommended wherever possible that these responsibilities be made part of a road authority’s role. If this cannot be achieved, the road authority must be given powers to be involved (with their agreement) in establishing guidelines and standards which will be applied for these responsibilities.
All of these matters are associated with safe operation and use of the network. These operational characteristics are a key determinant of the level of crash risk experienced on the network. Considerably more active coordination effort than usual will be necessary for the agencies to achieve effective safety outcomes in these ‘separated responsibility’ situations.
The road authority has an obligation to support achievement of:
Road authorities need to work with local police and provincial and local governments to explain the importance of their roles in achieving safe operation of the road network. They need to support and encourage police action in achieving compliance with speed limits, but also for seatbelt and helmet wearing, pedestrian priority on crossings, safe overtaking, observing traffic controls at intersections, safe heavy vehicle operation and minimising impaired driving.
The Road Safety Policies Team: Within a road authority exists a group of professionals with accountability for initiating road safety policy and guideline development (usually a road safety engineering team or section) and for making relevant recommendations to the senior corporate group which carries a considerable responsibility. Such a Group needs to be prepared to put forward policy positions that would reduce crash risk on the network, while recognising that this will impact upon traditional approaches.
The Road Safety Engineering Team: Other parts of the organisation (maintenance, design, asset management, traffic management) will need to be consulted and engaged in order to assist the change in thinking necessary for gaining corporate support for changing their activities. This is a substantial task – shifting the traditional approach taken to building and maintenance of roads – in order to win the understanding and acceptance of the need for retrofitting work on road networks to change crash risk profiles over time. A road safety engineering team within a road authority should be capable of operating as a centre of expertise to support the roll-out of road safety knowledge and programmes across the regions and, as appropriate, within head office functions.
Expertise will be needed to carry out a number of key functions including:

Local governments will need support in introducing Safe System principles, and will also contribute input about how Safe System treatments can be more effectively implemented. The importance of the role of local government is illustrated by the example of Indonesia where recent data suggests that more than 70% of road crash fatalities occur on provincial and local roads and streets, not national highways.
In addition, local governments have land use planning responsibilities to control the nature of new development, access to road reserves, and prevention of illegal development. They also have roadside management responsibilities to control the unsafe effects of roadside activities. These powers often apply to national roads in LMICs.
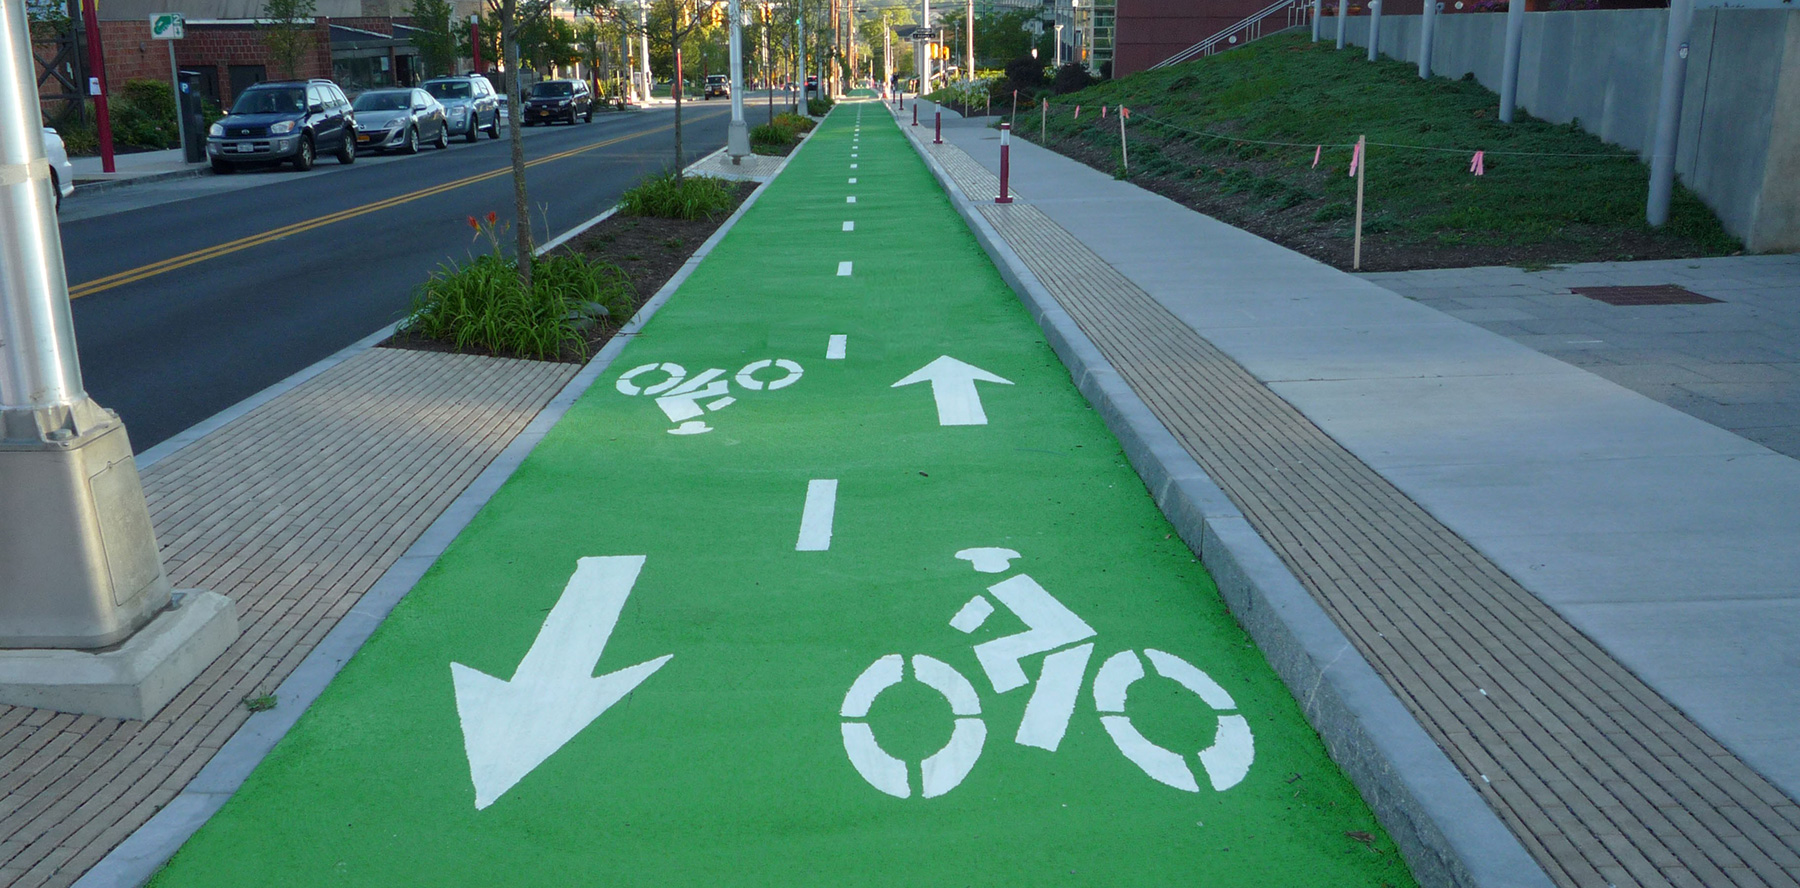
It is often the role of local government, for example, to provide footpaths abutting new road developments or existing roads. There is a need to consider pedestrian safety issues as well as motorised road user and cyclist safety. Policies need to be devised and adopted for safe movement of pedestrians along and across roads and for potential treatments at higher-risk locations. Funding arrangements need to be resolved to ensure pedestrian facilities are in place or provided.
Simple tools to support improvement of knowledge and capacity at the provincial and local levels will be needed, as will adequate funding, although funding arrangements are usually complex and specific to each jurisdiction.
Safe System introduction is likely, over time, to lead to fundamental change in an authority’s approach and programmes. Cost-effective safety interventions and investment will become a more substantial component within new projects and maintenance and reconstruction works, and will also support improved worksite safety management. For all LMICs, understanding and identification of higher crash risk issues (e.g. through application of proactive network risk assessment programmes and blackspot analysis) will increase demand for implementation of treatments. Allocations for road safety funding within annual budgets in order to respond to these demands will increasingly emerge. Without funding commitment by government (supported by innovative safety programme business case submissions from the road authority), nothing will change.
Increased funding for safety projects will require linkage to new safety-related corporate KPIs whose measurement will enable management of effectiveness to occur. Box 7.1 illustrates an approach to introducing funding of Safe System treatments.
Road safety in Sweden is mostly funded by government and through general revenue distributed to the lead agency – now the Swedish Transport Administration (STA) – and other sectors. In 1999, funding to the lead agency was doubled with a total of SEK 8.5 billion ($US 1.25 billion) to be made available for road safety over 10 years. An increased and earmarked allocation was made to allow resources for physical road safety measures such as roads with median guardrails, safer intersections and safer road shoulders. Road safety engineering is being increasingly brought into the mainstream of infrastructure development and asset management.
Obtaining Safety Funding from other Administrations - Opportunities for obtaining targeted funding for road safety investment (e.g. infrastructure safety works, additional enforcement, public campaigns, and conferences and seminars) need to be pursued by all agencies, especially health and road authorities given the relatively high cost of infrastructure provision and implications of crash outcomes on the health system.
How to Obtain Safety Dedicated Funding - Obtaining adequate safety funding is a leading responsibility for a road authority. Revenue sources such as from the introduction of more efficient enforcement mechanisms (automated enforcement) for the collection of traffic fines and injury insurer contributions on the basis of achieving a satisfactory rate of economic return on investment through lower claims experience, warrant particular attention. In some countries such as Australia, Canada and Sweden, the injury insurers fund major advertising, research and enforcement programmes and revenue from traffic infringements (Australia and France) funds major infrastructure programmes.
The goal of The Safe System Approach is that the infrastructure and road environment support a safe outcome for all road users when they make errors, and do so by taking into account human crash thresholds.
Policies, guidelines and programmes need to be developed to ensure progressive advancement towards a network embodying Safe System principles and outcomes. The progressive adoption of Safe System goals and strategies within the operational practice of road authorities requires considerable investment in knowledge, skills, policy and guideline development, both by the road authority as an entity and by individual staff.
More road authorities are recognising the major implications that adoption of a Safe System has. The role of the road authority is to provide a safe network that will require the progressive reduction of the traditional trade-offs that have historically been made between safety on the one hand, and mobility and access on the other. Rather than trade-offs, ‘win-win’ outcomes are required and need to be planned over time.
Support for infrastructure safety investment in order to achieve non-fatal crash risk conditions across the network (the spirit of the Safe System Approach) will become the priority. This is likely to result in substantial increases in the influence of the safety-focused infrastructure compared to other road safety programmes.
An Example: A comparison from Sweden between the Safe System/Vision Zero approach and a traditional road safety approach as presented in Table 7.1 is instructive.
.")
Table 7.1: The Safe System paradigm shift - Source: Based on presentation: Vision Zero – a road safety policy innovation (Belin, Tillgren & Vedung, 2012).
A New Safe System Focus for Programmes and Projects
Road authorities (and all road safety agencies) have to recognise that the framework for understanding and managing crash risk has to be thoroughly rethought. Existing knowledge of the new framework and responsibilities for determining and responding to crash risk in many LMICs is inadequate.
As an illustration of authorities recognising the need to make this major adjustment, and in doing so, Slovenian road safety authorities (Zajc, 2014) express their new approach as shown in Box 7.2.
The driver was treated like a potential delinquent.
Now: The traffic system must accommodate the driver.
The driver is a victim of the traffic system because she/he has a limited capability for processing all traffic information. The system must be simple so that the driver makes less mistakes. When the driver makes mistakes the system must forgive him and reduce the consequences.
Source: Zajc (2014).
On the other hand, an indicative example of the lack of adequate understanding of crash risk and appropriate good practice responses within the activities of two road authorities is set out in Box 7.3.
Discussions as part of a road safety capacity review were held with the national road authority in a south-eastern European country in 2008 to ascertain, among other issues, why barrier linemarking on a particularly mountainous national road, with a high proportion of truck traffic, was only in place for some 50% of the length required by international overtaking sight distance standards. The response of the authority was that ‘if the full barrier linemarking were to be installed to meet the safety standards, it would mean overtaking opportunities would be very limited’. This trade-off between safety and amenity (or ‘efficiency’ as some would consider it) was not transparent . There had been no community debate about serious crash risk versus faster journey times. It is an all too common example of safety not being fully supported or being covertly traded-off for other purposes in the past.
The approach adopted in Argentina to implement a Safe System focus is explained in the following case study..

© ARRB Group
Implementing Safe System principles on major new road projects and, particularly, delivering improvement in the safety levels of the existing network over time will require, among other measures, adequate controls on roadside access and roadside activity to be put in place. Necessary powers and government actions to regulate abutting land use development and roadside activities on existing roads for this purpose will be required.
Road authorities and local Governments: Processes to assess the safety impact of any proposed land use development need to be established between the road authority and local governments. Potential safety issues need to be identified, and a range of responses developed as potential development conditions in order to minimise future harm. These processes need to be given authority within land use planning and local government legislation.
Favouring Legislation: Laws to support improved compliance by the public with the decisions of the road authority/local government in these matters will be required, and these need to be enforced. Consideration is required of incentives to be introduced to encourage local government to adhere to their land use planning policies. It is most important that the stakeholders understand and accept the need for legislation to control this development and that the road authority:
Box 7.4 sets out a discussion that addresses a number of highly relevant safety concerns in many LMICs for so-called linear settlements. These common situations reflect inadequate public administration powers (or their lack of application), leading to highly unsafe road environments especially for vulnerable road users.
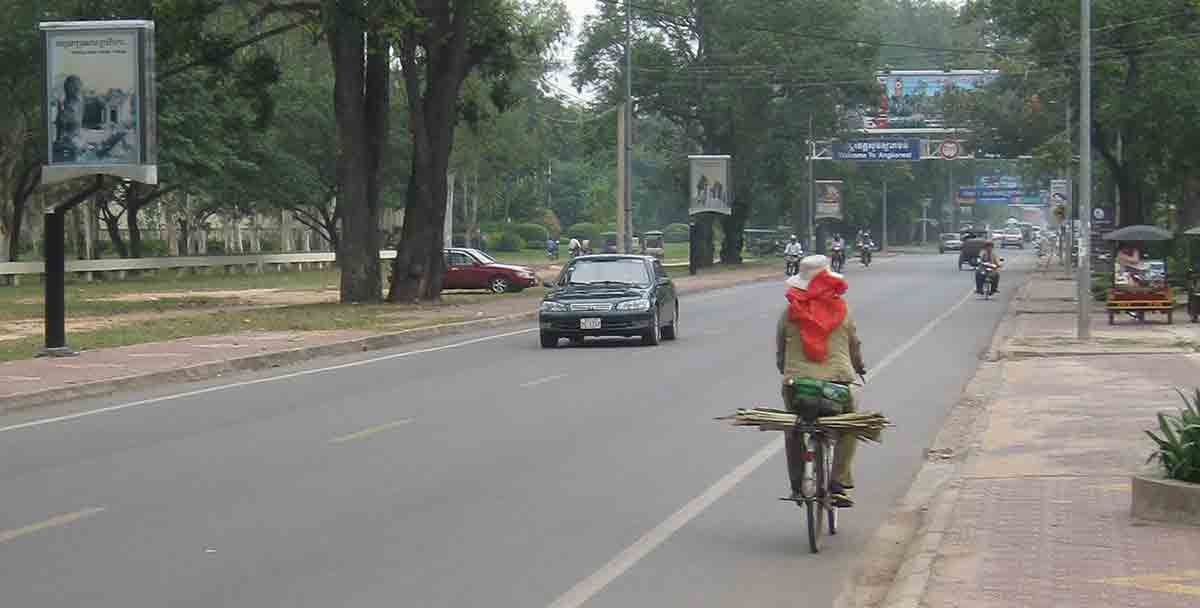
A major factor in road fatalities in LMICs is vulnerable road users on roads abutting so-called linear settlements. Here, the lack of access control and poorly conceived investment strategies for road networks (and for the development of communities) has resulted in mixed functions with residential and business along the country’s main arterial roads, with heavy, high-speed traffic activity. These ‘coffin roads’ are well-known examples of the problems with linear settlements on busy upgraded roads and occur in many LMICs.
Vulnerable road users are not the only ones at serious risk. Poorly planned U-turn provision or inadequate physical restrictions on U-turns along LMIC highways are a major cause of serious casualty crashes, especially among the passengers of public transport mini buses (e.g. in Egypt). These U-turn gaps and permitted operations are a disaster for road safety. This is a deeply embedded characteristic of the road network in LMICs and requires action across many road authorities in achieving adequate local government development planning to support safe road -of-way management.
Measures required based on good HIC practice include:
Source: Adapted from Vollpracht (2010).
Linear settlement roads result in unsafe conditions, with pedestrians and vehicles entering and exiting the road from each (continuously) abutting property frontage. Safe System principles indicate that each property entry to a roadway functions as a minor intersection, with the possibility of -angle crashes involving vehicles entering or leaving the carriageway colliding with vehicles travelling along the road. These situations compromise efforts in many jurisdictions to devise a consistent road classification system applying along lengths of road. A further example highlighting solutions for addressing linear settlements is provided in Box 7.5.
A strategy to address these risks was proposed with two components:
1. An express road system with a 2 + 1 lane cross-section bypassing villages and towns can nearly halve the price for motorways and will be sufficient for traffic volumes up to 20,000 vehicles/day. So the main and safe arterials in Republika Srpska can be built up much earlier than the planned motorway system. They can be widened later, as soon as the traffic volume needs a second carriageway.
2. Adapt the existing main and regional roads within linear settlements to a mixed use function by traffic calming and providing safety for non-motorised users.
Source: Kostic et al. (2013)
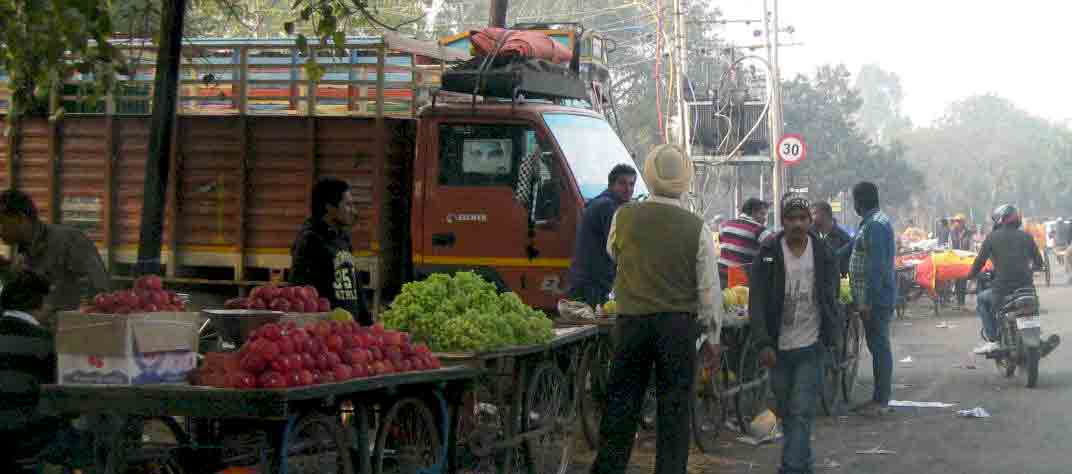
As outlined above, unauthorised activities carried out on the roadsides, especially on heavily trafficked routes, need to be regulated and managed to minimise adverse safety impacts for road users. This is an area of considerable weakness in many LMICs, with traders and vendors occupying the road reserve, setting up goods and stalls. In urban areas, traders’ goods and itinerant vendors take over the footpaths, forcing pedestrians to use the road for walking. There is often little management of this unauthorised use by the local government authorities or the police. It is a major challenge for road authorities to obtain the attention of government and gain their support to change the situation. However, there are successful examples in LMICs of local governments negotiating relocations of street vendors to public market spaces, re-established away from the main roads to improve safety.

© ARRB Group
Adoption of an increasingly safety sensitive road classification for the network that better matches road function, speed limit, layout and design is an important aspiration. As noted above, linear urban development is a characteristic of most LMICs and tends to confound this classification approach. Planning to progress toward the long-term goal of segregation of road use functions and improvement in operating safety is important for Safe System adoption. Suitable planning can guide future road investment (for example in provision of bypass roads) and the associated safety retrofitting of existing roads for their access or distributor functions.
As indicated earlier (see Safe System : Scientific Safety Principles and their Application), the Sustainable Safety approach from the Netherlands places a heavy emphasis on a strong road classification system. Road functionality is embedded in the approach, and it is suggested that roads should have a single function, whether this be as through roads, distributor roads, or access roads. This concept has been well understood for many years, but in more recent years there has been an increased recognition that more needs to be done to ensure this distinction is made. This includes providing an appropriate classification system, allocating all roads to this, and ensuring that the design, and understanding by road users is consistent with this function. Further information is provided on this issue in The Basics: Road user Capacities and Behaviours in Designing Infrastructure to Encourage Safe Behavior, including a discussion on ‘self-explaining roads’ to support road user understanding of this functional classification.
It is a challenging and potentially lengthy process for a road authority to move from adopting Safe System principles to implementing these within a road authority’s operations. Progress will be measured in years rather than months. Moving to embed a Safe System approach is likely to involve the following:
A summary of some key issues and potential actions or processes associated with moving to embed the Safe System within a road authority’s management systems is set out in Table 7.2.
| Issue | Potential actions/processes |
|---|---|
How can a road authority commence the process of embedding the Safe System approach in its operational practice? | Role statements and accountabilities at all levels in the road authority should reflect the actions and outputs expected to deliver Safe System progress |
How to commence/continue the transition from traditional approaches to the Safe System philosophy | Ensure that there is a high degree of understanding of the benefits associated with the proactive risk minimisation approach. The Safe System principles and scientific design foundations should be clearly and consistently communicated to agency staff and stakeholders. The economic and safety benefits of adopting this approach should be demonstrated through case studies and communicated widely within the organisation |
How to implement Safe System principles in horizontal and vertical corporate communication and decision-making processes | Corporate processes need to have Safe Systems outcomes embedded in them to strengthen development of a continuously learning organisation Continuous policy development should also be informed from operational development and implementation experience. Feedback from these activities is an essential means of improving policies and guidelines to embrace and deliver Safe System outcomes |
Formalised arrangements for the new ways of managing safety on the network | Apply these policies and develop supporting systems to incorporate proactive network safety management within the planning, project development, design, operation and maintenance activities of the authority. Establish ongoing performance measurement of safety outcomes to assure the community that the level of the authority’s safety performance is improving |
Addressing community/stakeholder awareness and acceptance of implications of adopting Safe Systems principles | Develop a communication strategy with agreed key messages and mediums for dialogue with identified stakeholders. |
At the outset, any existing national road safety strategy will need to be reviewed and if necessary adjustments to the strategy made to include the UN Decade of Action for Road Safety’s Safe System basis. It is expected that many LMICs will need to review the adequacy of their processes (see Establishing Corporate Processes to Develop Policy in Embedding the Safe System in the Goals and Operational Practice of Road Authorities for guidance on this).
The leadership will also need to recognise the changed organisational responsibilities that will flow from these decisions and consider how to go about providing for these changes. The needs and the environment in which the road authority in any country is operating will influence the detail of this.
Progress will depend heavily on leadership provided by the chief executive. These are quite challenging change management tasks, winning the support and commitment of senior management within the organisation is a key first step and priority.
Training programmes, such as those outlined in Learning and Knowledge Development in Embedding the Safe System in the Goals and Operational Practice of Road Authorities will be important on an ongoing basis as improved corporate policies and network management systems are adopted by the organisation. For any road authority moving to embed Safe System practice, senior and middle management need sufficient time to learn about and understand the underlying concepts.
The internal communication processes in place to support change management also need to be reviewed if meaningful change is to be introduced over time. This would include effective communication across all levels of government and between head and regional offices.
The experience of the Swedish Road Administration in introducing Safe System (Vision Zero) thinking and moving to implement associated and substantially different infrastructure safety programmes across the organisation is instructive (see Box 7.6)
From 2000 to 2009, Sweden moved to increase the 2 + 1 barrier divided road network on the more heavily trafficked sections of the national highway network. The length of this treatment increased from 180 km in 2000 to some 2120 km in 2009. This was to address the high incidence of head-on crashes experienced on the network, due in part to the existing 13 metre wide pavements (two through lanes with wide shoulders), which encouraged a form of four-lane driver behaviour, leading to increased head-on crash risk. Sweden also began to install side barriers to address run-off-road serious crash risk and to expand programmes to install roundabouts to address serious crash risks at intersections.
The decision made at head office for barrier expansion, in particular from 2000, took some time to achieve general compliance and support by all regional managers. In fact, performance targets for regional managers (for 2 + 1 lanes with wire rope median barriers) were required in order to drive compliance with corporate policy. Some regional managers considered the policy directives for central medians and 2 + 1 lane construction to not be in accordance with traditional approaches.
Road fatalities fell from 550 to some 350 annually in that 10-year period as the roll-out proceeded, and became an acknowledged world leading set of initiatives (part of the Vision Zero implementation).
.

© ARRB Group
Box 7.7 outlines an example of a road authority, which sets out the basis for its transformation to an authority that will fully integrate Safe System thinking into its activities and the associated strategic objective it has adopted. Main Roads Western Australia (MRWA) is an informed user of the Safe System, with an understanding of, and experience with, its application. The process MRWA has adopted to guide its use of Safe System principles within its operations is comprehensive and informative for other road authorities that are in a similar advanced stage of awareness of the Safe System.
The vision:
To eliminate death and serious injury crashes on the Western Australian road network and leave a lasting legacy of a safe road system for our children, grandchildren and the community.
Strategic objective:
The MRWA road safety strategy The Road Towards Zero is aimed at bringing about changes to our road safety institutional arrangements, practices and culture as we strive to eliminate death and serious injury. In doing so it will:
The Road Towards Zero’s strategic objective reflects this focus on cultural change: To change thinking, practice and behaviour – to let staff imagine all things possible – to build, maintain and operate an inherently safe road system.
As indicated earlier, relevant legislation under which the road authority operates will influence the way that the authority proceeds to implement a Safe System approach.
Building awareness of Safe System possibilities and application will be achieved through leadership, training and knowledge development as discussed in detail in The Safe System Approach. Resourcing this awareness building is a critical step for LMICs.
Effective training and change management activities will be crucial enablers to achieving Safe System progress. New Zealand, which has a well-advanced Safe System approach has implemented sector-wide training programmes through the New Zealand Transport Agency (NZTA) (Climo et al., 2014) as presented in Box 7.8
Safer Journeys (the NZ strategy) acknowledged the need to embed the Safe System into New Zealand’s road safety culture and to develop the capability to do so. Within four years of adopting a Safe System approach the NZTA has moved to incorporate Safe System processes within its operations.
A structured ‘culture change’ programme was embarked upon, which provided detail about what it meant in practice and what it needed to do differently. Supporting resources were developed as follows:
A range of existing policy, procedure and guideline documents, likely to have the greatest influence, were identified and a programme of updating these embarked upon.
The second Safer Journeys Action Plan (2013-15) has continued this focus with specific ‘Advance the Safe System’ tasks that include:
Source: Climo et al. (2014).
NZTA’s experience has demonstrated that culture change is not a short-term or easy task. It requires leadership from the highest level such as politicians and chief executives and perseverance, with continual repetition of simple key messages. It has also been recognised that changing the conversation in the media, away from the ‘driver blame’ culture, will be critical to success.
Effective staff development will require programmes such as New Zealand’s (above) and other more ‘entry-level’ programmes to be identified and then utilised for relevant professional development of staff, particularly within LMIC authorities. Activities such as short-term (two to four week duration) staff exchanges with other national road authorities, and seminars by local and international experts to inform and obtain input about road safety policy-related matters, should also be pursued.
A continuous change and improvement culture should be fostered, with an extended training programme for head office staff and the regions being introduced at the appropriate time. These are pivotal steps in helping to underpin safety knowledge and fostering improvement in safety performance by a road authority.
Initiatives to assist focused application of Safe System principles within road authority programmes and projects include:
Many professionals within road authorities learn about crash analysis, development of treatment options, selection of the most cost-effective option (with a focus on reducing fatal and serious injury crashes, as distinct from all crashes), and implementation, through high-risk location (blackspot) projects and programmes. On the contrary, it would be preferable for a road authority to move as soon as possible to a network-wide assessment and treatment of crash risk, high-risk location treatment projects – which are based on solid evidence of crash types and robust estimations of project costs and crash reduction benefits, followed by later evaluation – are a key learning tool for professional road safety engineers that are starting out in road infrastructure safety. Such projects, as long as they are pursued with a clear Safe System focus and basic initial understanding, are important steps for individuals along the path to broader understanding of crash risk and tools.
Examples of demonstration projects in a number of countries by all the road safety agencies, including the road authority, to improve crash risk analysis and treatment knowledge are provided in Road Safety Targets, Investment Strategies Plans and Projects.
Change is always challenging and the scale of reassessment or reframing of policies and guidelines involved with fully embracing the Safe System is substantial. These are large steps for any road authority, but it is a substantial challenge when a typical LMIC authority embarks on this journey. Moving from understanding by individuals to adoption of a corporate consensus and then agreeing on the new road safety vision and how it is to be applied is a challenging process for any road authority. Processes of this type will be less developed in most LMIC road authorities but dialogue and discussion need to be encouraged as soon as possible by their leaders. It is likely to take time and leadership to implement a significant change to established corporate policy-making processes.
To support the substantial policy development task of establishing road safety priorities, road authorities in LMICs could usefully establish working groups to examine issues and develop detailed and implementable policy recommendations for senior management. Each group would have:
These working groups would report to senior management, which could be convened as a senior road safety planning group on a regular basis. Priority policy issues could include:
An authority with more developed corporate decision making processes could follow a Project Review Committee approach to develop and progress an expanded crash risk reduction programme. The committee would be made up of the senior engineering executives of the organisation and would review presentations by project staff on larger proposed projects on a regular (possibly weekly) basis. Project proponents would be queried on higher-level key issues, (estimated cost, asset management, delivery, environmental and land acquisition, mobility and access, traffic management and road safety).
Safety discussions would centre on measures proposed to improve safety within new projects or the existing safety issues on an existing road which is to be upgraded and measures to be taken to address these. Corporate road safety policies, guidelines and standards would be reviewed and adjusted, or introduced, as a result of these discussions and associated further reviews.
As indicated in Learning and Knowledge Developments in Embedding the Safe System in the Goals and Operational Practice of Road Authorities, the previous exposure to blackspot programmes is relevant, as these activities sensitise a road authority not only to opportunities for improving levels of safety on the network but also to the disadvantages of only treating high-risk locations, leaving lower-risk lengths untreated and less likely to be treated.
The Project Review Committee approach recognises that embedding the Safe System requires an organisation-wide dialogue at the senior management level about network operating responsibilities, as well as a similar dialogue at project or programme-specific levels (e.g. where bicycle paths along existing arterial roads should be located on the cross-section of an upgrade or new road project).
The production of quality policies, guidelines and standards follows as a next step. These will be developed over time and will be quite varied in nature, reflecting the stage of safety development of a road authority and its immediate safety priorities. Further advice on the role of policies, standards and tools and their development is provided in Chapter 9, Infrastructure Safety Management: Policies, Standards, Guidelines and Tools along with examples.
An Example: Some road-safety-related policy gaps that were identified as needing to be addressed by the Indonesian Directorate General of Highways (DGH) in a review in 2013 of the overall strategic plan are summarised below. They are down to earth, practical policy initiatives, including:
For road authorities in LMICs, priority safety issues for policy attention and implementation will often differ from priorities for HIC authorities. For LMICs, policy priorities will usually include:
As an example, the City of Abu Dhabi has worked to develop urban design guidelines for application across the urban streets of the city to improve sustainable safety and amenity for pedestrians, public transit users and cyclists and give these road users priority through these treatments. This outlined in the case study below.
The steps outlined in Setting a New Strategic Objective to Producing Policies and Guidelines from Embedding the Safe System in the Goals and Operational Practice of Road Authorities will provide the guidance required for embedding the Safe System within management and operation of the network. However, there is another step required of road authorities. They need to progressively apply the policies they are developing and to build supportive management systems to ensure their network management activities incorporate all the guidance they have prepared.
A road authority will need to take steps to incorporate safety management systems within its network planning and operations. This can be pursued through measures such as:
Some formalisation of this approach is recommended in time and ISO 39001 provides guidance on how to structure this (see Interventions in Management System Frameworks and Tools).
A road authority will need to progressively assure itself and the community that it is making progress with improving its network safety management and operation. This assurance can be sought through:
For most LMICs, the identification and adoption of specific safety KPIs will be a useful way to measure performance and build accountability over time.
All road safety strategies should have specific KPIs. The introduction of KPIs allows authorities to specify the level of improved road safety achievement sought and/or to encourage active development and achievement of road safety improvement programmes.
One consequence of a lack of high-level road safety KPIs can be the absence of an identifiable separate budget allocation for specific road safety programmes. Funding allocation categories within LMIC road authorities typically include routine maintenance, periodic maintenance, rehabilitation and reconstruction. One of the benefits of a separate allocation for specific safety programmes is the ability to measure overall expenditure on targeted safety works and to determine economic return on investment.
Good network safety performance needs to be considered a major organisational output for a road authority. Over time, safety-related corporate-level KPIs are likely to move from initial introduction in many LMICs to ‘centre stage’ importance in the authority’s overall performance assessment.
A range of more detailed performance indicators will need to be developed to enable progress with implementation of infrastructure safety treatments. Once KPIs are agreed it is necessary to establish how they will be measured and reported, and determine the frequency at which this will take place (see performance indicators discussion in The Road Safety Management System, Effective Management And Use Of Safety Data and Road Safety Targets, Investment Strategies Plans and Projects). Example KPIs from the Global Plan are provided in Box 7.9.
The Global Plan for the Decade of Action (see The UN Decade of action and global plan) includes performance indicators for the safer roads and mobility pillar. Although these are targeted at the monitoring of activity at global level, they serve as useful examples for use by individual countries. The indicators are categorised as ‘Core’ and ‘Optional’.
Core indicators
Optional indicators
Source: UNRSC, 2011
Programme guidelines are specifications for use by road authority staff of the elements within a potential programme that are to be developed and funded on a priority basis (usually on the basis of benefit-cost ratio or net present value; see Intervention Selection And Prioritisation). They are used by many road authorities to guide preparation of projects that are to be considered in a corporate approval process in various programme funding categories for the coming financial year.
Their development is usually a cooperative process between the relevant central policy area and the regions of a road authority; such processes are required to develop and deliver the approved projects as components of the particular programme. They represent the specification of the proposed annual activity programme which has been agreed between core business areas, regional offices and corporate level, and enable regions to bid in detail for categories of project funding.
An example of this is the introduction of a safety-focused maintenance policy that embeds safety performance criteria in the agreed levels of service of the road network. Modification of these existing practices can deliver measurable safety improvement across the network over time. A review of existing practices and identification of ways to modify current practice to deliver a safer network at the same or similar levels of cost could be carried out as part of annual programme guideline development.
Effective programme guidelines require sufficient lead time for development, and then are used to assist the generation of the annual programme for review, consideration and prioritisation during the budget development period.
There are many variants to this process in different authorities. The important elements are:
It takes time and effort to set up arrangements for new programmes with which the road authority is comfortable. It is suggested that simpler programmes (both development and delivery) in the initial years of development can assist with this transition, especially for LMICs.
Starting with projects that are more straightforward in nature (such as blackspot or blacklength identification and treatment on the existing network and road safety audit activity for new projects) offer a good initial learning platform.
The commencement of safety programmes with blackspot treatments enables staff to understand the necessary analysis of crash costs, the impacts of specific treatment types (such as roundabouts or hard-shoulder widening), and the crash cost reduction benefits of those treatments. As outlined in Establishing Corporate Processes to Develop Policy in Embedding the Safe System in the Goals and Operational Practice of Road Authorities these are necessary skill sets required before a road authority moves on to crash-risk-based identification, and analysis and treatment of network lengths and routes to achieve crash reduction benefits.
Success in the initial years with a simpler programme is likely to lead to increased support for the road safety improvement task from the community and government and to further funding.
Belin M-A, Tillgren P & Vedung E (2012), Vision zero – a road safety policy innovation, International Journal of Injury Control and Safety Promotion Volume 19, Issue 2, 2012, pages 171-179.
Climo, H, Dugdale, M & Rossiter, L (2014), The Safe System in Practice – A sector-wide training programme, Journal of the Australasian College of Road Safety, 25, 19-26.
Kostic N, Lipovac K, Radovic M & Vollpracht H, (2013), Improvement of Road Safety Management and Conditions in Republika Srpska, World Road Association (PIARC), Routes/Roads 360, 54-63.
United Nations Road Safety Collaboration (UNRSC) (2011), Global Plan for the Decade of Action for Road Safety 2011 – 2020, World Health Organization, Geneva.
Vollpracht, H (2010), They call them coffin roads, World Road Association (PIARC), Routes/Roads 347, 42-52.
Zajc, L (2014), ‘Slovenian experiences on road safety management’, Presentation to Regional Road Safety Capacity Building Workshop, Belgrade, Serbia, 15-16 October 2014
Roads are provided to cater for the movement of people and resources between destinations, i.e. to provide for mobility and access. Particularly in LMICs, roadside trading and social interaction continues to be an essential third function for parts of the road network. In these countries, the benefits of setting aside areas of public space, where sociability rather than mobility is the priority, are being increasingly recognised. Mobility, accessibility, and commercial/social interaction are therefore the three key human uses that roads have to be designed and managed to serve.
Earlier chapters introduced the concepts of the Safe System, and of safe travel as a product, which requires certain actions to produce it. Safe products must match the needs, capacities and expectations of their human users and roads are no exception. This chapter outlines how to create a road system that takes account of human characteristics and meets Safe System requirements.
Human factors are a well-established scientific endeavour that has influenced developments in many areas of technology. Its application to road safety issues in a formal sense goes back to at least the 1930s (e.g. Forbes, 1939). Contemporary understanding of issues, such as the time it takes to perceive and detect any critical location that challenges the driver to adapt his driving programme and to make a new decision, the desired luminance, size and contrast between objects and the background needed to resolve detail, and the rate that information is absorbed, should underpin key standards in road design. Other important demands for road design arise from the holistic perception of the road user within the road environment. From there essential design principles of "Gestalt" have to be included in the technical design considerations. This understanding of the laws of human perception and activity regulation that includes the decision-making capacity of the road user allows for the development of design and operational specifications for the road system. This includes elements such as:
By effectively doing so, road users can navigate the road system safely and comfortably. Since knowledge in Human Factors continues to evolve, many of its findings remain to be absorbed in technical standards and guidelines of the road infrastructure profession. This chapter seeks to introduce the concept of Human Factors, relate it to Safe System principles, and explain how Human Factors can be applied to create a safer road system. Human Factors is the generic term for those psychological and physiological threshold limit values which are verified as contributing to operational mistakes in machine and vehicle handling. It deals with general and stable subconscious reactions of common road users and excludes temporary individual reactions and conditions. From there can be derived essential conclusions for basic design principles that are until now not well established in current national design guidelines (PIARC Report 2012R36EN).
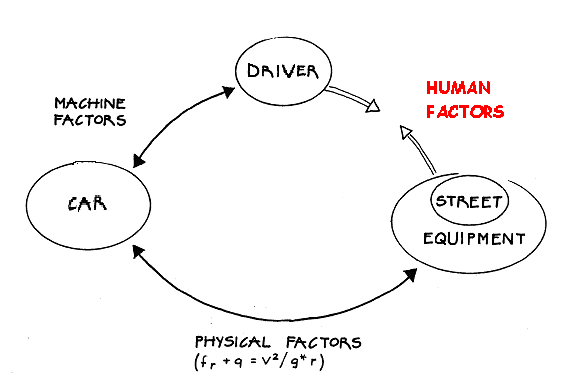
Figure 8.1 Human Factors in the system of road safety
In road safety, human factors is concerned with the interaction between human road users and the roadway system elements, including vehicles. The distinction is often made between unintended errors and disobedience of road rules. Unintended errors tend to occur when road users misperceive some aspect of the road system, they do not have enough time to react to changing situations, or they are confronted with unexpected situations. These issues and the means of remedying them are discussed in Designing Infrastructure to Encourage Safe Behaviour.
Disobedience of the road rules often occurs when the road system does not adequately meet road users’ needs, e.g. when there are long waiting times to cross at signalised pedestrian crossings. However, disobedience of the road rules may also occur when users do not understand what they are supposed to do or understand the benefits of compliance. This is particularly the case in LMICs as they rapidly motorise and upgrade their road networks and sometimes may not have the signs, road markings or systems in place to guide and inform those driving, walking or biking. Disobedience may also occur because some road users believe they can gain a benefit (such as a faster journey or a more convenient parking or unloading spot) without incurring any penalty. These issues and some of the implications they have for infrastructure provision are discussed in Other Means of Encouraging Road Users to Behave According to the Rules
Human Factors is not the same as we commonly understand human behavior or human performance to be. So, the questions of personality traits like aggression, the will to violate traffic rules consciously or mistakes because of medication or age has to be regarded separately. From there can be derived essential conclusions for basic principles of driver's education, campaigns for influencing driving behavior and enforcement. The AASHTO HSM 2nd Edition states that human factors issues include contributing factors to crashes that generally reflect mismatches between the demands placed on the road user by roadway design and traffic engineering features, and the inherent physical, perceptual, and cognitive capabilities and limitations of road users (Brown et al., 2022). Driver behavior issues include contributing factors to crashes that generally reflect deliberate violations of law or safe driving practices such as texting while driving, inattention, or driving while impaired by alcohol. When "human factors" and "driver behavior" issues are conflated by practitioners. More blame for the crash is placed on what is believed to be misbehavior than on the interactions between road demands and driver capabilities. This approach can have the effect of leaving the real human factors issues (e.g., limited visibility, high workload, limited time to react) on their roadways unidentified and unaddressed. Information related to this concept are provided in the following sections:
It is important to recognize the differences between human factors issues and aberrant driver behavioural issues, as they reflect different contributing factors to crashes and therefore often require different countermeasures to address the respective contributing factors and corresponding differences at a location. that generally reflect mismatches between the demands placed on the road user by roadway design and traffic engineering features, and inherent physical, perceptual, and cognitive capabilities and limitations of road users (Brown et al., (2022). Driver behavior issues include contributing factors to crashes that generally reflect deliberate violations of law or safe driving practices such as texting while driving, inattention, or driving while impaired by alcohol. The "human factors" and "driver behavior" issues are conflated by practitioners. More blame for the crash is placed on what is believed to be misbehaviour than on the interactions between roadway demands and driver capabilities. This approach can have the effect of leaving the real human factors issues (e.g., limited visibility, high workload, limited time to react) on their roadways unidentified and unaddressed. Information related to this concept are provided in the following sections:
Human Factors have a key role to play in achieving Safe System requirements.
Safe System principles require that no road users are killed or seriously injured. In an ideal system, collisions would not occur because the road is designed according to the needs of perception, cognitive processing and motor response for all the users. This is unlikely to be achieved as long as humans directly control vehicles and while many roads are not designed consistent with the needs of road users such as where speeds and road context dictate the need for separation of road users. Even with the advent of autonomous and connected transportation human control is still likely for some time into the future. In addition, there will be a time when vehicle fleets will be in transition with some vehicles having advanced technology and others not.
Efforts should therefore be made to help road users perceive the road correctly and to make decisions about driving, riding or walking that are safe for themselves and other road users. Applying the Human Factors principles described in the remainder of this section should go some way to achieving a collision-free road network, but it must be recognised that improving guidance will not always succeed in preventing collisions. That being the case, space to correct mistakes should be provided where possible, e.g. by having lane widths that allow some manoeuvre space, providing sealed shoulders, or by having stop lines some metres in advance of the walkway on pedestrian crossings so long as those changes do not adversely increase operating speeds. Adequate recovery space will reduce the number and severity of impacts; however, it will not always succeed in preventing impacts. Therefore, the Safe System requires forgiving infrastructure and forgiving vehicles so that when collisions do occur, they will not result in fatalities or non-recoverable injuries.
The NCHRP report, Human Factors Guidelines for Road Systems (HFGRS) (Campbell et al., 2012, Campbell et. al. 2022) is a comprehensive source on Human Factors and road system design and management concerning the reaction time needs of road users. It is intended to supplement the primary design references and standards, so that designers who do not have an extensive Human Factors background will be better able to take account of road user reaction time capabilities and limitations in the application of these standards. NCHRP is also in the process of publishing a document that considers human factors as part of countermeasure selection - NCHRP project (22-45): Informing the Selection of Countermeasures by Evaluating, Analyzing and Diagnosing Contributing Factors that Lead to Crashes. The document was developed to improve countermeasure selection by increasing the understanding the contributing factors leading to crashes, including human factors and behaviours.
The World Road Association (PIARC) has published a Human Factors document – Human Factors Principles of Spatial Perception for Safer Road Infrastructure (HFPSP) (PIARC, 2019). It is the most comprehensive approach to illustrate in a practical way the needs of road users for proper reaction time, for reliable guidance and stabilization of user’s field of view and to pre-program user’s expectations so that mistakes can be avoided by design. It is based on the state of the art of human sciences, especially on the Gestalt principles of the Gestalt psychology.
When trying to make sense of the world. Gestalt psychology suggests that we tend to perceive things as a whole rather than as individual components as a way to more efficiently process information and make sense of our environment. Gestalt is the impression of content of perception that is clearly distinguishable from its background of scenery and the details of which are so integrated as to constitute a functional unit with properties not derived from the summation of its parts. It aligns well with Safe System principles and advocates a proactive approach to safety management, with the aim of designing roads so that crashes are unlikely. The HFPSP guide provides a powerful and convenient method for applying Human Factors principles to a wide range of situations that are likely to be encountered by drivers. It does not explicitly consider pedestrians or other vulnerable road users as active participants in the traffic system. However, the essential principles are also applicable to these road users, and the reader is encouraged to do so in cases where it is appropriate in their own practice.
The Human factors guidelines for a safer man-road interface (PIARC, 2016) presents the Human Factors concept which highlights how road characteristics influence a driver's or wrong driving actions. The guideline explains the relationship between several road characteristics that trigger wrong perception and therefore also wrong driving reactions, most of which happen subconsciously. The guideline contains detailed examples and sketches to help practitioners gain an understanding of the relationship between misleading and irritating road characteristics and operational mistakes. Better understanding the human factors relationship to road safety allows for an "on-the-spot" investigation of black spots or single vehicle crashes or in road safety inspections (RSI). This information is also valuable in the planning and design processes in road safety audits (RSA).
These documents provide powerful and convenient methods for applying human factors principles to a wide range of situations that are likely to be encountered by drivers. The following illustration outlines the damage and prevention oriented accident approaches (Birth, Sieber and Staddt, 2004).
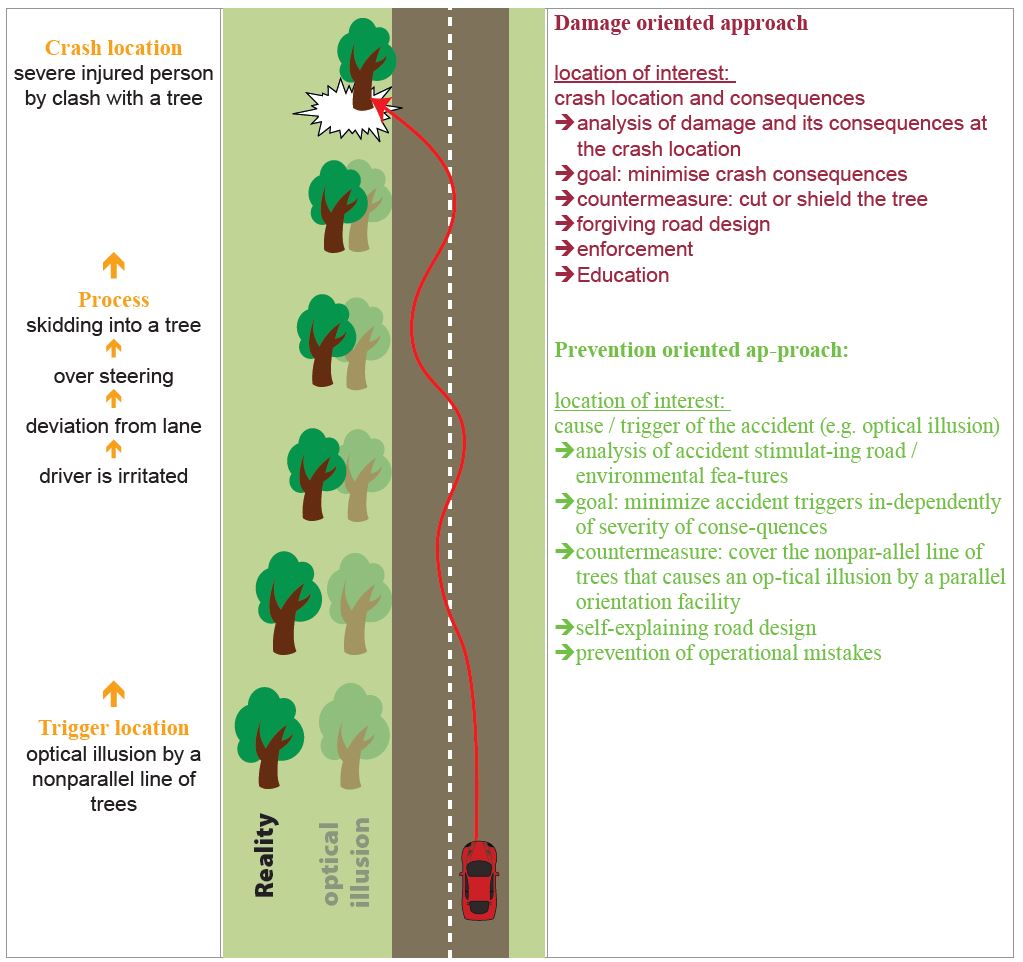
Figure 8.2 Damage and Prevention Oriented Accident Approaches
The demand of self-explaining design of Human-Machine Interfaces has produced a revolution in operating computers, machines and phones. The principles of an intuitive design that suggests users can use their mobiles or tablets reliably without further instruction are nowadays very common. In analogy to that, a self-explaining road design should be as intuitive as possible for the road user so that danger symbols, prohibition and requirement signs are not required any more in the Man-Road Interface. So, it is not only important to build up a clear system of road categories to inform the driver about the appropriate speed or to set speed limits. A road's Gestalt should also provide a clear impression of how to drive and it should pre-program driver’s expectations so that they are never surprised or encouraged to take any risk. The information presents below are findings from Germany from 1,400 crash locations. This study found the following three human factors elements essential for self-explaining roads.
The time it takes an average driver to adapt from one traffic situation to the next, or to adjust to new requirements, is much longer than what is stated in many current guidelines. Because humans are not constantly alert and searching for new information, they need more time. This is especially true when information is difficult to find or is unusual, or when the driver is confronted with complex decisions or when unusual manoeuvres are required. Instead of one or two second (simple "stimulus-reaction time") it takes the average driver at minimum 4-6 seconds to adapt to a new driving requirement ("anticipation-response time." PIARC Report 2012R36EN). Providing the driver with more time to perceive, decide and respond to the road and conditions is one of the most important means to improve safety. At 100 km/h, the distance covered before the vehicle can be brought to a complete stop is up to 300 m, allowing for braking distance (note that this may take longer if braking is slow due to a wet road or other circumstances).

Figure 8.3 Intersection not visible 125 m ahead: unexpected braking and high speed cause of rear-end collisions (Source: Birth, Sieber, and Staadt, 2004
A user-friendly road will give drivers the necessary time to adapt to new and unexpected situations. It will give them the time they need to safely reorganise their driving program. That is why it is not enough to provide the driver with a reaction time of 2-3 seconds (Stopping Sight Distance, SSD, with manoeuvre section and response section). The design should also provide an anticipation section with a minimum 2-3 seconds to identify an unexpected or unusual situation with more complex decision demands (Decision Sight Distance, DSD). In situations that are more complex or involve higher speeds, it is recommended to have an advance warning section with proper signing and instructions.

Figure 8.4 The six second requirement - Source: PIARC, 2015.
The usual ways to avoid this situation in practice are to:
Additional good solutions and best practice examples can be found in the PIARC Report (PIARC 2012b) "Human Factors in Road Design. Review of Design Standards in Nin Countries."
It is important to recognize the factors that may affect the driver's ability to anticipate, perceive and react to given situations and conditions. Table XX provides examples of driver and situational/environmental conditions that can influence ability to perceive and react to a condition, which highlights the importance of the six second requirement.
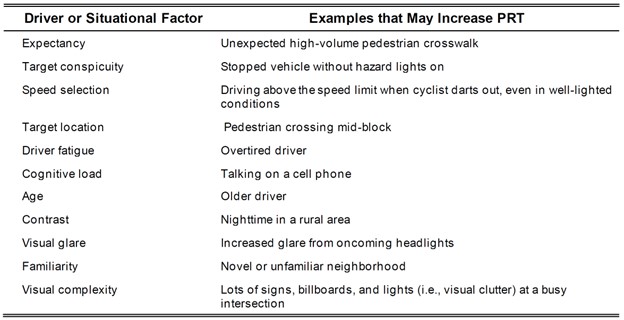
Table 8.1 - Example of Driver and Situational/Environmental Variables That Can Influence PRT.
Campbell et. al, note that expectancy, conspicuity, and speed are notable factors in perception reaction.
Expectancy is important to driver response when a road is self-explaining, the driver knows what to expect from the road, and sudden changes are reduced. Sudden changes require extra processing time (e.g., sudden curves, high volume pedestrian crossings, significant speed reductions). A designer should take time to consider what the driver is expecting to see given the past experience and adjust or inform accordingly.
Conspicuity or the ability to be seen or noticed is an important concept in road design and operation. A conspicuous object is one that the driver can detect. Failure in detection leads to crashes. Issues that reduce conspicuity to drivers include objects that are off-axis or not in the driver's line of sight, or cone of view. Items that blend in with their background or have diminished contrast make them difficulty to identify. The size of the object, such as those objects that are very small or very similar to their surrounding items can create challenges as they become camouflaged. In some locations, visual clutter, such as multiple signs, messages, confusing information or complexity are influencers, particularly at locations requiring multiple decisions, such as intersections, interchanges or curves.
Speed is important. As has been suggested earlier, the faster one is driving, the further they travel in a shorter timeframe before encountering a decision point or object. While speeds influence driver speed choice, other important infrastructure elements (e.g., shoulders, lane widths, vegetation, roundabouts, and curvature) can influence driver speed choice. Drivers will view the speedometer but use other visual, auditory and tactile stimuli to select speeds. Drivers use perceptual and message cues to select speeds. Drivers can also misjudge speeds in some environment such as rural environments without trees or entering into a lower speed environment after travelling many kilometers on a high-speed environment such as rural to suburban transition zones.
Monotonous, clouded, deceptive or distracting impressions affect the quality of driving. The road, together with its surrounding field, offers an integrated field of view. This can either stabilise or destabilise the driver; it can tire or stimulate them. It can also result in either increased or reduced speed. Speed, lane-keeping and reliability of direction are functions of the quality of the field of view.
A user-friendly road will give drivers a well-designed field of view with sufficient contrasts to increase alertness. It will provide good optical guiding and orienting facilities with symmetrical and orthogonal impression.
A good-quality field of view safeguards the driver and keeps him from drifting to the edge of the lane or even leaving it. Misleading eye-catching objects in the periphery of the field of view activate subconscious changes in direction. The most serious consequences arise from eye-catching objects that differ from the road axis. These lead in extreme cases to a horizontal swing of the complete field of view: The driver has the feeling that the road and its surroundings are moving while he is in an unmoved position. Such objects lead to gross mistakes in steering. At minimum they lead to disturbances in lane-keeping, though these can mostly be corrected (for this reason billboards near interurban roads that catch driver’s attention to a wrong direction should be forbidden like in Germany).
An experienced and Human Factors trained designer will avoid monotony in curvature and visual appearance. They will avoid optical illusions or misleading objects that destabilise drivers and negatively impact their driving and will take advantage of the optical perception to influence the driver's choice of speed.
Factors that are forming a safe field of view include the following characteristics:
a) Density of the field of view
The amount of information also influences driver’s speed. The term used for this is density of the field of view. It is a function of the number of objects that contrast with the background. The presence of very few contrasting objects leads to monotony as well as reduced performance and reactivity. To avoid monotony the driver subconsciously changes his driving activities in order to increase information input: he swerves, brakes or – in most cases – increases speed. Consequently, it is desirable to achieve an optimal level of bness and color-contrast (optical density) to support the correct choice of speed. That is why efficient speed management relies on changing bness and color contrasts to avoid subconscious speeding up.

Figure 8.5 Density of the field of view is low; monotonous and long straight-ahead section stimulate subconscious speeding up (Birth, et. al 2004)
b) Lateral space structure
It is proven, that the lateral field of view and its information provide the most important information to master the difficult task to hold balance on the road like on a balance beam.
If designers fail to take this fact into account, they may not make the prediction about how the finished design will influence lane-keeping. To hold balance on the road (as on the balance beam) drivers need a clear orthogonal orientation out of objects in their periphery. Orthogonal objects or structures calibrate the equilibrioception of road users that is needed for lane-tracking. Equilibrioception is the perception of the position of an organism in the space with the help of the eyes (visual system), ears (vestibular system) and the body's sense of where it is in space (proprioception). Structures over the road like bridges, advertising, signaling and toll facilities should be symmetrical, of equal height, and the angle of skew to the own road should be less than 15° from perpendicular.
It was found at accident spots that asymmetrical posts of a bridge or pitched bridges/advertisements confuse and disorientate drivers with regard to lane-keeping and result in run-off-road accidents.
Driving reliably through a curve also critically depends on the quality of the field of view and a clear distinguishable Gestalt of the curve. Best driving results are achieved when the driver has an unobstructed view over the inner curve and the outer curve has a closed optical framing that provides with its Gestalt a clear instruction that there is a curve at all. It provides also clear information about the sharpness of the curve.
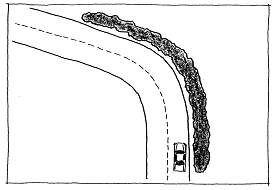
Figure 8.6 Complete frame of the outer curve and unobstructed view of the inner curve stabilise the driver (Birth, et. al, 2004)
c) Depth of the field of view
The driver orientates themselves in the environment that surrounds them. To estimate their position relative to the road and to their surrounding and to other drivers, they depend on their changes of position, the changing view axis and the changing points/lines of reference in the environment. The most serious consequences arise from eye-catching objects that differ from the road axis. These lead in extreme cases to a horizontal swing of the complete field of view.

Figure 8.7 Depth of space structure: Dominant eye-catching object (church) in competition to a subdominant railway crossing
All lateral orientation clues should be parallel to the road edge, regularly spaced and equally sized to stabilise lane-tracking. This is important for markings, hard shoulders, side strips, safety barriers, snow and wildlife fences, plantings, bicycle ridings and rescue paths and also for public maintenance roads. It was found at black spots that non-parallel orientation lines lead to the impression of prolonged (if lines are converging) or shortened (if lines are diverging) distances up to critical locations. Optical illusions cause subconscious swerving, sudden driving manoeuvres and technically “unexplainable” run-of road crashes. The word illusion comes from the Latin verb illudere meaning "to mock.” Illusions are the result of the complex information processing of the brain and the visual system that tricks us into perceiving something as different from what it actually is. Thus, what we see does not correspond to physical reality.
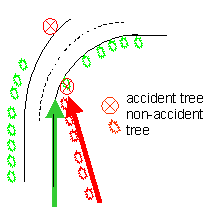
Figure 8.8 Distance Illusion at an accident point
These mistakes can be addressed by the following measures:
Additional good solutions and best practice examples can be found in the PIARC’s Report (PIARC, 2012b)“Human Factors in Road Design. Review of Design Standards in nine Countries”.
Drivers follow the road with an expectation and orientation logic formed by their experience and recent perceptions. These affect their actual perception and reactions.
The same principle applies when climbing stairs. After only a few steps the motion balance adjusts to the sequence of steps just perceived. In most cases, this is a subconscious process. However, if one step is of a different height, the motion balance will become considerably disordered - possibly resulting in a stumble or fall. Adjustment of driving programme on the road is similarly subconscious.
The perception of the lane, the edge of the lane and the lane periphery produces a general sensual impression. Drivers react to these road elements with their actions, in the same way as the person climbing stairs reacts intuitively to the height, depth and width of the steps. Unexpected objects disturb the automatic sequence of operations, possibly causing the driver to “stumble”. After several critical seconds the disturbance can be handled. Therefore, planners and designers try to keep road characteristics flowing in a logical sequence. They should introduce inevitable changes as early and clearly as possible and exclude any sudden changes that would confuse the driver.

Figure 8.9 Continuous and discontinuous curves in a road
When choosing their speed, drivers rely on their previous and recent sensory impressions of the last driven 5-10 minutes. Breaking the consistency and the experienced logic of the design causes operational mistakes which can lead to driving mistakes and accidents.
This particularly applies to five situations:
a) Change of road function without corresponding change in design and optical characteristics (e.g. town entrance)
Drivers need to adapt their driving programme when entering a built-up urban area or when road functions change significantly. They need to decrease speed and be more attentive as more decisions and reactions are required. Generally, there should be offered unambiguous visual clues to recognize the change of function, for instance by a horizontal swing of road’s course, optical sight barriers, planted central islands, special speed-reducing markings or a combination of these instructions. A clear guiding Gestalt hast to instruct the driver on how to adapt the driving programme.
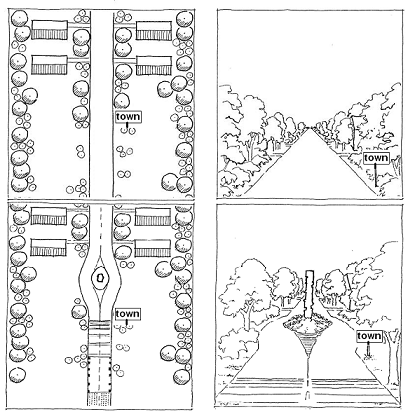
Figure 8.10 Visual Cues reinforce the changed road function and eye-catching objects reinforce the change (Birth, et. al, 2004)
b) Change of road’s direction is contrary to eye-catching objects in another direction (e.g. city by-pass dilemma)
Drivers need eye-catching objects to realize that there is a change in road's direction despite other dominant eye-catching orientation structures or objects. The change of direction has to be supported by covering the wrong view axis or optical misguiding.
It has been found at black spots that dominant eye-catching objects such as a line of trees, buildings or straight road sections impede the correct anticipation of a road’s course even though correct signing is present. Road characteristics that mislead spatial perception cause technically “unexplainable” accidents.
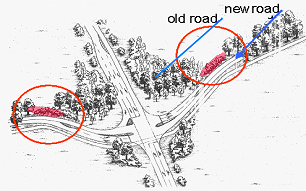
Figure 8.11 changed direction contrary to the old, dominant eye- catching view axis can be corrected by a planted embankment (Birth et. al, 2006)
c) Requirement for a new driving program recognised and changes are introduced to "re-programme" driving habits and expectations
Changing the -of-way or altering the course of the road - such as a new alignment will challenge driver’s habits and expectations. Appropriate and timely signals or visual clues are required to inform the driver and provide an adequate time for correct anticipation. The required reaction could be significantly different from the habitual one! In order to avoid surprises, various design principles need to be considered.
It has been found at black spots that newly built intersections that are not introduced properly lead to incorrect anticipation of the situation and therefore to crashes even though correct signing is present
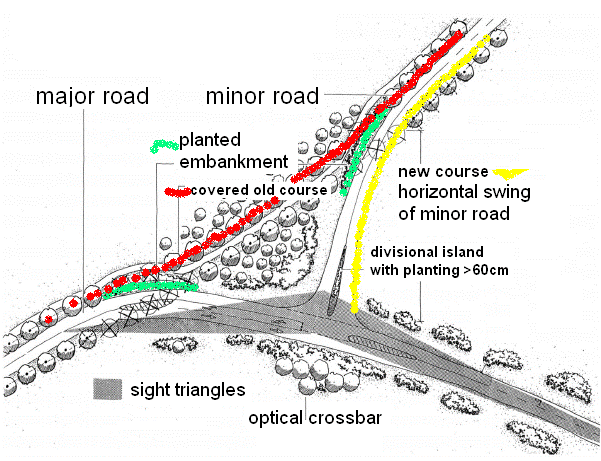
Figure 8.12 Example to re-programme a driving habit by a combination of design and optical guidance measures (Birth et. al, 2006)
d) Driver's attention and ability to process information is limited
Driver’s attention and ability to process information is limited. Driving requires multiple tasks, such as control of lane tracking, anticipation and orientation as well as navigation. Drivers can focus on one piece of information at a time and multiple distractions, or critical locations may result in an overload.
Too many decisions in too short time can overload the capacity for information processing and result in safety risks.
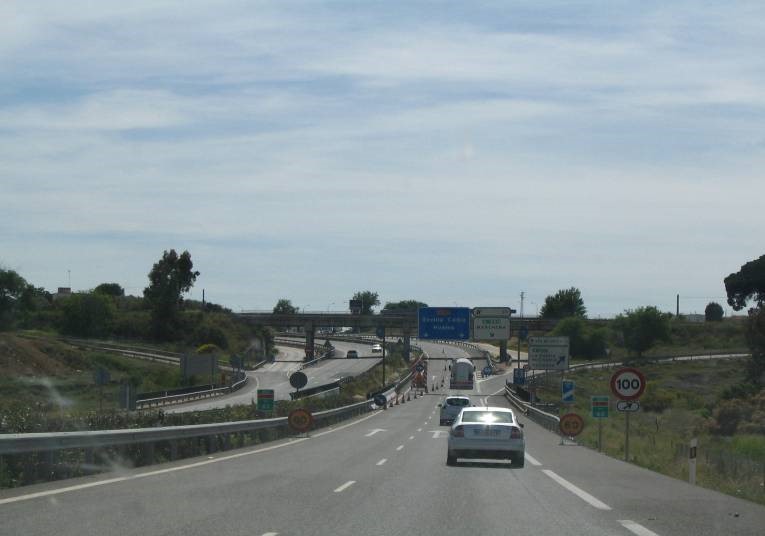
Figure 8.13 Three critical locations: maintenance point, starting a curve and exit road without transition and/or progressive information (150 m ahea) (Birth, et. al, 2006)
e) Deficiencies in traffic control devices
Due to higher traffic volumes, roads need to be equipped with traffic control devices for safety. Along with rules, traffic control devices organise the driving reactions of road users. Under all light conditions and within all optical backgrounds, traffic signs should be visible, legible and detectable. They should never be covered by plantings or other structures. That is because the effect of mimesis may make even b, oversized signs invisible to the driver. Mimesis, also mimicry is the ability of organisms to adapt their coats/skin completely to their background so that they can't be detected.
Figure 8.14 Three oversized chevron signs in red and white are not visible against the background in an accident curve (Birth, et. al, 2006)
Additional good solutions and best practice examples can be found in the PIARC’s Report (PIARC, 2012b) “Human Factors in Road Design. Review of Design Standards in nine Countries”.
Traffic control devices need to be placed to clearly indicate necessary action. Failures in placement and changing messaging can create failures in selection and ultimately lead to emergency maneuvers taking place leading to a higher potential for crashes. The following images provide an example of such failure. First of signs shown in Figure 8.15 indicate city center and Seattle in the same direction and lane.
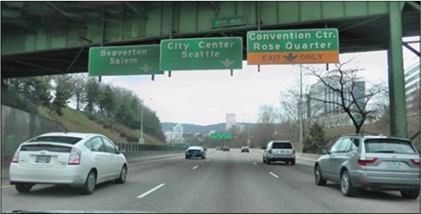
Figure 8.15 Deficiencies in traffic control devices example: First set of directional signs (Source: John Campbell, Washington State, USA)
The second set of signs shown in Figure 16 are located 600 feet after the first signs and provide a different message. The second set of signs provide no mention of City Center or Beaverton, placing additional workload demands on drivers and additional processing time. Furthermore, the Bridge obstructs the view of upcoming interchanges and horizontal curvature, and the location lacks symmetry and the offset visual opening may lead the driver to the .
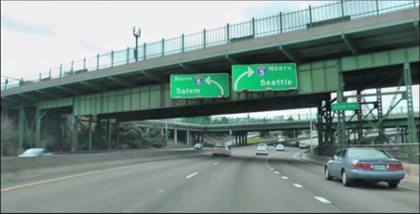
Figure 8.16 - Deficiencies in traffic control devices example: Second set of directional signs (Source: John Campbell, Washington, USA)
The final set of signs (Figure 8.18) are inconsistent with the previous messages. Additional processing time is required to decipher messages. Visibility is challenging because of the rise in vertical grade in combination with horizontal curvature and the road splitting to the and . All of which require additional steering input and processing time. The set up to the curve may be problematic because of confusion. The complexity may lead to sudden braking and steering due to late actions being taken.
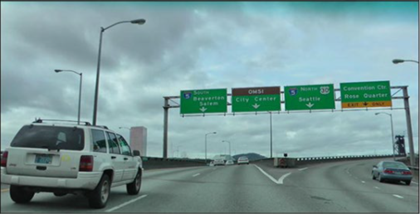
Figure 8.17 - Deficiency in traffic control devices example: Third set of directional signs (Source: John Campbell, Washington, USA)
The previous example highlights the potential for human error when expectations are violated. In the following we discuss other important human factors element to consider in reducing workload demands for drivers.
Expectations are used to help the driver prepare themselves to respond to future driving tasks, which in turn improves driver behaviours. Predictability allows for a lessening of cognitive efforts needed to process information. In a sense, the driver is programmed to a set of behaviours that are processed quickly and efficiently. While we often think of expectations of drivers, setting and providing for clear expectations is beneficial to those walking and biking equally as it is towards the driver.
Expectations are created through design and operational consistency. Consistency allows for prediction by the road users, and it provides coded rules and relationships within the road environment (e.g., through common stop signs, or geometery, lane markings being the same or very similar), all of which lead to improved road user response.
Expectations can be enhanced by well-designed traffic control devices based on the following principles of primacy, spreading, coding and redundancy are discussed.
Principle of Primacy -- Determine the placement of signs based on the importance of information, and by placing the information where it is most useful and beneficial.
Principle of Spreading -- Road users need time to process information. Therefore, all the information cannot be placed very closely or together. Signage needs to be placed in a manner that provides information in smaller processible parts to reduce information overload.
Principle of Coding -- Communication through multiple means is beneficial. At stop signs, one will often see stop bars, or additonal pavement markings requiring a stop. With some systems audible signals provide redundant information as to when to cross beyond just a pedestrian or bicycle crossing signal.
The case study from Portugal, shows the use of low-cost engineering measures and law enforcement to change driver behaviours.
CASE STUDY – Portugal: Perceptual treatment - Low Cost Engineering Measures on a dangerous trunk road
The case study describes the approach used in 1998 by the Circulation and Safety Division of the Portuguese Road Administration (JAE) to improve road safety on the interchanges of a single carriageway, two lane, trunk road that connected the Portuguese coastal area and Spain (route IP 5). In a first phase, Low Cost Engineering Measures (LCEM) were applied, to improve the road characteristics; in a second step, exceptionally intense and severe law enforcement actions were employed by the police, to improve driver behaviour. Read more (485 kb).
Messages relating to regulatory requirements, warnings of hazards, directions, and other useful information can be conveyed to drivers and other road users by a number of means. These include:
The PIARC HFPSP guide discussed in Introduction includes actions to improve delineation or signage as possible remedial treatments for all of the three key requirements mentioned above, usually as a corrective measure to bring about a satisfactory resolution of the issue, or as a warning to indicate a potentially hazardous situation. Human factors considerations are critical in the design and provision of these treatments. The principal characteristics to be considered are:
Note that a Safe System is not created solely by communication with road users. However, clear indications of the expected driving actions, especially speed choice and clear warning of hazards, can do much to reduce the number of collisions and to mitigate the severity of those that do occur. Therefore, signing that matches user's needs human factors make important contributions to achieving a Safe System. It will have a critical contribution to crash reduction on road systems that fall short of Safe System requirements.
The case study from Slovenia highlights the use of human factors in road design.
How speed management works from the point of Human Factors
Speed has a significant effect on safety – it influences crash severity and reduces the anticipation and response time available for a given sight distance. The correlation between crash severity and speed is well documented. Small changes in speed have a significant effect on energy. So, it is not surprising that increased speed is considered as the biggest problem in road safety. Especially in the crash reports of the police increased or maladjusted speed is reported as the primary cause of crashes. In a lot of cases, inappropriate speed can be attributed to driver’s spatial perception on the road environment. As explained in the PIARC HFPSP the chosen speed depends on the interaction of human information processing and decision making on one hand and features of the road and its environment on the other hand. Modern science shows that the choice of speed, as well as the choice of position on the road, is mostly a subconscious process.
Most of the variables of the Human-Road Interface relate to physiological and neuronal mechanisms and affect the speed subconsciously. The following variables influence drivers speed and fatigue and therefore can also be used for an effective speed and fatigue management:
The following case studies from France, Italy, Singapore and Sweden all highlight different techniques and reasons for speed management.
CASE STUDY - Italy: Speed reduction schemes on urban collector roads
The case study describes a set of safety countermeasures in Via Pistoise (Rizenze, Italy), that is an urban collector road classified as a high accident concentration section. A detailed safety study has been undertaken to identify the possible applicable safety countermeasures. Accident analysis, road safety inspections and driving simulation studies were performed. The intervention to be implemented combines physical and perceptual treatments. Read more (PDF, 828 kb).
CASE STUDY - Singapore: Lower speed limit (40km/h) in Silver Zones
The case study covers the Silver Zone program implemented in Singapore since 2014. The program is designed to further enhance road safety of the elderly at large in the neighborhood precincts. Silver Zones aim to change the character of the street such that traffic movement is slowed down significantly and there will also be better walkability infrastructure to enhance road safety and first-and-last mile connectivity. Read more (1,177 kb).
CASE STUDY - Sweden: Bicycle passages and bicycle crossings
The project studies the consequence of a change in traffic law. On the 1st of September 2014 traffic law changed in Sweden. The change meant, among other things, that the concept of bicycle crossing was introduced and defined, with rules for the yield towards cyclists who are on or just traveling on a bicycle crossing, a new roads sign and requirements for local traffic regulations. In addition, it was stipulated that the traffic environment should be designed so it is not possible to drive vehicles at speeds higher than 30km/h. Read more (432 kb).
Traffic calming is the general term given to engineering techniques for encouraging lower speeds, and now includes a variety of well-documented treatments. The Institute of Transportation Engineers has a website that provides a comprehensive overview of traffic calming measures (ITE, 2013). Fact sheets are available for some of the most widely used types of devices, i.e.:
The website also has links to areas dealing with other types of treatments such as curb extensions, refuge islands, raised crosswalks and rumble strips; and links to topics such as speed reduction, accident frequency reduction, and reductions in cut-through traffic movements. A report from the UK’s Department for Transport provides a comprehensive summary of research on traffic calming (Department for Transport, 2007).
From the Human Factor point of view, they trigger the fixation in the nearer field of view and guide the attention to the places, or they break the straight road axis and with this also the straight view axis that increases speed. In case of road narrowing the measures increase the difficulty of driver’s task to hold the balance on a narrower road. That’s why they have not only a physical, but first an optical stopping effect.
Traffic calming principles have been widely applied in the establishment of low-speed zones in residential areas. This concept originally emerged in the Netherlands as the ‘woonerf’ or ‘living zone’; it has since been adopted in a number of countries under various forms. The key success factors are that the road network must carry low traffic volumes, the completed scheme must not be able to be traversed quickly, and the appearance of the streets should be changed.
In the UK, the first 20 mph zones produced substantial changes in speeds and crashes. A review found that the average speed reduction was approximately 14 km/h, the number of crashes fell by 60%, the number of crashes involving children fell by 70%, and the number of crashes involving cyclists fell by 29% (Webster & Mackie, 1996). Traffic flow within the zones fell by an average of 27%, and increased on the surrounding network by 12%. Despite this shift in traffic, there was little increase in crashes on these surrounding roads.
Combinations of treatments such as pavement markings, road narrowing, and signage have been used effectively to reduce the speeds through settlements. A report from the UK’s DETR provides a comprehensive summary of research on traffic calming, including gateway treatments (Figures 8.10 and 8.18). Low-level gateway treatments were found to reduce speeds by less than 5 km/h; more substantial treatments by up to 11 km/h; and the most substantial treatments, which involved narrowing of the carriageway, by up to 16 km/h (DETR, 2007).
Makwasha and Turner (2013) found speed reductions associated with gateway treatments in New Zealand. Consistent with previous research, they found that speed reductions were greater at pinch point gateways where the roadway had been narrowed compared to gateways that consisted of signage alone. Consistent with speed reduction data, there was a 41% reduction in fatal and serious injuries at pinch point gateways, but small increases in crashes at the ‘sign only’ gateways. This agrees closely with earlier work by Taylor and Wheeler (2000) in the UK, which found a 43% reduction in fatal and serious injury crashes for gateway treatments alone, but reductions of 70% in these crashes when accompanied by downstream traffic calming treatments.

Figure 8.18 Threshold treatment with identity feature, median island, and vehicle activated speed feedback sign - Source: Dr Peter Cairney.
A detailed hypothetical example of how a gateway treatment might be provided is discussed in the PIARC HFPSP guide. Gateways are also used at the entry to lower-speed zones within urban areas. However, as speeds are generally low at these points anyway, their effectiveness can be hard to evaluate (DETR, 2007). The case study from Germany shows an example of bundling the motorized vehicles to help organize traffic flow.
CASE STUDY - Germany: Areal improvement of the quality of stay by bundling the motorized traffic
In this project a central square in Brandenburg an der Havel was redesigned into a three-arm junction. Brandenburg an der Havel is a city with about 71.000 inhabitants in the region Brandenburg in north-east Germany. The Nicolaiplatz is a triangular square with an important function for the local traffic, located in the city centre, nearby the historic city of Brandenburg an der Havel. The sums of the traffic volumes of all access roads to Nicolaiplatz are approximately:15.000 vehicles, 450 city busses, 360 trams, 500 cyclists (estimated) per 24 hours. Before the redesign, the function and geometry of Nicolaiplatz was significantly influenced by the traffic facilities before the remodeling (see picture 1). The Bus- and Tram stops were spread over the entire square and the whole traffic infrastructure was disordered and unclear for both, motor vehicle traffic and local public transport. Furthermore, all facilities were outdated and not in a good condition. Read more (825 kb).
As mentioned in previous sections, road and traffic engineers have an effective array of techniques and devices available to provide information to the road user. If the basic road design creates a road environment and Gestalt that give consistent impressions on how to drive on that type of road the speed choice will be appropriate. This concept is generally referred to as a ‘road hierarchy’.
‘Self-explaining roads’ require a holistic approach in designing the road system and its immediate surroundings to make the required driving actions obvious to the driver. The European Commission website (EC, no date) describes self-explaining roads in the following terms:
Roads have different functions which require different traffic speeds and other driving actions, e.g. readiness to deal with cyclists and pedestrians (including young children). If these functions can be made explicit by the design and features of the road, it should be much easier to pre-programme the drivers to behave appropriately. A road that is truly self-explaining would make other aspects of driving demand obvious, such as which traffic stream should give way to another, when the driver is approaching an intersection or a curve, where pedestrians are likely to cross the road, and where the driver should position the vehicle to make a turn across a traffic stream. A self-explaining road would require few signs or line markings as the required driving actions would be conveyed intuitively by the way the road looks.
In the Netherlands, where the concept originated, four categories of road seem to be sufficient to cater for all needs (Theeuwes & Godthelp, 1995); these are:
Other countries may find that they need more categories to cover their full range of road types (e.g. rural access roads, urban collector roads). The important point is that roads can be designed to create different expectations about how road users should act on them.
A recent application of self-explaining roads principles in a suburb of Auckland, New Zealand demonstrates how appropriate design – in this case retrofitting an area with planting and other low-cost measures – can pre-programme the driving actions. After implementation, average speeds were lower on local streets but unchanged on collector roads. In both cases, the variability of speeds was reduced after implementation (Charlton et al., 2010). On local roads, vehicle numbers were reduced, vehicle lane keeping was less consistent, and signalling was less frequent. Also, pedestrian numbers increased, and pedestrians were less constrained in their movement patterns; however, these changes were not evident on the collector roads (Mackie et al., 2013). The authors interpreted these changes as indicating that a more relaxed, informal environment had been created on the local streets, consistent with the objectives of the project. These changed driving actions were accompanied by a 30% drop in crashes and an 86% reduction in crash costs.
Under a safe system, road authorities must look to establish a clear road hierarchy that effectively manages the potential conflicts between different road users. Ideally, each road should be defined as having either a function that facilitates high traffic flow or one that manages exchange between different road users, but not both. This then enables a (long term) planning and design framework that supports good neighbourhood planning, safe road layouts, and safe speeds to ensure road users are sufficiently physically protected.
Creating a clear functional hierarchy in the road network is an important planning tool and helps to define movement versus place priorities as well as appropriate Safe System infrastructure responses. Roads with a movement or flow function can accommodate higher volume, higher speed traffic but require separated facilities along the corridors if pedestrians and cyclists are present and intersections should be treated with roundabouts or traffic signals with raised safety platforms to manage speeds at crossing points. In areas or on roads where different road users mix, traffic calming measures such as lane narrowing, chicanes, speed humps, raised crossings, and landscaping are needed to create a lower speed environment. This includes establishment of large traffic-calmed areas where through traffic is kept out, or where vehicles use is discouraged except when people need to be inside this region.
The Movement and Place Framework is increasingly used to guide transport planning in delivering a more integrated transport system to improve customer outcomes and support a range of user groups. Work is already underway in some jurisdictions to integrate Safe System principles and treatments within the Movement and Place Framework to safely cater for all road users and enable more proactive and lasting road safety benefits. This is particularly important for the liveabilitiy of places and vibrant streets, where greater numbers of pedestrians and cyclists gather. They are inherently more vulnerable in crashes and, in some environments, highly exposed to the risk of crashes.
Austroads (2020) outline specific safety infrastructure measures for pedestrians and cyclists aligned to Safe System principles within a Movement and Place Framework.
The implications of self-explaining roads are especially profound for LMICs. The evidence is that drivers pick up powerful messages about the appropriate way to drive from the cues in the environment. Developments affecting parts of the road system that have customarily been used for social or commercial purposes should therefore be handled with particular care. If it is possible to retain the social or commercial function, then care should be taken to separate through traffic movements from the mixed activity area and ensure that a high-speed environment is not imposed on it. If it is not possible to retain the social and commercial functions, then a suitable alternative site for these activities should be found, and the new road facility which replaces the former mixed activity area and should be clearly identifiable as primarily a traffic facility, to improve driver behaviour. Read more (PDF, 241 kb).
Uncontrolled access and unplanned communities can also create uncertainty and potential hazards for all road users the report: Land use and Safety: an introduction to understanding how land use decisions impact safety of the transportation system discusses how land use (e.g., density, use, mix) and typical transportation factors (functional classification, context classification, transit availability, speed and access control/management can affect safety outcomes. The report provides examples of where and how land use and transportation decisions are made and explores several tools and techniques to improve safety in transportation and land use interactions.

Figure 8.19 - Modern Roundabout in Australia © ARRB Group
Addressing road-based fatigue is a key component of increasing road safety. Fatigue is well known to reduce and keep drivers from reacting to hazards. The outcome of this is the potential to increase crashes. In 2016 PIARC produced, The Role of Road Engineering in Combatting Driver Distraction and Fatigue Road Safety Risks. This important document highlights the problem with fatigue and distraction and outlines road safety countermeasure to combat this ongoing issue.
There is a clear distinction between fatigue, which occurs with time spent on a task, and drowsiness which varies according to the time of day and how much sleep a person has had. The terms are often used interchangeably as they often occur together and have similar debilitating effects on driving. A review for the UK Department for the Environment, Transport and the Regions (Jackson et al., 2011) concluded that fatigue affects driving skills in three ways:
The most effective ways of managing fatigue for professional drivers appear to be through workplace fatigue management programmes, supported by programmes to ensure that drivers come to work well-rested by addressing lifestyle issues. In-vehicle fatigue monitoring systems that analyse driver behaviour and warning signs to determine the onset of fatigue have the potential to be a highly effective tool for detecting the early stages of fatigue in drivers and minimise the likelihood of incidents. But for common drivers in general the road design has to ensure that the basic Human Factors principles of managing speed are realised in road design.
Roberts and Turner (2008) identified specific areas where infrastructure-based countermeasures might be effective. These include:
Opportunities to rest are likely to be beneficial. It is well-established that short periods of sleep can restore the performance of fatigued drivers. However, there is uncertainty about the location of these facilities in relation to high-risk sections of road, and about the best type of facilities to be provided at different locations.
Monotony reduction was thought to be worthwhile, but there was uncertainty about what type of monotony reduction would be effective because there is a lack of empirical and experimental data until yet. But it is well known that long straight roads without sufficient curvature are creating monotony based fatigue to drivers. Note that the PIARC HFPSP guide suggests the creation of ‘sinuous, rhythmic road alignments’ (i.e. gently winding roads) to counter monotony by providing a constantly changing visual field and an activation of the equilibrioception, especially the proprioceptive system. It also suggests that the number of bness and color contrasts in the lateral periphery of the field of view should be increased as also the fixation point should be limited in the nearer depth of the field of view (8.2.3). This can be achieved by changed height and kind of vegetation, special markings, colored pavements, changes of contrasts in the vertical scenery of buildings, in tunnels and similar optical countermeasures against monotony.
Signs and road markings increase the number of bness and color contrasts and are supportive against road triggered fatigue. They can also draw driver's attention to areas of high risk of fatigue crashes and advising of opportunities to rest at towns or rest areas were thought to have potential.
Audible line markings are raised thermoplastic lines which create a whirring sound when driven over, alerting the driver that the vehicle is drifting onto the shoulder (when applied as an edge line) or across the centre of the road into the opposing lane (when applied as a centre line). These have proved to be highly effective in reducing crashes, but generally do not generate a sufficiently loud signal to be effective for trucks. In countries where there is widespread use of asphalt construction on rural roads, an equivalent treatment can be produced at lower cost by creating depressions in the asphalt by means of a special roller, or by milling grooves in the road surface. This is not possible when the road is of sprayed seal construction , which is typical of many roads in LMICs and HICs with low population densities. Audible line markings can also be applied to concrete roads, either by the application of thermoplastic markings or by milling grooves in the road surface.
If these other measures fail to prevent a fatigue-related incident, then barriers and/or clear zones at appropriate points have the potential to avoid serious injury.
Even when road users have a good understanding of the road rules and traffic control devices, there may be situations or locations where they are unsure about the correct driving procedures. These situations generally arise in unfamiliar situations, e.g. when a site has unusual geometry, or where drivers find themselves sharing the road with unfamiliar things such as slow, oversize vehicles, or herds of animals being driven along the road. Ideally, a road user’s training and experience would have taught them to behave safely and wait until any unclear/unusual situation is resolved so that they can move or overtake safely. Over time, it would be hoped that situations with unusual or misleading geometry would be eliminated by the progressive treatment of hazardous locations as determined by crash records or risk analysis. In the meantime, care should be taken to ensure that correct guidance is given to all road users by means of signage, lighting, line marking and delineation. It is important to ensure that the package of guidance measures is properly understood, particularly if unfamiliar.
In addressing non-compliance with rules, it is important to consider the specifics of each situation. There are many possible reasons why road users do not comply with the rules, and more than one of them may be relevant in any particular situation. These different reasons require different strategies to encourage greater compliance.
It is possible that some road users may not understand what is required of them or what the appropriate behaviour is in certain situations. In some cases, this may even be the majority of drivers. This is particularly likely to be true of socially disadvantaged groups in the community, especially where literacy is an issue. It is also likely to be true of new situations; the case of the introduction of roundabouts in Australia and North America is a good example.
Depending on the situation, this can be remedied by actions such as:
Even when road users have a good understanding of the road rules and traffic control devices, there may be situations or locations where they are unsure about the correct driving procedures. These situations generally arise in unfamiliar situations, e.g. when a site has unusual geometry, or where drivers find themselves sharing the road with unfamiliar things such as slow, oversize vehicles, or herds of animals being driven along the road. Ideally, a road user’s training and experience would have taught them to behave safely and wait until any unclear/unusual situation is resolved so that they can move or overtake safely. Over time, it would be hoped that situations with unusual or misleading geometry would be eliminated by the progressive treatment of hazardous locations as determined by crash records or risk analysis. In the meantime, care should be taken to ensure that correct guidance is given to all road users by means of signage, lighting, line marking and delineation. It is important to ensure that the package of guidance measures is properly understood, particularly if unfamiliar signs are part of the treatment.
Rules and procedures are unlikely to be followed if they do not appear to be credible to road users, e.g. pedestrian reluctance to comply with ‘do not walk’ signals at crossings during periods of low traffic flow, or reluctance of drivers to comply with roadwork speed limit signs when it is obvious that no roadwork is in progress. The risk is that road users may continue to act in this way when hazards are in fact present, so that pedestrians cross unexpectedly in front of motor vehicles at night, or drivers continue to drive above the limit when roadworks have recommenced. While it is difficult to apply countermeasures in the first situation, close attention to the management of the worksite (e.g. by covering up the speed limit signs at the end of the day’s work) goes a long way to help in the second situation.

Figure 8.20 - Narrow road way may lead to centerline driving © ARRB Group
Many communities use the road space for purposes other than transport and in ways which conflict with road safety goals. In LMICs, roadside commerce is entrenched and is an important element in the economy. Street play has been a customary use of road space in many UK cities. Reducing speed limits in selected local areas in the UK to 20 mph (32 km/h), in conjunction with supporting traffic calming measures, has been very effective in reducing child pedestrian casualties. An early evaluation of these schemes indicated a 60% reduction in all injury crashes, and a 67% reduction in child injury crashes (Webster & Mackie, 1996). Creative solutions are called for in accommodating roadside commerce and increasing traffic flows in LMICs.
Apart from the official system of rules and regulations, the road safety culture of a community has a strong bearing on how road users behave and the resulting road safety outcomes. For example, peer pressure is an important mechanism for maintaining social norms or in some cases, engaging in behaviour that deviates from the norm.
The psychological and physical changes that people experience throughout their life-span have a profound influence on their ability to cope with the road system. If roads are to cater for the whole of the community, road designers and managers should have an awareness of the more salient age-related changes. Some of the main points are:
Short-term impairment can have disastrous effects on driving. Amongst the most frequent causes of impairment are:
Some forms of disability make it difficult for individuals to fully comply with road rules. Safe System principles require that drivers and riders be capable and proficient; and many jurisdictions have basic physical requirements which must be met before licences to drive or ride a motor vehicle are issued. The most widespread issue is eyesight, and elementary screening to ensure adequate visual acuity (clarity) at a specified distance is a usual part of the testing procedure. Few conditions prevent people from driving altogether, as many people with disabilities, even serious disabilities, are able to drive satisfactorily with the assistance of driving aids that help them overcome the limitations imposed by their disability. No such screening processes apply to pedestrians or cyclists. Many developed countries have anti-discrimination legislation that requires transport providers to ensure that disabilities do not impede access. On the road network, some treatments that are provided to meet these requirements are:
Achieving better compliance with legal requirements and established driving procedures can be considered under the four broad headings below. Each section concludes with a brief consideration of how the infrastructure can be used or adapted to support the activity discussed in the section.
Road safety education is generally considered to relate to programmes delivered in school.
The European Community (EC) ROSE25 project (Road Safety Education in all 25 EU Member States) involved workshops and consultations throughout the EC membership, culminating in a booklet which summarises the essential elements of good practice in road safety education. It focuses on face-to-face interactions with school age children. The key emphasis of road safety education should be on:
Although training and education should prepare drivers to ‘expect the unexpected’, there is a limit to which this can be achieved, and it is clearly not possible to train drivers to deal with unexpected situations. The best solution is therefore to minimise the number of non-standard situations through progressive improvements to the network, and apply self-explaining roads principles as widely as possible, and thus ensure that the PIARC Human Factor Guideline’s three rules are followed in all situations.
Driver and motorcycle rider training refers specifically to the process of preparing people for their ‘careers’ as drivers or riders. This entails not only mastering basic car control skills and a working knowledge of road rules and procedures, but the all-important skill of ‘reading the road’ and anticipating the actions of other road users. Road User Non Compliance in Other Means of Encouraging Road users to Behave According to the Rules cited work which showed that the more supervised driving practice a learner driver had, the safer they were after they began to drive solo. Many jurisdictions have introduced, or are about to introduce, requirements for extended supervised driving practice before taking a practical driving test.
A review of road safety measures in the European Community countries recommended reinforcing formal driver training by encouraging accompanied driving, and making advice and information available to the accompanying drivers to help them maximise their effectiveness (SUPREME, 2007). Good practice in driver and rider testing involves test drives or rides over nominated routes, which include all or most of the critical situations that the licensing authority deems are necessary to demonstrate competence, and that are assessed as being approximately equal in terms of their difficulty for test candidates. Licensing authorities should consult with road managers when identifying test routes to ensure that they choose appropriate routes that do not cause undue interference with other traffic or expose candidates or testing officers to avoidable risk.
Road authorities engage in publicity campaigns for a variety of reasons. The PIARC publication Best Practices for Road Safety Campaigns (PIARC, 2012a) provides an overview of this area, based on a literature review linked to a survey of selected PIARC members. The key messages relating to the delivery of campaigns are:
Roadside advertising space should be available for the display of safety messages, either by having some roadside advertising space reserved for this purpose or through the purchase of space at commercial rates. Where available, consideration should be given to the limited use of variable message signs to display safety messages that are appropriate to the time and place, e.g. displaying drink driving reminders in the early evening on weekends when many drivers and riders are heading out for the evening.
A good general source on enforcement appears to be the European Transport Safety Council’s (ETSC) publication, Traffic Law Enforcement across the EU: Tackling the Three Main Killers on Europe’s Roads (ETSC, 2011). This is a compendium of best practice, based on member countries’ experience. A comprehensive set of recommendations is provided for tackling each of the three main killers – speeding, drink driving and non-use of seatbelts – as well as general guidance on planning, target setting, and general principles of effective enforcement.
Much progress has been made with automated enforcement in recent years, in particular with speed enforcement. Significant changes in behavior have occurred where automatic enforcement has been vigorously applied. Where necessary, space should be created to allow enforcement operations to be conducted where they are likely to have a major deterrent effect. The raised lay-bys provided on UK motorways for speed enforcement are a good example. Positioning of speed cameras or other automated devices needs to be carefully considered to coordinate with other infrastructure where possible (e.g. positioning point to point speed cameras on existing gantries).
Human Factors issues are not as well catered for as they should be on most of the world’s roads, including those in HICs. A number of major in-depth crash investigations were carried out in the 1960s and 1970s that implied that driving actions carried out by the road user as the main contributing factor in most crashes. More recently, it has come to be understood that many of these driving mistakes were as much due to deficiencies in the road system as to failings on the part of the driver. These included crashes due to inadequate sight distance, poor lighting at critical points, poor transition zones, insufficient management of the field of view as well as misguiding drivers expectations and road surfaces that provided less friction than the driver was expecting.
HICs may therefore have a large backlog of road deficiencies to rectify to ensure that Human Factors needs of users are adequately integrated in their design standards and the practice to treat black spots and black lines across their networks. The same is likely to be true for LMICs. However, the road system cannot be brought up to standard unless the basic design tools – the road design standards and guidelines – take account of these issues. The PIARC study (PIARC, 2012b; PIARC, 2016) suggests that there is a long way to go before this can be achieved.
The driver demands associated with navigating a curve can serve as an example of how analyzing driver tasks can be helpful in understanding how road design impacts driver performance. Figure 8.21 describes the activities that driver would typically perform while navigating a single horizontal curve (Campbell et al., 2012). From Campbell's example, tasks like maintaining speed and lane position while entering and following the curve are more demanding and challenging and the driver needs to pay closer attention to basic vehicle control and visual information acquisition. Task analysis identifies the key information and vehicle control elements in different parts of the curve driving task.
Figure 8.21 illustrates how and when driver demands are influenced by design aspects such as design consistency, degree of curvature, and lane width. In particular, identifying highly demanding (or high workload) components of the curve driving task provide an indication of where drivers might benefit from information regarding delineation or benefit from the elimination of potential visual distractions.
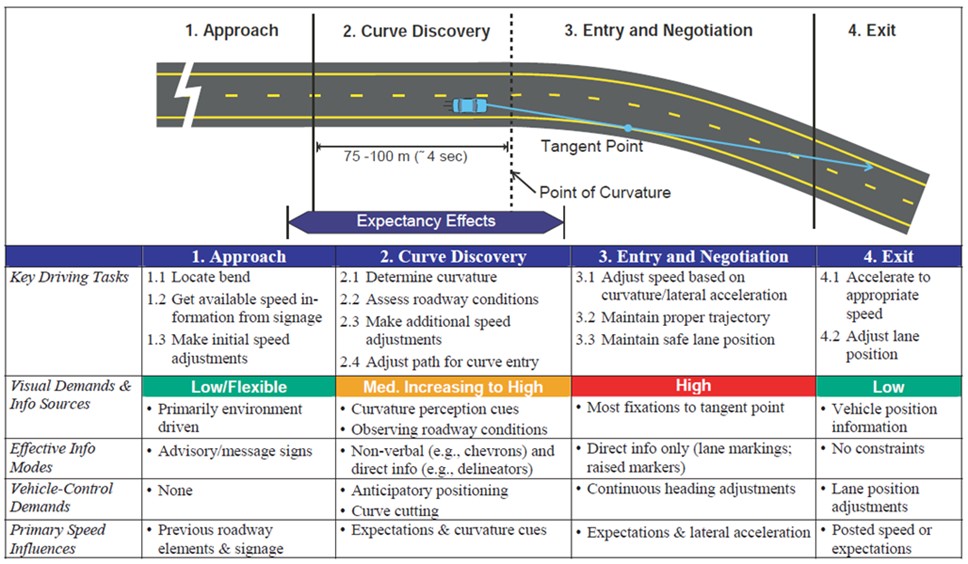
Figure 8.21 - Example of driver demands when navigating a horizontal curve (Campbell et al. 2012)
An expert Human Factors group examined the design standards from nine HICs and LMICs from across the world and systematically compared the advice and procedures in each standard with the specific Human Factors requirements which arise from the three Human Factors requirements described in the PIARC HFPSP guide (see Section 8.2). Requirement No.1, giving the driver sufficient time to react, was best catered for, with the specific driver needs being fully discussed in 49% of cases. Requirement No. 2, ensuring the road provides a safe field of view, was least well catered for, the specific needs being fully discussed in only 9% of cases. Requirement No. 3, that the road matches the road users’ expectations, was fully discussed in 34% of cases.
It therefore appears that much work remains to be done to bring the world’s design standards up to a level where Human Factors issues are fully addressed and to bring the thinking of designers along with them. In lieu of design standards that embed Safe System principles. Road Safety Audits provide a valuable means of evaluating the safety performance of road designs with consideration of Human Factors issues. Case studies from Canada and Iran present Road Safety Audits.
APEC 2011 Motorcycle and Scooter Safety Compendium of Best Practice: Motorcycle lanes (Malaysia). APEC, http://www.apec-tptwg.org.cn/new/Projects/Compendium%20of%20MSS/case_studies/Malaysia_motorcycle_lanes.html viewed Aug 14 2013
Austroad, 2020, Intergrating the Safe System with Movement and Place for Vulnerable Road Users, Research Report AP-R611-20. Austroads, Sydeney, Australia.
Birth, S, & Sieber, G, Staadt H, 2004. Straßenplanung und Straßenbau mit Human Factors. Ein Leitfaden. Ministerium für Infrastruktur und Raumordnung. Abt. 5, Straßenwesen, Straßenverkehr. Potsdam.
Birth, S., Pflaumbaum, M. & Sieber, G. (2006). HF-Training for Engineers. Intelligenz System Transfer GmbH. Potsdam
Campbell, JL, Lichty, MG, Brown, JL, Richard, CM, Graving, JS, Graham, J, O’Laughlin, M, Torbic, D & Harwood, D, 2012, Human Factors Guidelines for Road Systems (2nd ed.) National Cooperative Highway Research Program, report 600.
Campbell, JL, Torbic, DJ, Hoekstra-Atwood L, Monk, C, Potts, IB, 2023, Informing the Selection of Countermeasures by Evaluating, Analyzing, and Diagnosing Contributing Factors that Lead to Crashes, National Cooperative Highway Research Program, NCHRP 22-45.
Carlsson, A, 2009 Evaluation of 2+1 roads with cable barriers rapport 636, VTI; Linkoping, Sweden.
Charlton, SG, Mackie, HW, Baas, PH, Menenzes, M & Dixon, C, 2010 Using endemic features to create self-explaining roads and reduce vehicle speeds, Accident and Analysis and Prevention, 42, pp1989-1998.
Cohen, A. S.; Imholz, J.; Siegrist, J.: Erforderliche Abweichung zwischen Blick- und Fahrtrichtung für die sichere Fortbewegung beim Befahren von Engpässen. In: Schlag, B. (1997). Fortschritte der Verkehrspsychologie 1996. Deutscher Psychologen Verlag
Department for Transport, 2007, Traffic Calming: Local Transport Note 1/07, UK Department for Transport, TSO (The Stationery Office), London, UK.
Edquist, J and Corben, B 2012 Potential application of shared space: principles in urban road design: effects on safety and amenity, Monash University Accident Research Centre, report to the NRMA ACT Road Safety Trust.
ETSC, 2011, Traffic Law Enforcement across the EU: Tackling the Three Main Killers on Europe’s Roads, http://www.etsc.eu/documents/Final_Traffic_Law_Enforcement_in_the_EU.pdf, viewed August 20 2013.
European Commission, no date, Mobility and Transport, Road Safety, Self-explaining Roads, European Commission http://ec.europa.eu/transport/wcm/road_safety/erso/knowledge/Content/15_road/self_explaining_roads.htm, viewed 23 August 3013.
Federal Highways Administration, 2010, Safety Benefits of Walkways, Sidewalks, and Paved Shoulders, Federal Highways Administration, http://safety.fhwa.dot.gov/ped_bike/tools_solve/walkways_brochure/walkways_brochure.pdf, viewed 18th May 2015.
Forbes, TX, 1939, A Method for the Analysis of the Effectiveness of Highway Signs, Journal of Applied Psychology, vol 23, pp.669-84.
Herberg, K.-H.: Auswirkungen des Straßenbildes und anderer Faktoren auf die Geschwindigkeit. In: Flade et.al. (1994). Mobilitätsverhalten. Bedingungen und Veränderungsmöglichkeiten aus umweltpsychologischer Sicht. Weinheim: Beltz, Psychologie –Verlags –Union.
Hussain, H., Radin Umar, R. S., Ahmad Farhan, M. S., & Dadang, M. M. 2005, Key components of a motorcycle-traffic system - A study along the motorcycle path in Malaysia. [PDF] IATSS Research, 29(1):50-56.
ITE 2013 http://www.ite.org/traffic/
Jackson, P; Hilditch, C, Holmes, A, Reed, N, Merat, N & Smith, L, 2011, Fatigue and road safety: a critical analysis of recent evidence, Road Safety Web Publication, NO: 21, Department for Transport, London.
Klebelsberg, D. (1963). Eine Methode zur empirischen Ermittlung des “psychologischen Vorrangs” In: Leutzbach, W.; Papavasiliou, V (1988). Wahrnehmungsbedingungen und sicheres Verhalten im Straßenverkehr: Wahrnehmung in konkreten Verkehrssituationen. Bericht zum Forschungsprojekt 8306 der Bundesanstalt für Straßenwesen, Bereich Unfallforschung, Nr. 177.
Lynam, D. A. and Lawson, S.D., 2005, Potential for risk reductions on British inter-urban major roads. Traffic Engineering and Control, Vol 46, # 10, pp 358-361
Mackie, HW, Charlton, SG, Baas, PH & Villasenor, PC, 2013, Road user behaviour changes following a self-explaining roads intervention, Accident and Analysis and Prevention, 50, pp 742-750.
Makwasha, T & Turner, B, 2013, Evaluating the use of rural-urban gateway treatments in New Zealand, Proceedings of the 2013 Australasian Road Safety Research, Policing & Education Conference, 28th – 30th August, Brisbane, Queensland.
NHTSA, 2013, Countermeasures That Work: A Highway Safety Countermeasure Guide for State Highway Officers Seventh Edition, 2013, National Highway Traffic Safety Administration, Washington, DC.
PIARC 2012a, Best Practices for Road Safety Campaigns Report 2012R28EN, World Road Association, Paris, France.
PIARC, 2012b, Human Factors in Road Design. Review of Design Standards in Nine Countries, Report 2012R36-EN, World Road Association, Paris, France.
PIARC, 2019, Human Factors Principles of Spatial Perception for Safer Road Infrastructure World Road Association, Paris, France.
PIARC, 2016 Human Factors Guidelines for a Safer Man-Road Interface, Report 2016R20-EN Paris, France.
PIARC, 2016 The Role of Road Engineering in Combatting Driver Distraction and Fatigue Road Safety Risks, Report 2016R24-EN Paris, France.
PIARC, 2017 Land Use and Safety: An Intorduction to Understanding How Land Use Decision Impact Safety of the Transportation System, Report 2016R32-EN Paris, France.
Radin Umar, R. S., Mackay, G. M., and Hills, B. C. (1995). Preliminary analysis on impact of motorcycle lanes along Federal Highway F02, Shah Alam, Malaysia. Journal of IATSS Research, 19(2):93-98.
Radin Umar, R. S., Mackay, M., and Hills, B. (2000). Multivariate analysis of motorcycle accidents and the effects of exclusive motorcycle lanes in Malaysia. Journal of Crash Prevention and Injury Control, 2(1):11-17.
Richter, P., Wagner, T., Heger, R. & Weise, G. (1998). Psychophysiological analysis of mental load during driving on rural roads – a quasi-experimental field study. Ergonimics, 41(5): 593-609
Roberts, P and Turner, B, 2008, Scoping study to assess road safety engineering measures to address fatigue, ARRB Group, Vermont South, Victoria, Australia.,
ROSE 25 (2005) Good Practice Guide on Road Safety Education, European Community, viewed 21 August 2013.
Taylor, M &Wheeler, A 2000 Accident reductions resulting from village traffic calming schemes European Transport Conference, 2000, Cambridge, United Kingdom, VOL: P 444, pp163-74.
Theeuwes, J & Godthelp, H 1995, Self explaining roads, Journal of Safety Science, 19, 217-225.
Tung, S. H., Wong, S. V., Law, T. H., and Radin Umar, R. S. (2008). Crashes with roadside objects along motorcycle lanes in Malaysia. International Journal of Crashworthiness, 13(2):205-210.
Webster, DC & Mackie, AM, 1996 Review of Traffic Calming Schemes in 20 mph Zones, Transport Research Laboratory, report no 125.
Zwielich, F., Reker, K.; Flach, J. (2001). Fahrerverhaltensbeobachtungen auf Landstraßen am Beispiel von Baumalleen. Eine Untersuchung mit dem Fahrzeug zur Interaktionsforschung Straßenverkehr. Berichte der Bundesanstalt für Straßenwesen, Reihe Mensch und Sicherheit, Heft M 124
The Road Safety Management System provided information on the broader management of road safety, while Road Safety Targets, Investment Strategies Plans and Projects highlighted the need for effective road safety targets, policies and plans at the national and jurisdictional level. This chapter moves the focus to the importance of policies, standards, guidelines and tools relating to road safety infrastructure. The planning, design, operation and use of the road network will only produce effective results when interventions (including safe infrastructure programmes and projects) are implemented as part of an effective management system. An evidence-based approach is required that links institutional management functions to interventions, which in turn produce desired results. Details of this road safety management process are provided in The Road Safety Management System.
Information is provided on the development of policies, standards and guidelines, as well as tools to assist in delivering safe infrastructure. The introduction provides general principles of infrastructure safety management, drawing on material presented in earlier chapters (see especially The Road Safety Management System and Road Safety Targets, Investment Strategies Plans and Projects). It also sets a framework for later chapters by providing the overall approach to the assessment and treatment of road infrastructure for effective road safety outcomes. This approach involves the assessment of risk (identifying high risk locations discussed in detail in Assessing Potential Risks And Identifying Issues), identifying the issues contributing to these crashes (also in Assessing Potential Risks And Identifying Issues) identifying and selecting appropriate solutions (Intervention Selection And Prioritisation), prioritising action (also in Intervention Selection And Prioritisation) and monitoring, analysis and evaluation (Monitoring, Analysis and Evaluation of Road Safety). This overall process is graphically represented in Figure 9.1:

Figure 9.1 The infrastructure risk assessment process
Start by assessing what infrastructure safety policies you have, and tools you already use, and assess whether these are the best for your situation. The information in this chapter will help identify required policies.
Train key staff to understand infrastructure safety management, and especially the principles provided under the Safe System approach (The Safe System Approach).
Collect and analyse crash data, as well as other intermediate data, starting with high risk routes (see Effective Management And Use Of Safety Data.
Start to develop tools to assess risks, initially through corridor and area demonstration projects utilising existing crash data as well as analysis of road deficiencies (see Management Tools).
Knowledge on effective interventions is required. Information on this issue is available in this manual (Intervention Selection And Prioritisation).
Staff need to be trained in the use of road safety infrastructure management tools.
In general, it is believed that driver error contributes to a large proportion of road crashes, with some studies suggesting that human error has played a role in over 90% of crashes (e.g. Sabey, 1980; Treat, 1980). Although the role of human error in road crashes is substantial, such figures downplay the significant role that infrastructure can have in achieving Safe System outcomes (also see the discussion on this issue in The Safe System Approach).
When a crash occurs, road infrastructure has the most significant influence on the severity outcome of a crash. Improvements to infrastructure can contribute substantially to reductions in death and serious injury.
Findings from Sweden identified that road-based factors were most strongly linked to a fatal crash outcome. Stigson et al. (2008) reviewed fatal crashes based on in-depth crash investigation, with crashes categorised based on factors that contributed to the crash outcome (as opposed to crash causation). The study identified that there were strong interactions between the three system components (vehicles, road infrastructure and road user issues), but that road-based factors were most strongly linked to a fatal crash outcome.
Further evidence of the role infrastructure plays in fatal and serious injury crash outcomes can be found from research that investigates the benefits of infrastructure safety treatments. Various studies have identified that well-designed infrastructure (such as roundabouts and protective barrier systems) can reduce fatal and serious injury crash outcomes by up to 80%. This reduction can occur regardless of whether crashes were the result of human error (also see Design for Road User Characteristics and Compliance). For further information on effective treatments, see Intervention Selection And Prioritisation.
There is a strong economic argument for the provision of safe infrastructure. Examples exist from many countries that demonstrate the benefits from targeted road safety improvements. OECD (2008) identified that such targeted improvements can deliver up to 60 times the benefit compared to the cost (i.e. for every $1 spent, benefits of up to $60 in terms of crash cost savings can be achieved). As identified by the UNRSC (2010), few other infrastructure investments produce the economic benefits of infrastructure targeted at improving road safety. Take for instance the installation of cable median barrier to reduce cross median crashes as this has become common practice in some nations (for instance Sweden and the United States). Even more substantial investment programmes are able to return substantial safety benefits when compared to their costs. An analysis undertaken by iRAP (www.irap.org) on improvements to road infrastructure on the worst 10% of roads (i.e. those roads with greatest number of death and serious injury) in each country identified substantial potential gains when comparing the costs with the benefits. The average over all countries was a benefit-cost ratio (BCR) of 8:1 (i.e. $8 worth of benefits for each $1 invested). This ranges from a BCR of 5:1 in high-income countries, to 19:1 in upper middle income countries over a 20 year period.
The European Commission, under the Horizons 2020, developed the SafetyCube project as an innovative road safety Decision Support System (DSS). The intent of this effort was to allow policy-makers and stakeholder the ability to select and implement the most appropriate strategies, measures and cost effective approaches to reduce casualties of all user types and all severities in Europe and worldwide (see: SafetyCube). The United States also has the Crash Modification Clearinghouse the includes over 7000 (2019) interventions and the potential crash reduction for each countermeasure (See: Crash Modification Clearinghouse). Both of these tools provide significant information and resources on the use of road infrastructure to reduce crash potential.
A solid understanding of key infrastructure principles is required by road agencies and others responsible for delivering road safety. Some of the key elements of relevance to the development of infrastructure policy, standards, guidelines and tools include:
Guidance on the risk assessment process has been developed across many different industries and activities, including road safety. The process (briefly introduced in Figure 1) involves the identification of high risk locations; analysing data to determine the cause of this risk; identifying evidence-based solutions that are effective in addressing the risk; implementing these solutions; and then monitoring and evaluating the outcome. Each of these stages is explained in detail in Assessing Potential Risks And Identifying Issues to Monitoring, Analysis and Evaluation of Road Safety.
In broad risk assessment terms, the chance of sustaining death or serious injury can be decreased by reducing the:
With an understanding of these factors, crashes can be influenced in a number of ways through changes in the road environment. As examples, improvement in safety can be gained from:
Engineering-based treatments generally work by influencing one or more of these factors. Examples of such treatments and their effectiveness can be found in Project-level and Network-level Approaches.

© ARRB Group
Standards, guidelines and tools are the mechanisms that support the consistent interpretation and delivery of policies. Policies set the framework for road safety activity, and without these, delivery of road safety is reactive and lacks structure. The policies will often set the direction at a high level and will also contain direction on how to achieve standards using a predetermined set of criteria. Guidance on strategy and policy development can be found in Road Safety Targets, Investment Strategies Plans and Projects and in Development of Policies, Standards and Guidelines in Policies, Standards and Guidelines. These Policies, standards and guidelines are often slow to change, either because of lack of research, unwillingness to change current practice or lack of knowledge related to the given system.
Changing established practice is often difficult, and careful management of this process is required. Strong leadership is needed to facilitate policy shift, and this needs to happen in parallel with an update of corresponding policies, standards and guidelines. Change requires understanding and awareness, the desire to create change, the knowledge to implement the change, and the ability to do so within the environment or system an individual works within.
Once policies are set, there is need for linkage to standards guidelines and how the associated criteria for meeting the standards can be achieved. Standards (as well as road rules and regulations) dictate those things that must be done to achieve a predetermined level of quality or attainment. In many countries standards also have a legal basis that are adopted in design and operational manuals. Criteria are the specifications for achievement of the standards and are typically detailed as policy. Guidelines provide direction on how things should be done but are not necessarily requirements. In contrast to established policy and standards, there is scope to deviate from the advice provided in guidelines, but this must be justified and assessed for the impact on safety outcomes. When deviating from policies and standards documentation outlining the reasoning is often used. Policies and standards are typically based on many years of experience and outcomes from research and understanding. Guidelines, because they are not requirements may contain reasoning for how the standards and policies were developed, how to apply them in different circumstances, and might provide ranges of values to consider based on the conditions encountered.
It is important to note that compliance with policy, standards and guidelines does not mean that safety will be maximised, nor minimised when they are not achieved. There are many examples where new roads have been built to standard but have a less than desired safety outcome. Policy, standards and guidelines are often dated, and may not include adequate content based on Safe System principles. The manuals that contain the policies, standards and guidelines, generally offer the minimum acceptable values for design. Departing from the minimum requirements sometime occurs when the financial, environmental, of way, or social cost are high and the relative change in safety risk is low. These tradeoffs are often documented to discuss reasoning for not achieving the policy, standards or guidelines.
There is much to be gained by looking to other countries for guidance on setting new policies, standards and guidelines, and such an approach is important for benchmarking (also see Country Management System Framework in Management system Framework and Tools). However, often safety policies, standards and guidelines are directly copied from other countries without due consideration of local conditions, design for vulnerable road users, different vehicle types and road user compliance.
Also, in many circumstances, policies often provide fewer options for use in constrained environments. It is typical that several compromises need to be made in road design. When combined, these issues can lead to poor safety outcomes (also see the discussion in Global Level in Policies, Standards and Guidelines on minimum criteria, and the concept of extended design domain). Typically, an assessment of the likely road safety impact is required to ensure that safety objectives are met. It is for this reason that approaches such as road safety audit (see Road Safety Audit in Proactive Identification) are required, and that when undertaken, these are not just a check against standards and guidelines.
Knowledge of the safety implications of design decisions is constantly improving, and with this there is sometimes a need to update policies and procedures. This includes the need to update standards, guidelines and tools.
Box 9.1 indicates how a policy decision that was initially driven by economic reasons at the political level has resulted in safer road design principles on major roads in New Zealand.
New Zealand has recently implemented a policy to improve the safety standard on Roads of National Significance (RoNS). The initial motivation for this policy was as part of an economic stimulus package, and investment through this programme was focused on the movement of freight and people more efficiently and safely, particularly around the main population centres. Currently, there are seven RoNS, each of which are key state highway links. As part of the national safety strategy, each of the RoNS will need to attain at least a four-star safety rating under KiwiRAP (the New Zealand risk assessment programme; NZ Ministry of Transport, 2013). A review of design standards was undertaken to ensure that this safety rating is reached. Key design elements to change to ensure this safety outcome are: the use of centre-of-road wire rope barrier, and roadside barrier systems. These treatments are aimed at targeting run-off-road and head-on crashes, two of the key severe crash types on New Zealand roads.

© ARRB Group
Delivery of road safety infrastructure does not occur in isolation, and it is important to consider broader safety, road management and societal issues when developing policies, standards and guidelines. Similarly, it is important to advocate for road safety outcomes when developing broader transport and related policies. The Belize case study provides a useful demonstration of linking infrastructure improvements to other safety improvements. Land use measures have a strong linkage to safety outcomes, an issue that is often overlooked in LMICs. Such measures define the type and intensity of the generated traffic, and the way it enters and exits the roadway. A detailed discussion on this issue can be found in Impacts of a Safe System Adoption on roles and Responsibilities of Authorities.
There are also links that can be made with broader policy agendas, as illustrated by the case study from the Netherlands.
As a further example, asset management involves maintaining and upgrading road infrastructure, and this typically has road safety implications. It is often the case that planning and funding for asset management and road safety outcomes occur in isolation, and without adequate linkages between the two and this can impact how a project is ultimately designed and constructed. Both activities are closely linked, with each directly influencing the other. Adequate knowledge of the safety implications of asset decisions is required when establishing policy and practice. Similarly, safety decisions can have a substantial impact on asset management (particularly costs for maintaining assets). For instance, the installation of unnecessary roadside crash barrier on flat slopes would increase the potential for crashes, increase maintenance and replacement costs, and not reduce the injury potential. When installed correctly the crash barrier systems can be used to shield other assets from impacts, close gaps in locations where injury potential is high and protect workers who may need to maintain the assets.
When considered in isolation, the two road management approaches are often thought to act in conflict. There may be a perception that increases in funding for road safety may mean less funding or increased expenditure for asset management. However, there is some clear evidence that the two can act in harmony to produce benefits that are greater than those that can be delivered when considered in isolation.
Specific examples from LMICs are scarce, but the example in Box 9.2 from Australia serves to illustrate the level of benefits that can be gained through a coordinated approach. Combining the safety benefits with those from asset improvements can often lead to better project viability. This issue is discussed further in Roles, Responsibilities, Policy Development and Programmes.
The Asset Management Branch of the Department of Infrastructure, Energy and Resources in Tasmania has developed a sustainable maintenance plan which is aimed primarily at preserving road pavement assets, including extending the lives of existing roads through pavement reconstruction, strengthening and resurfacing. Where an existing road is below departmental standards, cross-section improvements are usually made during reconstruction. This includes increasing the carriageway width, shoulder width and shoulder type, with sealing an option on some roads. Other elements, e.g. embankments, side slopes and drainage improvements, will also be undertaken.
As part of the analysis that underpins the Department’s plan, a study demonstrated that where pavement reconstruction was accompanied by cross-section improvements, in general, total crashes were considerably reduced, with an estimated social cost saving of approximately AUD$36 million. The corresponding marginal benefit cost ratios (MBCR) improved from 5 to 9 when these additional safety and travel time benefits were included (i.e. society could gain $8 compared to $4 per additional $1 invested when the safety benefits were added). The significant increase in MBCR was because many of the benefits were not being counted, i.e. the asset managers did not account for the safety and travel time benefits of their programme, noting that 89% of the additional benefits were due to estimated crash reductions.
Whilst this is clearly a worthwhile achievement, the potential reduction in crashes for the whole network was identified as being up to five times greater if cross-section deficiencies were addressed independent of pavement reconstruction. Thus, maximising benefits requires consideration of total needs.
Roles, Responsibilities, Policy Development and Programmes provides direction on the development of policies for road safety outcomes. This includes the need to understand current road safety challenges and opportunities through the analysis of data; and the development of a road safety plan that includes appropriate strategies, priorities, measurable targets and potential interventions. The development of infrastructure policy follows the same process and should be considered as part of broader road safety policy development. Safety modifications occur on projects of all types, not just safety oriented projects. Consideration of how safety modifications will occur with projects outside of safety program is important.
GRSF (2009) provides advice for countries that are establishing road safety capacity (i.e. LMICs) in terms of their investment strategies (also see The Road Safety Management System), and this advice is useful for development of policies, standards and guidelines. The advice suggests that the initial focus for such countries should be targeted on high crash density demonstration corridors and urban areas. The value of this demonstration corridor approach has been discussed throughout this manual, including the case study from Belize.
GRSF (2009) also discussed the need to review and benchmark safety policies and interventions with other countries, and that this should lead to the commencement and implementation of reforms. This advice is equally relevant to road agencies attempting to implement new infrastructure policies. In order to focus attention to the highest priority areas, and to build capacity through doing, policies to address crashes at these locations can be addressed as a priority. Similarly, awareness of successful approaches adopted in other countries, and movement towards such approaches is a valuable method.
Little guidance exists on the mechanisms for transforming road infrastructure safety policy into relevant standards and guidelines although Beagle, et al (2015) provide an example approach. Rather, there are a number of examples that highlight what can be achieved. Many countries have developed their own standards and guidelines, and in some cases, these may be adopted for use in other countries (although as noted elsewhere, caution should be used where the context is different). Croft et al. (2010) provides some advice based on the development of national guidelines in Australia. Some of the key elements from this process were that these were produced:
There is a need to constantly review standards, policies and guidelines, and to improve these based on recent innovations. Updating these elements does not suggest that previous designs are unsafe, as updating is done to reduce crash potential based on new scientific evidence and knowledge. An evidence-based data driven approach is required to ensure that expected safety benefits from any changes are attained. Benchmarking of approaches used in countries that perform well in safety is a good step to helping identify possible innovations. Further analysis may be required to ensure that changes will have a positive safety benefit when applied in a different country. Demonstration projects to trial new innovations are useful to establish whether such changes are beneficial in a controlled environment. Once evaluated and shown as successful these can be applied more broadly, and recommended changes reflected in appropriate guidance documents.
There is no set template for the development of policies, standards and guidelines, and those countries that do have comprehensive coverage of these vary in content, often reflecting local conditions. For those who wish to develop or improve policies, standards and guidelines it is beneficial to benchmark against good performers and draw upon international and regional examples of good practice. The sections below outline examples at global, regional and country levels, and may serve as a starting point in this exercise. The case study from India is an example of how to drive policy changes in road safety.
There has been a significant shift in road safety policy in recent years in response to the Safe System approach. This issue, including the origin of the approach and its implications, are discussed in detail in The Safe System Approach. The Decade of Action for Road Safety, described in Key Developments in Road Safety, has also resulted in some significant policy shift. At the international level, the UN Road Safety Collaboration (UNRSC) has developed a Global Plan that includes policy guidance on safe roads and mobility (also see The UN Decade of action and global plan). The plan states that the purpose of this pillar is to:
The plan suggests that this can be achieved by six key activities, namely to:
Details on how each of these activities might be delivered can be found in Box 9.3. Individual countries will need to assess how they respond on each of these activities, but the information provides a useful checklist of actions that can be undertaken to improve the management and delivery of safe roads.
Activity 2 Promoting the needs of all road users as part of sustainable urban planning, transport demand management and land-use management by:
Activity 3 Promote safe operation, maintenance and improvement of existing road infrastructure by requiring road authorities to:
Activity 4 Promote the development of safe new infrastructure that meets the mobility and access needs of all users by encouraging relevant authorities to:
Activity 5 Encourage capacity building and knowledge transfer in safe infrastructure by:
Activity 6 Encourage research and development in safer roads and mobility by:

© ARRB Group
Still at the global level, the UNRSC (2010) in their Safe Roads for Development document highlight some priority infrastructure policies, particularly in relation to LMICs. They suggest that priority crash types be targeted on high risk roads. Crash types include those involving vulnerable road users walking or cycling across or along the road; head-on crashes; side impacts at intersections; and run-off-road crashes. High risk roads refer to the small proportion of the world’s roads where the majority of fatal and serious injury crashes occur. They highlight that in the UK, just 10% of roads account for more than half of all road deaths, and around a third of all serious injuries. They also suggest that in Bangladesh, 3% of the arterial road network accounts for 40% of road deaths.
The priority actions for these roads and crash types include that:
Linked to this international policy context, a number of global guidelines have been produced to help address road safety. Produced by the World Health Organisation (WHO), Global Road Safety Partnership (GRSP), FIA Foundation and the World Bank, guidelines exist on various elements linked to road safety infrastructure. Of greatest interest to the audience of this manual are the guidelines on data systems (as discussed in Effective Management And Use Of Safety Data), and speed management and pedestrian safety. Other global guidelines exist on helmets, seatbelts, child restraints, and drinking and driving. All of the guidelines can be downloaded from the WHO website (http://www.who.int/roadsafety/publications/en/).
PIARC (2012) conducted an important review of national road safety policies and plans. This addressed policies for infrastructure improvements, and included the following key conclusions:
This current document is obviously the key guidance document produced by PIARC on road safety infrastructure. In addition, there are many other important documents relevant to road safety policy and guidance that can be accessed from the PIARC website. These cover design and development of road infrastructure, road safety audits, safety on construction zones, vulnerable road users, road operation, road safety in winter conditions, road tunnels and others. The documents include those listed in Box 9.4
Vulnerable road users: Diagnosis of design and operation safety problems and potential countermeasures (2017 – 2016R34EN)
Land use and safety: an introduction to understanding how land use decisions impact safety of the transportation system (2017 – 2016R32EN)
The role of road engineering in combatting driver distraction and fatigue road safety risks (2016 – 2016R24EN)
Human factors guidelines for a safer man-road interface (2016 – 2016R20EN)
Fixed fire fighting systems in road tunnels: Current Practices and recommendations (2016 – 2016R03EN)
Improving safety in road tunnels through real-time communication with users (2016 – 2016R06EN)
Road accident investigation guidelines for road engineers (2013 – 2013R07EN)
Comparison of national road safety policies and plans (2012 – 2012R31EN)
Road safety inspection guidelines for safety checks of existing roads (2012 – 2012R27EN)
Human factors in road design. Review of design standards in nine countries (2012 – 2012R36EN)
State of the practice for cost-effectiveness analysis, cost-benefit analysis and resource allocation (2012 – 2012R24EN)
Best practices for road safety campaigns (2012 – 2012R28EN)
Taking advantage of intelligent transport systems to improve road safety (2011 – 2011R03EN)
Road safety audit guidelines for safety checks of new road projects (2011 – 2011R01EN)
PIARC catalogue of design safety problems and potential countermeasures (2009 – 2009R07EN)
Tools for road tunnel safety management (2009 – 2009R08EN)
Human factors guidelines for safer road infrastructure (2008 – 2008R18EN)
Human factors and road tunnel safety regarding users (2008 – 2008R17EN)
As well as supporting the UNRSC in the development of the Global Plan, the World Bank Global Road Safety Facility has produced a number of policy and guidance documents, many aimed specifically for use in LMICs. Comprehensive resources to assist in the delivery of safe road infrastructure can be found on the Facility’s website (http://go.worldbank.org/9QZJ0GF1E0).
Regional policy for the delivery of safe infrastructure can also be found, most notably in the EU Directive 2008/96/EC. Issued in November 2008, this directive covers the trans-European road network, although it is suggested that the provisions of the Directive can be applied to the national road network. Separate European guidance on the secondary road network can also be found (see e.g. Polidori et al., 2012).
Provisions of the Directive include that:
The Directive also highlights the need to adopt guidelines to support these activities, and provides content on appropriate training, exchange of best practice and continuous improvement. A recent review of the Directive (European Commission, 2014) indicated that more systematic processes had been put in place in EU countries to safely manage infrastructure as a result of the Directive.
Further details on the approaches highlighted above can be found in Assessing Potential Risks And Identifying Issues.
Regional approaches to road safety in LMICs have also been developed, often under the Development Bank, UN Regional Commission, or regional economic grouping leadership. As an example, the Asian Development Bank (ADB) has developed a Sustainable Transport Initiative that directly addresses road safety through a Road Safety Action Plan for the region (www.adb.org/documents/road-safety-action-plan). This discusses the mainstreaming of road safety within areas of ADB operations. An ADB Road Safety Group has been established, and one of the objectives of this group is to make available key reference documents, terms of reference, guidance, and tools for use by those in the region. The summary document ‘Improving Road Safety in Asia and the Pacific’ provides useful advice and reference material on road safety based on recent ADB experience (see http://www.adb.org/sites/default/files/evaluation-document/36104/files/road-safety.pdf).
The case study in Key Developments in Road Safety describes the regional approach that was taken in the development of the African Road Safety Action Plan (2011–20). The development of this plan involved a wide range of stakeholders. At the country level, different approaches have been taken to the development of policy, and provision of relevant infrastructure standards and guidelines. This is often in response to different local context, including different legislation or safety issues. As identified elsewhere in this manual, there is typically no one correct approach to successfully managing road safety. However, there are often general principles that are universal.
In the United States, the Highway Safety Manual (AASHTO, 2010) provides detailed guidance on the roadway safety management process. The approach proposed is broadly aligned with that used in many countries, and it is no coincidence that the approach mirrors the structure of Planning, Design and Operation of this manual, particularly Assessing Potential Risks And Identifying Issues to Monitoring, Analysis and Evaluation of Road Safety. The process includes keys steps, from network screening (identifying and ranking sites) to safety effectiveness evaluation (monitoring effectiveness).
Pre-dating the Highway Safety Manual, AASHTO produced a series of guides to assist in the delivery of the Strategic Highway Safety Plan. This comprehensive suite of 20 guides provides direction on key strategic issues. Those relating to road infrastructure include guides on addressing collisions with trees in hazardous locations, head-on collisions, unsignalised and signalised intersections, run-off-road collisions, collisions on horizontal curves, utility poles, pedestrians and work zones. These documents can be downloaded from the Highway Safety Plan website (http://safety.transportation.org/guides.aspx).
Other countries have a similar set of guidelines to advise on effective road safety infrastructure management. For example, the Austroads Guide to Road Safety (currently in nine parts) provides guidance for Australia and New Zealand (see www.austroads.com.au); the Dutch have the Road Safety Manual (CROW, 2009) and Advancing Sustainable Safety (Wegman & Aarts, 2006); and the UK has the Good Practice Guide (DTLR, 2001). These documents are accompanied by many other relevant standards and guidelines in each country. As an example, Certu, the Centre for the study of urban planning, transport and public facilities in Lyon, France has produced a number of guides and reference documents (some of which have been translated into English; see http://www.territoires-ville.cerema.fr/). Also from France is the Transportation Safety in Urban Area: Methodological guide (Certu, 2008; available in French and English).
Although all of these documents are technically sound and serve as a useful basis for infrastructure safety management, as identified above, care should be taken when translating these guidelines to other countries. Different approaches, and particularly different solutions, may be more appropriate when the context (including traffic mix) is different.
As already identified in this section, different policies or guidance are sometimes issued for roads of different function. The EU Directive only refers to the trans-European road network, while additional information is available for lower order roads (see e.g. Polidori et al., 2012 for guidance on the secondary road network). Although the general principles that apply to each type of road are the same, often the detail can be different. Similarly, some countries issue guidance for local roads, recognising that the constraints can be different. Examples include The Good Practice Guide from the UK (DTLR, 2001); FHWA guidance in the United States on Developing Safety Plans: A Manual for Local Rural Road Owners (Ceifetz et al., 2012); and the Local Government and Community Road Safety guide (Austroads 2009; also see Austroads 2010a). McTiernan et al. (2010) also provide useful guidance on development of the Safe System approach for local government in Australia. However, usually only one guidance document exists covering road safety management of all roads, with those managing different parts of the network expected to adapt the information to their own circumstances.
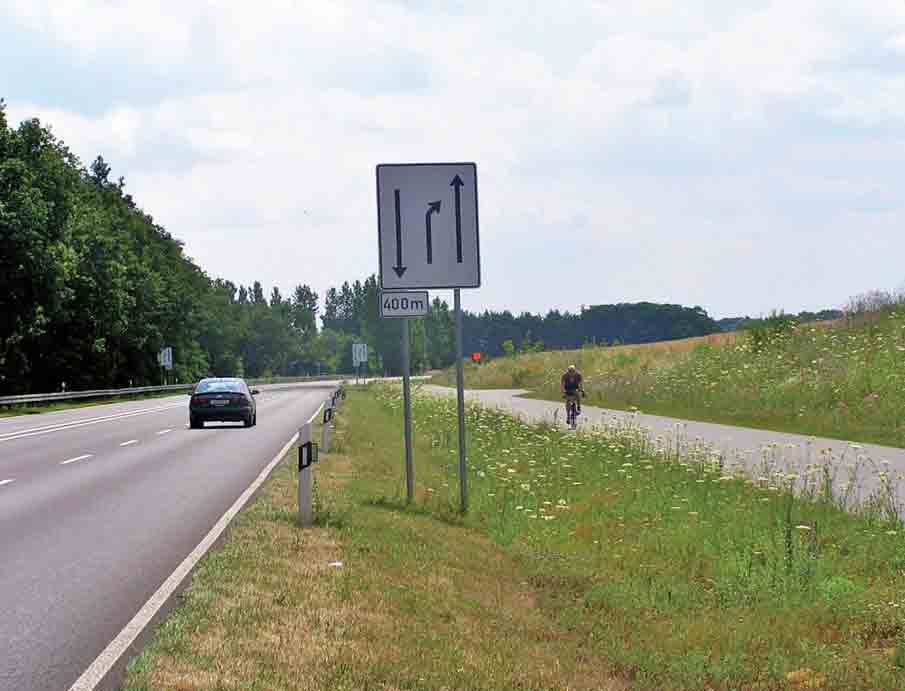
Along with guidance documents targeted at safety-related topics (discussed in Examples of Infrastructure Policies, Standards and Guidelines in Policies, Standards and Guidelines and Intervention Selection And Prioritisation) many countries have comprehensive guidance on the design, construction, traffic management and maintenance of roads. These typically embed safety, although it is noticeable that many have not yet fully embedded Safe System principles. Guidelines are often slow to include innovative approaches to road design, as these may take a number of years to construct and evaluate; there may be infrequent updates of guidelines; and there may be reluctance to change established practice. An evidence-based approach is required, as well as a process to facilitate continual improvement and updates to guides.
It is not possible to include comprehensive advice in this document on issues relating to road design, traffic management and maintenance, but rather readers are directed to appropriate country-based guidelines for this detail. As for safety-related guidance, countries are encouraged to benchmark against good performers (i.e. those with low crash rates) when developing or updating their own guidance.
Road design and construction involves the geometric design, and structural design of the roadway. A key objective of geometric road design is to optimise operational safety and transport efficiency within constraints (including budgets, environmental concerns and other social outcomes). Design needs to take into account the traffic volume and type of traffic expected to use the road. The elements that are typically thought to impact on efficiency and safety include intersections, horizontal curves, vertical curves and gradients, cross-section (lane and shoulder width, medians and roadsides), and merge/diverge areas, and design guides typically cover these issues in detail. Information is available on the influence of different design elements and the impact this has on safety outcomes (e.g. AASHTO, 2010; Harwood et al. 2014; Austroads 2010b).
The following points provide a brief description of effective countermeasures and the safety benefits of different design elements based on the above references. For further information on intervention effectiveness see the Crash Modification Factor Clearinghouse and the Pract-repository. It is important to note, however, that although these treatments have a known effectiveness in reducing crash risk in HICs, it may be a different case for LMICs. For example, wider sealed shoulders may provide additional space for drivers to recover after a driving error, but in LMICs this area may be utilised by the community to set up a roadside stall.
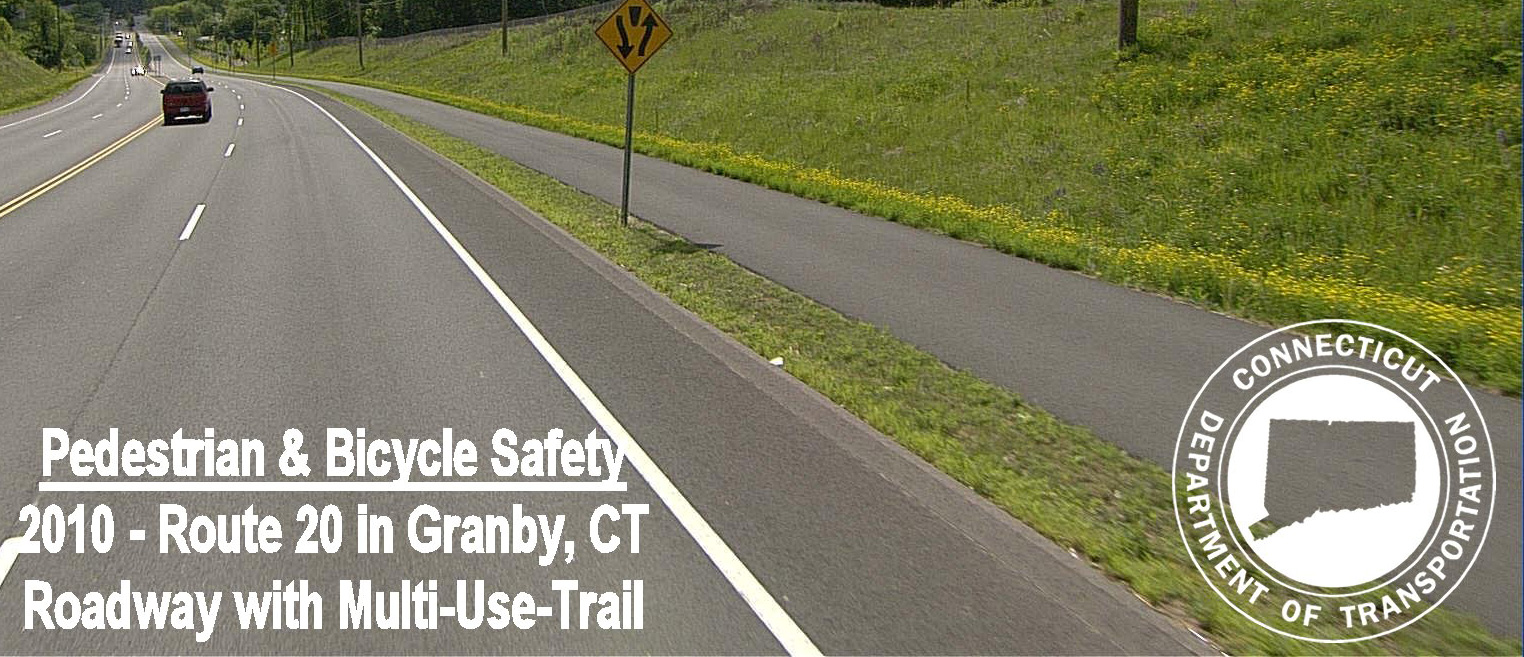
Design criteria include:
The following references provide examples of road design guidelines from different countries:
Traffic management concerns the safe and efficient movement of people and goods. This includes provision for pedestrians, cyclists and other vulnerable road users. Again, many guidelines exist to assist in management of roads and traffic, and these typically relate closely to design principles, the capabilities of road users, and to vehicle characteristics. Guidelines typically cover aspects such as traffic theory, traffic studies and analysis, and the use of traffic control devices (signs, line markings) and other associated measures (traffic signal operation and street lighting). They may also cover issues such as speed management and traffic calming, public transport facilities, parking and management at roadworks.
Example guidelines include:
Typically design guidelines are prepared with an underlying assumption that they will be used where there are minimal constraints in delivering the project. These are sometimes referred to as ‘greenfields’ sites and the Normal Design Domain (NDD) design criteria should be used. However, it is far more common to make safety or other improvements at locations where constraints do exist, such as upgrades to existing roads, or ‘brownfields’ sites. Constraints can include things like an existing road alignment, utilities (including poles), drainage, access points, etc. In these situations, applying NDD values can make projects financially unviable. In addition, there may be cultural, heritage or environmental issues that limit application of NDD standards.
Many jurisdictions have developed procedures for dealing with departures from the NDD. When deviating from recommended design criteria, an exception report is required. This should be produced early in the design stage, and it should include clear and careful consideration of the safety impacts of any departure, as well as the impact on traffic operations. Mitigating strategies to minimise any adverse risk from the exception should also be provided.
Guidance on safety impacts resulting from departures in the NDD can be found in several countries, along with information on mitigation strategies. Useful examples include guidance by the New Jersey Department of Transportation (2012); the Queensland Department of Transport and Main Roads (2013) and Stein and Nueman (2007).
One recent approach from the United States (but also applied in other locations using different names) is the concept of ‘performance-based practical design’ (PBPD), which has evolved from the ‘practical design’ approach (see Washington State Department of Transportation and Missouri Department of Transportation). This involves designing projects to stay within identified needs, and removing non-essential elements. This has the effect of lowering costs, and enabling improvements at a greater number of locations. The move to a ‘performance-based’ approach means that informed decisions will be made using analysis tools (for example, the Highway Safety Manual and FHWA - data driven safety analysis). Agencies using PBPD would have specific, long- and short-term, performance goals that may apply to a project, a whole corridor, or the overall system. Using available performance-analysis tools and qualitative assessments, projects would only include those features that serve those long- and short-term performance goals. Projects would not need to include features that provide performance exceeding the stated goals, fail to serve those performance goals, or are inconsistent with the purpose and need. This removes a concern relating to Practical Design that agencies may overemphasize short-term cost savings without a clear understanding of how such decisions would impact other objectives (such as safety and operational performance, context sensitivity, life-cycle costs, long-range corridor goals, liveability, and sustainability).
PBPD is a philosophy of balancing project purpose and need, design standards, life-cycle costs, operational and safety performance and sustainability. To gain the greatest benefit from PBPD, it is highly encouraged to take a system-wide perspective and incorporate PBPD concepts in all decisions related to planning, programming and project development. Starting at the planning and programing phase, a multi-disciplinary group can weigh the options and trade-offs to define performance goals and a focused project purpose and need that is used throughout the life of the project. The case study from the Czech Republic discusses self-explaining road performance.
A variety of tools and approaches are available to assist in the delivery of infrastructure safety management. As with guidelines, some tools have been prepared for use at the global, regional or country level. In some cases, the tools developed in one location or country can be adapted for use in another, but extreme care needs to be taken to ensure that the new context is considered when doing this. The types of tools available for road safety infrastructure management are mentioned in brief here, with further details provided in other relevant sections of this manual.
Schermers et al. (2011) provides a useful summary of tools used in Europe (most of which are discussed in this document. Elvik (2011) suggests a framework for applying tools that are related to the stages of a road’s life cycle. The US has also developed a comprehensive suite of tools for road safety infrastructure management. These are briefly discussed in the example in Box 9.5.
The Safety Analytical Tools developed in the United States include:
The Network Screening Tool identifies sites with potential for safety improvements through algorithms that identify areas of concern (e.g. higher than expected crash frequencies). In addition, high crash severities or a higher than expected rate of specific collision types can also be identified. These algorithms are effective for spot locations, as well as short and extended road segments.
The Diagnosis Tool identifies the nature of safety problems at specific sites. It is able to generate a range of data, including crash summary statistics, collision diagrams, collision pattern identification (including whether or not a collision type occurs at a higher than expected rate), and to conduct statistical tests for specific sites. Both engineering and human factors are integrated to identify safety concerns.
The Countermeasure Selection Tool helps in the selection of interventions to reduce crash frequency and severity at sites. This tool incorporates site-specific countermeasures that are recommended based on the site type, crash patterns, and specific safety concerns identified with the earlier Diagnosis Tool. Single or multiple countermeasures may be selected and appraised with the Economic Appraisal and Priority Ranking tools.
The Economic Appraisal Tool performs an appraisal of either specific countermeasures or different options at a site. Within this tool, a number of economic evaluations can be undertaken, including cost-effectiveness, benefit-cost ratio and net benefits. Safety-effectiveness is estimated via observed, expected and predicted crash frequency and crash severity, as well as crash patterns and expected crash reduction for specific countermeasures. Notably, the analysis results are consistent with requirements of the Federal Highway Safety Improvement Programme guidelines.
The Priority Ranking Tool ranks sites and proposed improvements according to the benefit and cost analysis conducted by the Economic Appraisal tool. The site and improvement rankings are determined through comparison of cost-effectiveness, benefit-cost ratio, net benefits, safety benefits, construction cost, number of total crashes reduced, fatal and severe injury crash reduction, and fatal and all injury crash reduction. The Priority Ranking Tool assists in the optimisation of projects and maximisation of benefits across sites.
The Countermeasure Evaluation Tool allows pre- and post-evaluations of safety improvements using the Empirical Bayes (EB) approach. In addition, this tool has the capability to evaluate changes in the proportion of collision types. Analyses can also be performed to evaluate the efficacy of individual or combined countermeasures and construction projects. A benefit-cost analysis is also available to assess the economic benefits of countermeasures or construction projects.
Further details on these tools can be found at: http://www.safetyanalyst.org/.
The tools in Box 9.5 follow the broad stages of infrastructure safety management identified in Introduction. Later chapters discuss each of the key tools. The tools referenced for different stages of road safety management include:
— Crash data: Establishing and Maintaining Crash Data Systems. discusses the establishment and use of crash data systems, and some of the useful tools that are desirable for such systems.
— Non-crash data: Non-Crash Data and Recording Systems. discusses non-crash data, including the need for systems to collect and analyse such information.
— crash-based identification (Crash-based Identification (‘Reactive Approaches’))
— road safety impact assessment (Road Safety Impact Assessment in Proactive Identification)
— road safety audit (Road Safety Audit in Proactive Identification)
— road safety inspection (Road Safety Inspection in Proactive Identification)
— road assessment programmes (Road Assessment for Safety Infrastructure in Proactive Identification).
A further example, this one from France can be seen in Box 9.6.
Since the early 2000s, France has developed and implemented a set of road safety approaches for infrastructure projects. This set of approaches is now outlined in the European Directive 2008/96 on road safety infrastructure management for French implementation projects.
A Road Safety Impact Assessment is carried out for all infrastructure projects at the initial planning stage before the infrastructure project is approved. It identifies the road safety considerations which contribute to the selection of the proposed solution and provides all relevant information necessary for a cost-benefit analysis of the different options assessed.
A Road Safety Audit of the design characteristics from a safety viewpoint is carried out for all infrastructure projects by a trained auditor or a team of auditors. Audits form an integral part of the design process of the infrastructure project and are carried out at different stages of the project: draft and detailed design, pre-opening and early operation. Where unsafe features are identified in the course of the audit, the design is rectified. When it is not rectified before the end of the appropriate stage, the reasons are stated by the authority in an annex of the report.
Source: Road Safety Audits (Sétra , 2012)
A Road Safety Inspection is carried out on the national road network for all existing roads in order to report on the details of the road, its surrounding area and the general environment that can influence the user’s behaviour or affect their passive safety and thus have repercussions on road safety. The concept is to provide a method that will help the operator to improve their network knowledge. Inspection visits are made by appropriately qualified personnel, to identify the main road safety issues, and to provide a fresh point of view on the system. The systematic inspection of a section of road thus consists of a quick and practical rating of the main configurations that may not be expected by the road user, considering all modes of transport.
Source: ISRI Initiative: road safety inspections of routes (Sétra, 2008).
Safety of users on existing roads: this approach, called SURE in France, is carried out on the national road network for all existing roads. It is a general method of which the main innovation is to explicitly and continuously provide a complete approach of road safety improvements, from the road safety issues study to the assessment stage via the implementation of treatments. The aim of this approach is to determine and implement adapted treatments for sections of road where the safety gain is potentially higher.
The SURE process is a practical application of the common road safety approach presented in Examples of Infrastructure Policies, Standards and Guidelines in Policies, Standarts and Guidelines
Sources:
All of these tools can (and should) be used in parallel. Each is useful for different purposes, and for different stages of infrastructure safety management. Strengths and weaknesses are discussed in later chapters. Historically, the collection and analysis of crash data has been the most widely applied approach to managing safety. This is likely to continue to be an important approach, and is an important starting point for those in LMICs. Road safety audit and safety inspection are other widely applied tools, including in LMICs. One added advantage of these approaches is that they are a useful mechanism to improve safety culture.
One often over-looked issue is that the earlier within the safety management process, or project development process, the greater the potential to make a cost-effective improvement in safety outcomes. This is best demonstrated in the planning and development phase. In many countries road safety practitioners have historically relied upon road safety audit to determine safety issues in planning and development stages of design. In more recent times, tools to assist in embedding safety into design at the earliest stages have been developed. Importantly, some of these are aimed at practitioners who are not from a safety background in an attempt to include safety considerations into decision-making. These tools can be either quantitative in approach (such as tools that are based on crash prediction models) or qualitative. One of the most widely applied quantitative models is the US Interactive Highway Safety Design Model (IHSDM). This includes several modules, some of which can be used at the project development stage (AASHTO, 2010). It should be noted that this tool is generally applied to existing roads in the US, as very few new roads are built. Further information on IHSDM can be found in United States' case study below and in Proactive Identification.
iRAP has also been used to quantify safety implications at the early design stage. The following four case studies explore the use of management tools in efforts to improve road safety for Malaysia, India, Moldova using iRAP.
The Strategic Tool for Assessment of Road Safety (STARS), developed in Australia, relies on checklists to help identify negative safety outcomes (Jurewicz, 2009). This approach provides a risk value to each of the checklist questions, and ultimately an overall safety rating for the planned project. Checklists are available for different stages of development, including regional or structure plans, master plans, sub-division or neighbourhood plans, arterial corridors, and new/commercial developments. Example road safety planning issues at the regional level include:
Further information on safety assessment prior to a road safety audit can be found in Road Safety Impact Assessment in Proactive Identification.
Road safety management tools need constant review as good practice and new approaches emerge. Elvik (2011) conducted such a review of European infrastructure safety management tools, and despite the many years of development and experience in using such tools, a number of opportunities for improvement were identified. Some of the key findings were that:
The following case study from Canada highlights the ability to evaluate bid proposals related to improving safety performance.
AASHTO (2010) Highway Safety Manual Volume 1. American Association of State Highway and Transportation Officials, Washington D.C.
Austroads (2009) Guide to Road Safety Part 4: Local Government and Community Road Safety, Austroads, Sydney, Australia.
Austroads (2010a) Road safety on local government roads. Austroads, Sydney, Australia.
Austroads (2010b), Road safety engineering risk assessment: part 1: relationships between crash risk and the standards of geometric design elements. Austroads report AP-T146/10. Austroads, Sydney, Australia.
Beagle, A; Boyd, N; Donahue J; Milton J; van Schalkwyk I: (2015) Transforming Design Policy: A Path to Practical Design Reform., 5th International Symposium on Highway Geometric Design; Symposium Proceedings,
Ceifetz, A, Bagdade, J, Nabors, D, Sawyer, M & Eccles, K (2012), Developing Safety Plans: A Manual for Local Rural Road Owners, Federal Highway Administration, Washington D.C.
Certu, 2008, Transportation Safety in Urban Area: Methodological guide, Certu, Lyon, France.
Croft, P, Tziotis, M, Turner, B & Hughes, J, (2010) Research directions for guidelines in road safety engineering, Road Safety on Four Continents, Abu Dhabi.
CROW (2009) Road Safety Manual, CROW, EDE, The Netherlands
DTLR (2001) A road safety good practice guide for highway authorities, Department for Transport, Local Government and the Regions, London, UK.
Elvik, R, (2011) Assessment and applicability of evaluation tools: Current practice in a sample of European countries and steps towards a state-of-the-art approach, Deliverables Nr 4 and 5 of the European Road Infrastructure Safety Management Evaluation Tools (RISMET) project, Eranet Roads, Leidschendam, Netherlands.
European Commission (2014), Study on the effectiveness and on the improvement of the EU legislative framework on road infrastructure safety management (Directive 2008/96/EC), European Commission, Brussels, Belgium.
GRSF (2009), Implementing the Recommendations of the World Report on Road Traffic Injury Prevention. Country guidelines for the Conduct of Road Safety Management Capacity Reviews and the Specification of Lead Agency Reforms, Investment Strategies and Safe System Projects, Global Road Safety Facility World Bank, Washington DC.
Harwood, D, Hutton, J, Fees, C, Bauer, K, Glen, A, & Ouren, H, 2014, Evaluation of the 13 Controlling Criteria for Geometric Design, NCHRP Report 783, Washington DC.
Jurewicz, C, (2009) STARS: a risk-based road safety tool for urban planners, Australasian Road Safety Research Policing Education Conference, Sydney, Australia.
McTiernan, D Turner, B Wernham, R & Gregory, R (2010) Local government and the Safe System approach to road safety. ARRB Group Ltd, Vermont South, Australia.
New Jersey Department of Transportation, (2012) Design exception manual, The State of New Jersey Department of Transportation, Trenton, New Jersey, available from http://www.state.nj.us/transportation/eng/documents/DEM/pdf/DEM201201.pdf, accessed 25 February, 2014.
NZ Ministry of Transport, (2013) Safer journeys: action plan 2013-2015, New Zealand. Ministry of Transport, Wellington, New Zealand.
OECD, (2008) Towards Zero: Achieving Ambitious Road Safety Targets Through a Safe System Approach, OECD, Paris.
PIARC (2012), Comparison of National Road Safety Policies and Plans, PIARC Technical Committee C.2 Safer Road Operations, Report 2012R31EN, The World Road Association, Paris.
Polidori, C, Cocu, X, Volckaert, A, Teichner, T, Lemke, K & Saleh, P (2012) Safety prevention manual for secondary roads’ European Commission. Available at http://pilot4safety.fehrl.org/index.php?m=3&id_directory=7254.
Queensland Department of Transport and Main Roads, (2013) Guidelines for Road Design on Brownfield Sites, State of Queensland (Department of Transport and Main Roads), Brisbane, Australia. Available from http://www.tmr.qld.gov.au/business-industry/Technical-standards-publications/Brownfields-guidelines.aspx, accessed 25 February, 2014.
Rogers, L, Smith, G, Devika, K, Kumar, H & Prakash, G, (2012) Star rating road designs performance indicators for roads in India, 25th ARRB Conference, Perth, Australia.
Sabey, B (1980) Road safety and value for money. Supplementary Report, NO: 581 Transport and Road Research Laboratory (TRRL), Crowthorne, United Kingdom.
Schermers, G, Cardoso, J, Elvik, R, Weller, G, Dietze, M, Reurings, M, Azeredo, S, and Charman, S, (2011) Recommendations for the development and application of Evaluation Tools for road infrastructure safety management in the EU, Deliverables Nr 7 of the European Road Infrastructure Safety Management Evaluation Tools (RISMET) project, Eranet Roads, Leidschendam, Netherlands.
Stein, W and Neuman, T (2007) Mitigation Strategies for Design Exceptions, Report FHWA-SA-07-011, Federal Highways Administration, Washington D.C.
Stigson, H Krafft, M & Tingvall, C (2008) Use of Fatal Real-Life Crashes to Analyze a Safe Road Transport System Model, Including the Road User, the Vehicle, and the Road. Traffic Injury Prevention,9:5,463 – 471.
Theeuwes, J & Godthelp, H (1995), Self explaining roads, Journal of Safety Science, 19, 217-225.
Treat, J, 1980, A study of precrash factors involved in traffic accidents. HSRI Research Review, 10, 6 and 11, 1, PAGES: 1-35.
UNRSC (2010) Safe roads for development: A policy framework for safe infrastructure on major road transport networks. United Nations Road Safety Collaboration.
Wegman, F & Aarts, L (2006) Advancing Sustainable Safety: National Road Safety Outlook for 2005-2020, SWOV Institute for Road Safety Research, Leidschendam, The Netherlands.
The assessment of potential risks and identification (or ‘diagnosis’) of issues are the first steps of the risk assessment process introduced in Infrastructure Safety Management: Policies, Standards, Guidelines and Tools (Figure 10.1). This chapter discusses methods for identifying high risk locations, and the ways that different sources of data can be analysed to assess the causes of this risk.

Figure 10.1 Assessing risk and identifying issues within the risk assessment process
The traditional approach used in the identification of risk is the analysis of historical crash data. This approach is still very relevant, but other sources of information used in the risk assessment process can lead to improvements and better results. The proactive approach is important in all countries, but particularly in locations where crash data may be of poor quality and in locations where new infrastructure will be built. Proactive approaches are being increasingly used to supplement historical crash data.
The focus of this manual is on the elimination of death and serious injuries, as these are the crash types that have the greatest societal impact. However, identification of high-risk locations involving death and serious injury does not just involve analysis of fatal and serious injury crash data. Other sources of information can also be used to identify likely locations where serious injury or death may occur.
The following section provides brief information on project- and programme-level approaches to risk assessment, while Crash-based Identification (‘Reactive’ Approaches) discusses crash-based methods for identifying and assessing risk. Proactive Identification provides information on the proactive approaches, including impact assessment, road safety audit and road safety inspection Combining Crash Data and Road Data brings both the reactive and proactive approaches together to discuss an integrated approach to assessing risk.
Guidance documents on the assessment of risk are available and should be adopted by all countries and embedded within core business. Training in the use of the following tools should be provided:
As a priority, assessment should be undertaken on high risk routes and corridors (see Belize case study in Chapter 10.2), utilising crash data were available (Crash-based Identification (‘Reactive’ Approaches)) as well as information on safety-related road elements (e.g. through safety audit and road assessment programmes – see Proactive Identification).
Road agencies typically allocate funding to improve high risk locations, whether based on crash history or on the potential risk. This funding may take the form of dedicated funding for high-risk locations and/or be embedded in other operating budgets (for example, major projects or asset management). Most actions undertaken by a road agency have a safety impact, whether they are initiated for safety reasons or not. If consideration of safety is included in all decision-making, safety risk can be reduced, often at little or no additional cost. The assessment of risk needs to occur at the programme and project level, and the advice provided in this chapter is relevant to both.
Assessment of risk should be undertaken for the entire road network for which the road agency is responsible. Such an approach would require a network-wide assessment of risks and issues. The outcomes of such an approach would identify key crash types, trends, geographic regions or areas, deficiency types, etc., with the outcomes of this assessment informing programmes of work.
It is often the case that a small percentage of roads account for a large percentage of deaths and serious injuries. At the programme-level, the task is to identify such routes and address these. For those countries with limited resources or that lack adequate data across the whole network, such locations are the most important to assess. These locations can form the basis of a corridor demonstration project. The content from this and the following chapters can be used as a guide to the assessment of risk across networks or along corridors. The examples shown in the case studies below provide information on the corridor approach in Belize and in New South Wales, Australia.
At a project level, the steps outlined in this chapter are equally relevant. They highlight how to identify risk at more specific locations (e.g. intersections, routes or areas) and diagnose risk at these locations. Crash-based (reactive) and more proactive approaches are relevant to both programme- and project-level approaches. In each case (whether programme or project level) the same steps are involved in assessing risks and identifying casual issues. The Moldova used EuroRAP as a means to assess risk, and the Czech Republic's IDEKO research project developed method and tools for the treatment of hazardous locations.
This section focuses on crash-based identification of high risk locations, a process that is known as accident investigation, or the treatment of ‘blackspots’. The term ‘sites with potential for safety improvement’ is also used, as the approach involves selecting locations that have high potential for reductions in crashes through the introduction of targeted safety improvements. The approach relies on crash analyses to first identify safety problems before a solution is sought. These are often called ‘reactive’ methods because a response is only initiated after crashes have occurred. A fuller account of this approach is provided in the PIARC document Road Accident Investigation Guidelines for Road Engineers (PIARC, 2013).
As indicated above and in Proactive Identification, reliance solely on crash data can produce situations where only a small proportion of crashes can potentially be addressed. For this reason, it is recommended that a combination of crash data and other sources of information be used to assess and treat risk.
Reactive approaches typically include the following steps:
This chapter focuses on the first two points – identification and diagnosis. Consideration will also be given to how crash data is used and its limitations. The other steps will be covered in Intervention Selection and Prioritisationand Monitoring, Analysis and Evaluation of Road Safety. A reliable crash database is a key tool in this process of identifying and analysing crash locations (see Hospital Data in Establishing and Maintaining Crash Data Systems). Other tools also exist, for example the Network Screening and Diagnosis tools in Safety Analyst (see Box 9.5).
In order to treat the occurrence of crashes, crash data is needed to provide necessary information to road authorities. Further information on the collection and use of crash data can be found in Effective Management And Use Of Safety Data. Issues relating to the need for good quality data are also discussed in that chapter. To ensure adequate data quality, the data should be accurate, complex (i.e. includes all features), available (i.e. accessible to all users), and uniform (i.e. adheres to standard definitions) (PIARC, 2013).
The primary data source for crash reduction initiatives, especially those undertaken by road engineers, is typically police crash reports. This data should provide crucial information, which at a minimum should include the crash severity and the number of each injury severity type (i.e. fatal, serious, minor, etc.). Other important information to collect includes (PIARC 2013):
Crash type is of particular importance, as it provides the basis for some crash location selection criteria (as discussed in the following section). Normally, crash types are divided into groups of crashes with common attributes, such as all crashes involving vehicles colliding head-on, or all crashes involving pedestrians. Further examples of crash types are shown in Identifying Crash Locations in Crash-based Identification (‘Reactive’ Approaches).

It is important to be able to identify the location where a crash occurs. A crash location can be an individual site (such as an intersection or bend in the road), a length (segment) of road, an area of the road network (such as an entire corridor), or a collection of locations across the network (road system wide) that display the same crash characteristics. In order to identify crash locations, access to a comprehensive database is required to provide sufficient information about the exact locations and circumstances of crashes that have occurred. Once all crash sites have been located, there needs to be selection criteria so that only worthy sites are selected for further analysis and treatment.
The following sections provide an overview of the approaches that can be used in identifying crash locations. Detailed guidance on the identification of high-risk locations has been developed in many countries. In addition to the PIARC (2013) manual, further information can be gathered from many sources, including AASHTO (2010), Austroads (2009a), and RoSPA (2007). The African Development Bank (2014a) has recently released guidance that is specifically intended for use in LMICs.
It is important to consider what the boundaries of a crash location are. There needs to be a defined cut-off point, such as between crashes that occur at an intersection and crashes that are considered ‘mid-block’. It may be necessary to look beyond these defined boundaries when analysing crash data. For example, crashes within 10 metres on the approach roads to an intersection may be considered as located at the intersection; however, it may be of value to look beyond this boundary for other crashes that may be related to an intersection (e.g. 100 metres). The crash location is also generally identified as the point at which an impact occurred. However, this may only be the end point of a sequence of events. Factors relating to the cause of the crash may have started earlier on the roadway.
Crash locations can sometimes be poorly or inaccurately defined, and it is important to consider this when comparing crash sites. There are a number of different methods used to determine the location of a crash. In built-up areas, the common practice is to measure the distance from the nearest intersection, junction or landmark using some distance measuring device. However, in rural areas and in some countries in general, names may not exist for all roads, and junctions may be few and far between. Other common systems are the Linear Referencing System and Link-Node System. These too rely on road names or reliable kilometre post markers along roads. In many countries hectometer points (or milepost) on road are a part of infrastructure for a very long time. Those signs are helping to identify number and kilometer (or milepost) of the road. Now more and more common is to use Global Positioning Systems (GPS). Gathered in this way latitude and longitude coordinates may show us the exact location more precisely. For roads where the infrastructure does not contain kilometer and/or hectometer (milepost) signs it is important to consider if it is more effective to invest directly into a GPS solution because of its advantages in locating crashes. See: Effective Management And Use Of Safety Data and WHO (2010) for more detail on defining crash locations.
Over time, especially in HICs, there has been a movement to the assessment of more extensive areas, including route-based approaches. The term ‘Network Safety Management’ is used in Europe to encompass an approach that assesses extended routes, typically between 2 and 10 km (Schermers et al., 2011). These segments have higher than expected numbers and severity of crashes when compared to other similar segments. Various tools have been developed to help with this process, and some of the key approaches are discussed below.
Typically, a three- to five year period is selected to provide a large enough sample of data, whilst minimising the chance of changes to the road network. In some LMICs, high risk locations and crash patterns within a location may start to form after just one to two years. Once a strong pattern has been established, especially where fatal and serious injury crashes are occurring, it is more important that treatments are implemented earlier rather than waiting up to five years for more data. When selecting the time period, it is important to use whole years to avoid cyclic or seasonal variations in the crash and traffic data. It is also important to be aware of any changes in database definitions that may have occurred in that time.
There is generally not enough funding to treat all identified crash locations. Even if the funds are available, funding restraints may not allow for immediate investment or make it necessary to invest over a longer timeframe. Selection criteria are therefore required for prioritising crash locations for further investigation and treatment. It is strongly recommended that fatal and serious injury crash types be used for the selection of sites, as per the Safe System approach (see The Safe System Approach). However, minor injury crashes should not be ignored as they may be indicative of a potential fatal or serious injury crash in the future. The selection process varies depending on the aim of the project and the types of actions that may be considered, and include:
There are several existing methods to identify crash locations, using measurements such as crash frequency, crash rate and crash severity. More detailed information on this issue can be found in AASHTO Highway Safety Manual (2010) and Austroads (2009). These help in the identification of high risk crash locations, particularly those of higher severity. It is important to note, however, that although blackspots should be targeted for treatment, they may only make up a small proportion of the network that is responsible for deaths and serious injuries. In these instances, additional proactive responses may also be required (see Proactive Identification).
For most of the methods described below, crash locations should be selected based on the same definitions for location (e.g. the same radius or route length, where this is applicable) and the same time period in order to allow for a direct comparison. However, for some methods, the data can be normalised to allow direct comparison (e.g. converted to crashes per kilometre; crashes per year).
At the most basic level, the presentation of crash locations on a map can provide information on crash clusters. In the absence of a more sophisticated crash database system, this provides a quick indication of crash locations by frequency. Figure 10.3 shows an example of crash locations overlaid on a map for an urban area. In this figure the larger the circle, the higher the number of crashes. Maps are a powerful way to present information to key stakeholders, including technical staff, policy makers, senior managers, members of the public and politicians. As they are easy to understand by all of these stakeholders they can be a strong advocacy tool.
.")
Figure 10.3 Crash location map, New Zealand- Source: New Zealand Crash Analysis System (CAS).
Figure 10.4 Shows an example of road safety levels map based on fatal accident crash risk concentration for national roads in Poland. More detailed maps for smaller regions together with maps representing fatal accident acceptance risk levels, costs density class risks and costs density acceptance levels are also available. All the maps are prepared in accordance with polish national regulations and Directive 2008/96/EC of the European Parliament and of the Council on road infrastructure safety management.
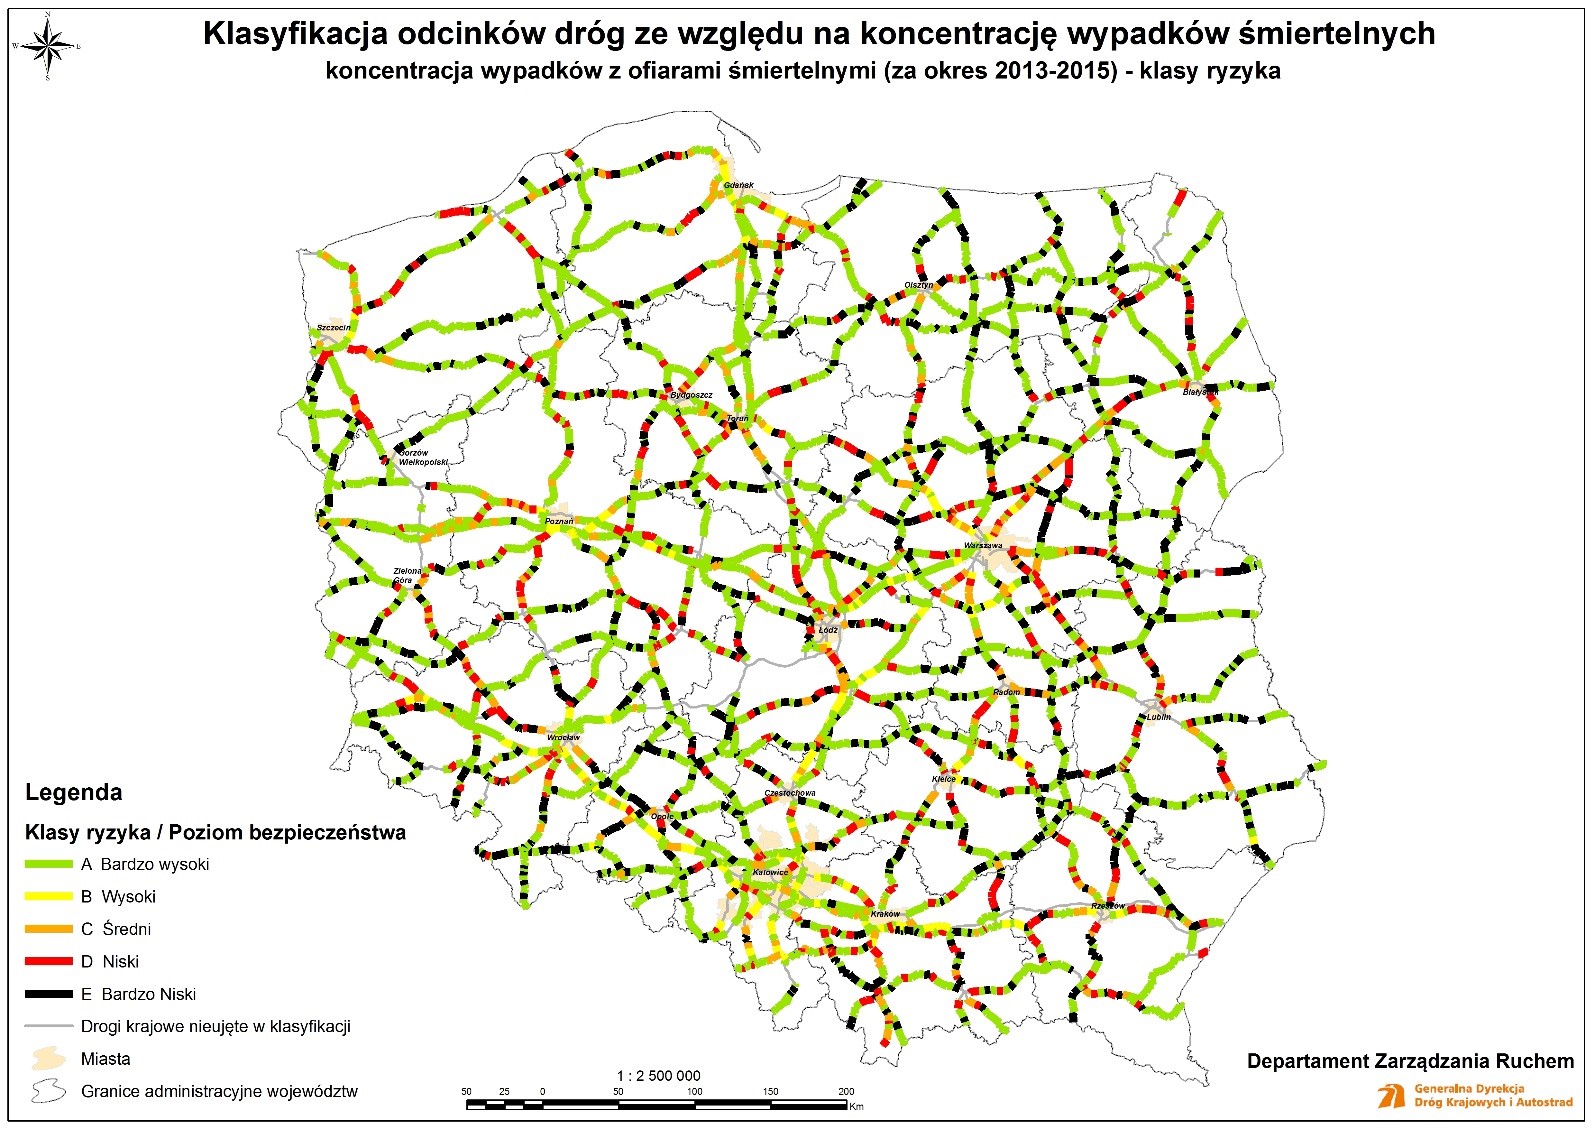
Figure 10.4 Road safety levels map, based on fatal accident crash risk concentration for national roads in Poland. Each color represents other safety level. It helps to focus on the highest risk locations.
A ranked listing by crash frequency (i.e. highest crash numbers to lowest) can form the basis of an initial list of crash locations for further assessment. Usually a threshold level is selected, with sites above this threshold being assessed. The threshold is often set arbitrarily (e.g. five crashes per year), although it is preferable to take into account the available budget and/or a threshold involving crashes of a particular type (e.g. three pedestrian injuries per year).
Given the aim of road safety management is to minimise death and serious injury crashes, it is preferable to select sites for investigation based on crash severity. A common method of identifying high-risk locations to take account of severity is to prioritise sites through a crash cost analysis. An effective method often used is called the Equivalent Property Damage Only (EPDO) Index, where crashes are weighted according to their severity. For instance, fatal crashes are assigned the highest cost/weighting per crash and property-damage-only (PDO) crashes (or minor crashes if PDO crash data is not collected) are assigned the lowest cost/weighting per crash. Although this is a relatively simple criterion to implement, it provides a basis for creating a shortlist of sites to be investigated further. As with the simple crash frequency-based approach, sites are ranked from highest cost to lowest cost, and a threshold is set for investigation.
A similar and yet more sophisticated method is the Relative Severity Index (RSI). Standard crash costs are assigned to crashes by crash type and road environment, as shown in the example in Table 10.1
| Crash costs for Victoria (AU$) | ||
|---|---|---|
| One-vehicle | Urban | Rural |
Pedestrian hit crossing road | 166,300 | 183,800 |
Hit permanent obstruction | 162,400 | 163,400 |
Hit animal on road | 102,300 | 79,500 |
Off road, on straight | 119,900 | 146,100 |
Off road, on straight, hit object | 177,500 | 206,600 |
Out of control, on road, on straight | 98,100 | 115,700 |
Off road, on curve | 146,900 | 175,900 |
Off road, on curve, hit object | 191,700 | 219,700 |
Out of control, on road, on curve | 120,100 | 112,110 |
| Two-vehicle | Urban | Rural |
Intersection (adjacent approaches) | 124,000 | 173,200 |
Head-on | 240,300 | 341,600 |
Opposing turns | 132,700 | 168,600 |
Rear-end | 64,200 | 109,700 |
Lane change | 88,500 | 132,800 |
Parallel lanes, turning | 79,900 | 104,600 |
U-turn/through | 124,600 | 135,600 |
Vehicles leaving driveway | 93,200 | 129,100 |
Overtaking same direction | 97,000 | 138,000 |
Hit parked vehicle | 112,500 | 202,700 |
Hit railway train | 384,400 | 559,100 |
Source: Adapted from Andreassen (2001).
These costs are calculated based on an analysis of the average crash severity of each crash type. It is important to note, however, that crash types and crash costs will differ between jurisdictions and countries. This method takes into account crash severity but places less emphasis on locations where a single fatal crash may skew outcomes because of its very high cost. Such an outcome might be the result of a ‘random’ event, never to be repeated. This is more likely on lower volume roads or road networks where fatal crashes are very infrequent. Of higher interest are locations, routes or areas where high severity events are likely to happen again in the future. Using average crash costs by crash type, crashes at each location can be assigned a crash cost, and then locations ranked by total crash costs.
In some cases, multiple identification methods are used. These use two or more of the methods identified above. Other selection criteria are also available. Some of these are quite complex, utilising crash prediction models and Empirical Bayesian (EB) methods (e.g. AASHTO, 2010). The EB method is currently considered one of the most reliable approaches for selecting crash locations. However, other approaches identified above can produce satisfactory outcomes, particularly when adequate weighting is applied to fatal and serious injury crash outcomes.
Crash sites can be assessed using statistical analysis to identify sites that are experiencing a statistically significant number of crashes in a set time period. This can be useful to distinguish between sites that are experiencing abnormally high crash rates and those that are merely experiencing variation due to chance.
The crash identification process allows for sites to be selected for further investigation. Using any of the abovementioned methods, a shortlist can be developed containing sites that will be considered for treatment. Available funding will limit the number of sites that can be treated, and so the shortlisted sites should be assessed through site inspections and an initial crash diagnosis to identify where cost-effective treatments can be implemented.
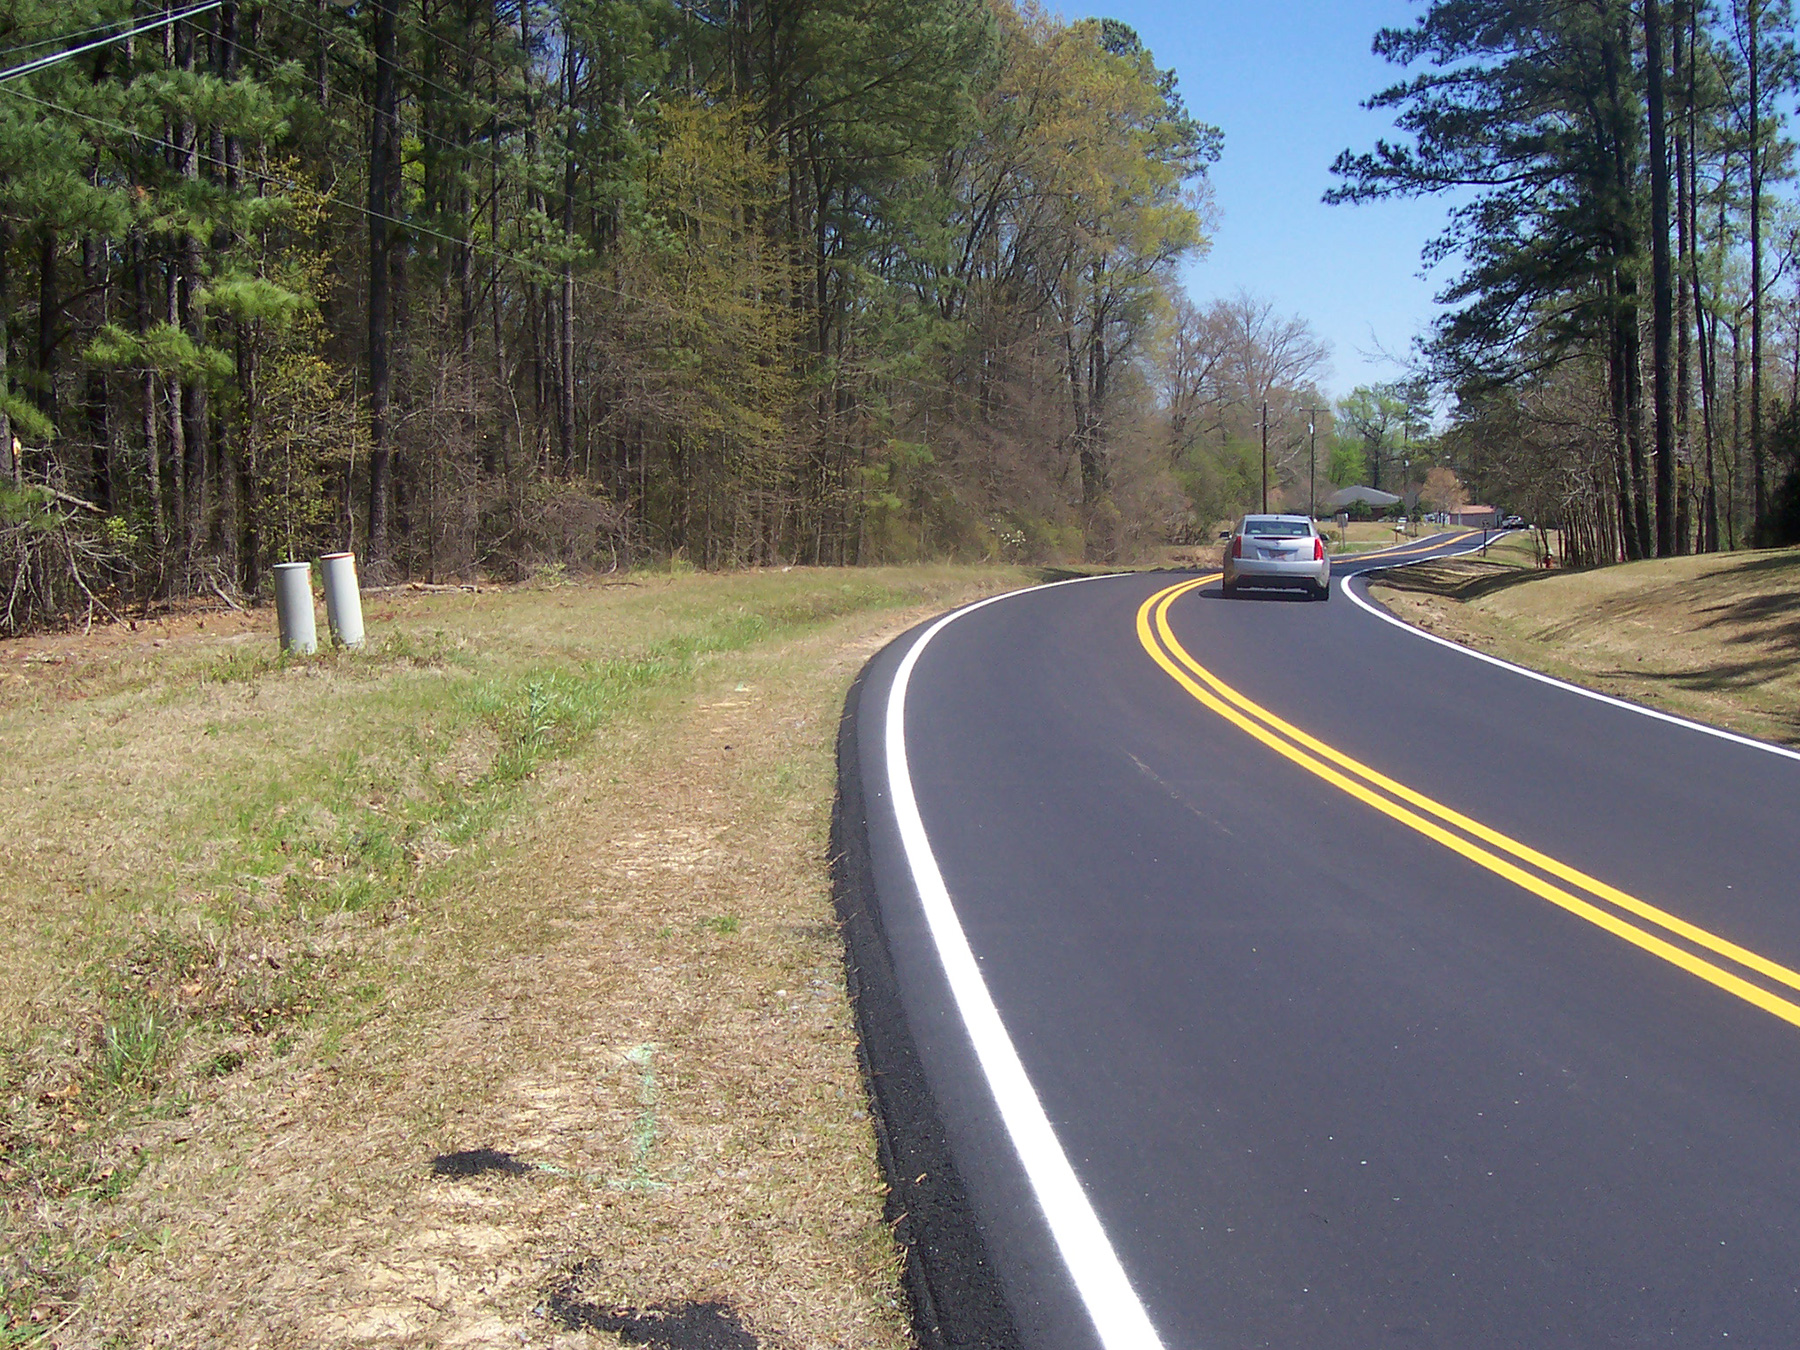
Diagnosing the contributing factors to crashes is the foundation for selecting an effective solution to a safety problem. To properly understand the problem, one must consider that:
Diagnosis of the contributing factors at a crash location is a four-step process:
These stages are discussed in further detail in the sections below.
Crash data is the most important information, and should be available from either the Police or road authority. The road agency may also have information on traffic volumes and any historical information about the site such as a layout plan, any changes in traffic patterns or land use, and any previous or current concerns raised by the community or stakeholders.
An effective way to identify groupings of certain crash types or other common factors at a location is to present the data as a frequency diagram, a factor matrix, or a collision diagram of the different crash types. A brief description of each of the analysis methods is provided below:
Typically, crashes are categorised within a crash database according to a certain crash type coding system. A common breakdown using 10 crash groupings is provided by PIARC (2013):
Other countries may use more or less crash type groupings. Given the importance of motorcycle fatal and serious injury in many countries, provision should also be made to record details of such crashes. This is typically recorded as the vehicle type as an additional variable to those provided above.
Crash type variables can be used to describe the type of the crashes in terms of parties involved, collision and vehicle/pedestrian manoeuvre just before the crash. Each variable, coded as a two digit number, describes the single specific crash type. In crashes where more than one type can be applicable, the corresponding number of variables should be selected.
A simple frequency histogram or diagram can be used to show the distribution of crashes and identify if any trends in crashes are appearing. This can be good for an initial assessment, but due to its simplicity, it should not be done as an alternative to a factor matrix or collision diagram.
A factor matrix takes the frequency table approach one step further and considers additional factors such as the crash severity, year of the crash, direction of travel, type of road users, collision type, surface and lighting conditions, time of day, and day of week.

Figure 10.5 Example of a factor matrix, Crash Analysis System, New Zealand - Source: NZTA Crash Analysis System.
A collision diagram is an illustrative presentation of the crashes that have occurred at a location. Crashes are pinpointed on a diagram of the intersection or road section, showing the crash type (through standard symbols), the direction of travel, and other relevant information (e.g. the date, time of day, weather and lighting conditions). A number of software packages allow the automatic creation of these diagrams.
.")
Figure 10.6 An example of a collision diagram from Germany - Source: PIARC (2013).
The main purpose of these data presentation types is to identify common contributing factors of crashes at a location. Note that there are normally several factors that lead to a crash. If there is no apparent dominant crash type that appears from the data, it can be very difficult to treat the site as it will be difficult for any one treatment to solve all the different issues at the site (speed management can be the exception to this, particularly in the elimination of high severity crash outcomes). Sometimes it can be helpful to look at the individual police crash reports for greater detail on the crash circumstances, as this might shed light on a common causal factor.
The main purpose of an inspection is to identify any environmental or traffic issues that may be contributing to crashes at the location. A site inspection can allow the crash investigation team to see the location through the eyes of the road user and observe the traffic behaviours. Additional data can also be collected, such as vehicle speeds, road features, parking restrictions and speed limits, as well as enable the team to assess any other characteristics of the surrounding road environment.
Where possible it is recommended that a team conduct the assessment, rather than an individual. A team approach will generally provide a more diverse range of opinions and ideas, as it is easier to generate these through group discussion. Team members might include an expert who is trained in road safety engineering and investigation of crash locations; and police and/or road agency staff, particularly those who are familiar with the location. The group may also include someone new to the crash investigation, but who has ideally undergone some form of training. This approach is essential to ensure development of skills for future crash investigators. Guidelines on Human Factors should be considered by those investigating sites (see Design for Road User Characteristics and Compliance), See also: NCHRP 600: Human Factors Guidelines for Road Systems.
It is recommended that the data analysis described above (e.g. production of a factor matrix and collision diagram) is circulated amongst the crash investigation team in the form of a preliminary report, prior to any site inspections.
A drive-through of the location should be undertaken to fully understand the road user experience. It is often useful to select someone unfamiliar with the area to do the driving so that they can experience the location as others would for the first time. Often there will be a need to drive through the site several times. An inspection on foot will also be required to more closely observe road user behaviour and site conditions. This will also allow for the collection of photos and notes, and to document any findings from the inspection. Sometimes it is also useful to inspect the site at different times of the day or days of the week to check for any variability in traffic flows or lighting/visibility conditions. For example, if a high number of night crashes have occurred, night inspections are essential.
Table 10.2 provides a list of possible contributing factors for different crash types (including those that contribute the most to fatal and serious injury outcomes) that should be considered by investigators during a site inspection. Although not listed, speed is linked to the frequency and severity of all crashes.
| Right angle crashes (intersection) | Turning crashes with oncoming crashes |
|---|---|
|
|
| Run-off-road crashes | Head-on crashes |
|
|
| Motorcyclist crashes | Cyclist crashes |
|
|
| Pedestrian crashes | Straight ahead rear-end crashes |
|
|
| Hit-fixed-object crashes | Railway level crossing crashes |
|
|
| Crashes involving a parked vehicle | Crashes involving U-turning vehicles |
|
|
| Lane changing and manoeuvring | |
| |
Before summarising the analysis in a report, consideration should be given to whether any additional information is required. For instance, if the crash analysis and/or site inspections suggest that there may be issues with skidding, then skid resistance testing could be undertaken.
A summary report should be prepared to clearly inform readers of the conclusions that were drawn from the analysis. This provides the basis from which treatment options are considered and selected. The report should include a description of the area or site, results from the data analysis (e.g. crash diagrams), observations from the site inspections, including possible contributing factors to crashes, comments on any identified common factors leading to crashes and possible remedial measures (see Intervention Options and Selection).
Figure 10.7 An example of low cost improvement on old motorway A-4 in Poland.
An example of a diagnosis, on motorways and expressways in were occasionally identified wrong-way drivers, “ghost riders”. The road authority recognised that the design should limit the possibility to travel the wrong way on roads where the opposite directions are physically separated. Some of the engineering solutions that were implemented long ago, were no longer recommended, but still exist and operate well when properly equipped with traffic signs and markings Ghost riders were also identified on new roads. After specially dedicated inspections with road traffic specialists and police, some additional signs minimising of the potential of unintentional wrong-way driving were installed. Solutions were adapted and placed on other new and existing roads as shown in the photo above. These actions removed the need to rebuild. This solution is used on new investments with practically zero additional costs.
As mentioned in the previous section, there are established methods that help detect, prioritise and treat high crash-risk sites based solely on prior crash history. Although these locations should be a target for funding and attention, they only comprise a small proportion of the network that is responsible for casualty crashes, especially in higher income countries. For example, SWOV (2007) reports that in the Netherlands during 1987–89, only 10.5% of all fatal and hospital in patient crashes occurred at blackspot locations. In the 1997–99 period, this had declined to 6%. For the period between 2004 and 2006, the figure was only 1.8%. This study concludes that an increasing number of serious crashes occur at locations that are not blackspots.
Proactive safety actions can be employed to avoid future crashes by:
It should be noted that proactive actions, whilst being a preventative measure, should not be a simple check of compliance with design standards. Often the design can meet standards, but due to the configuration, or due to adoption of minimum standards on a number of road elements, the design may be unsafe.
This section will discuss several types of road safety checks that are generally performed at different stages of implementation of a road scheme. These checks may occur for a new road or road feature, modification to an existing road or feature, and even during the usual operation of a road.
Although the focus of this chapter is on identifying risks, and the tools used in this process, some of the approaches described also help in the identification of solutions or even in the prioritisation of interventions (both discussed in Intervention Selection And Prioritisation). The content beyond the risk identification stage is also included in this chapter where relevant for completeness. Therefore, this material should be read alongside the following chapter on treatment selection and prioritisation.
The road safety check types are:
It should be noted that safety inspection of existing roads is sometimes referred to as an audit of existing roads in some countries, but the terms refer to a similar process.
The aim of each of these road safety checks are similar, however, the main distinction is in the timing and scope of the procedures, as shown in Figure 10.6. Road assessment programmes are typically used to assess roads that are already in use, but recent developments have extended this to include assessment of road design.
Given the different timing and scope of each procedure, all can be undertaken in parallel. It is up to individual countries as to which procedures are adopted. Each has different advantages and weaknesses, and these are documented in the following sections.

Figure 10.8 Sequence of road safety checks during the design stages
Some of the main objectives and benefits of undertaking any of these road safety checks include (PIARC 2012a):
The different road safety check types are thoroughly outlined in a number of national guidelines, some of which are available internationally. Example guidelines are provided throughout the remainder of this chapter.
Other tools to assess safety at the planning and development stage are included in Management Tools. Some of these tools are designed for use by practitioners with little or no road safety experience, and are intended to identify and address risk at the earliest stages of project and programme development.
Road safety checks generally follows a similar managerial procedure. This is outlined in Figure 10.7, which also indicates who has responsibility for each stage of the process.

Figure 10.9 Steps involved in a safety check and allocation of responsibility
Road safety impact assessment is conducted for infrastructure projects at the initial planning stage before the infrastructure project is approved. It indicates the road safety considerations which contribute to the selection of the proposed solution and provides all relevant information necessary for a cost-benefit analysis of the different options assessed. This allows a comparison of the impact of different road or traffic schemes on safety performance. These could be for a new road or for modification to an existing road. This is a procedure that should first be performed in the initial planning stage of a project to assist in the selection process for major infrastructure projects and should then be continually reviewed during the draft design phase. Safety impact assessment often precedes road safety audit (Road Safety Audit in Proactive Identification), but is done as a complementary process. As identified in Examples of Infrastructure Policies, Standards and Guidelines in Policies, Standards and Guidelines, impact assessment is required for all infrastructure projects on the trans European network as part of an EU Directive.
There are five main steps to a road safety impact assessment, as outlined by Eenink et al. (2008):
1. Establish the baseline situation (year zero). This should be a measurement in terms of traffic volumes, crashes per road type, and therefore risk factors per road type. A site inspection is required to collect this data (see Diagnosing the Problem in Crash-based Identification (‘Reactive’ Approaches) for further detail regarding site inspections). The site inspection should consider all road users, the surrounding road network, topography, local amenities and activity centres, local weather conditions, previous road safety reviews, and any complaints received from the community regarding the site.
2. Determine the future situation without any implemented measures (known as the ‘Do Nothing’ or ‘Do Minimum’ scenario). This should consider current circumstances and conditions and should account for traffic growth.
3. Determine the future situation under each of the applied road safety schemes. This should include a wide variety of alternatives and an estimate of the effects per road type. It should consider each road user group for each of the schemes. Each scheme should be measured in terms of its impact on the number of crashes and crash severity through a crash prediction model (see AASHTO, 2010).
4. Perform cost-benefit analysis for each possible road safety scheme. This is done by assigning a monetary value to the safety impacts of each scheme and allows for the schemes to be ranked in order of effectiveness.
5. Optimize the plans of each scheme. This is done to achieve the optimal safety effect and best cost-benefit rating.
A detailed final report should be completed at the end of the road safety impact assessment. This should include such details as:
During a road safety impact assessment it is important to ask certain questions. Are the road safety policy targets realistic or ambitious? Are there other cost-effective schemes that have not been considered yet? Are the selected schemes suitable, not just in terms of safety, but in terms of other issues such as impacts on the environment, or accessibility and connectivity for all road users? Are there any associated social issues, such as a lack of support from the community?
It is important to note that a road safety impact assessment does not replace a road safety audit; it is merely a preliminary step towards selecting the most beneficial design for a project. Road safety audits are essential for ensuring all hazards are identified throughout the detailed design and construction processes, which will be discussed in detail in Road Safety Audit in Proactive Identification.
Part C of the Highway Safety Manual (AASHTO, 2010) provides information on crash prediction models for different road types, including rural two-lane, two-way roads, rural multi-lane highways, and urban and suburban arterials. It covers both undivided and divided roadway segments, and intersections with various control devices and numbers of legs. This can be used to predict the expected average crash frequency, which is determined based on traffic volumes and roadway characteristics. More on the Highway Safety Manual can be found in Box 10.3.
The IHSDM is a suite of software for evaluating the safety and operational effects of geometric design decisions (from design plans). These are advanced safety analysis and prediction tools, and considered ‘best practice’ by many safety professionals (see e.g. Schermers et al., 2011).
The development of these tools is based on a wide and robust range of research including on crash prediction models and crash modification factors (CMFs) undertaken mainly in North America over the last 15 to 20 years. IHSDM is particularly useful for selecting the safest option from a list of possible options and for understanding the safety trade-off that might result from a lower standard design that may be required due to site constraints or construction cost savings. This tool uses crash prediction models and CMFs to predict crash occurrence. The models and CMFs are continually being refined as new research becomes available. IHSDM has calibration procedures that allow it to be customised for each US state or for other jurisdictions. Testing of these procedures has occurred in some European countries as well as Australasia.
The international Road Assessment Programme (iRAP) has developed a technique to star rate design plans. Although not strictly an impact assessment, the process fulfils a similar purpose. Details on this approach can be found in the case study in Management Tools.
© ARRB Group
A road safety audit is defined as a formal and independent technical check of a road scheme design and construction, to identify any unsafe features or potential hazards and to provide recommendations for rectifying them during all stages, from planning to early operation (PIARC, 2011; ETSC, 1997; NRA, 2012).
The main aim of a road safety audit is to identify and address any road safety issues. A road safety audit is not a check against design standards, but a hazard detection tool. A road scheme, when audited, should be analysed under all operating conditions and consider all road users.
Road safety audit is thought to be a cost-effective measure for identifying and addressing likely safety issues. The earlier the audit is undertaken, the greater the benefit, as adjusting design plans can be a cheaper option than retrofitting safety features once a scheme has been built. Several studies have documented the benefits of conducting road safety audits. As an example, Macaulay and McInerney (2002) estimated that a sample of design stage audits had a benefit cost ratio (BCR) of between 3:1 and 242:1 by implementing all the recommendations from individual audits. In addition, 75% of recommendations had a BCR greater than 10, and 90% of recommendations had a BCR greater than 1.
Road safety audits (as well as other proactive methods) are very important for LMICs, as they provide an opportunity to develop a culture of road safety amongst those responsible for the planning and delivery of road infrastructure. On this basis alone there is a very strong case for the development of a formalised process for road safety audits for all major infrastructure projects. The Kazakhstand case study provides an example of some of the added benefits that can be gained from large road safety audit projects in LMICs.
Many international guides exist on how to conduct road safety audits. PIARC developed a Road Safety Audit Guide (2011; www.piarc.org/ressources/publications/7/6852,WEB-2011R01-TM.pdf) that provides a comprehensive step-by-step procedure on how to conduct a road safety audit, as well as providing detailed individual checklists for motorways, inter-urban and urban main roads at each of the design stages (feasibility study, preliminary design, detailed design, and pre- and post traffic opening). The guide also provides checklists for road safety audit, which are discussed in more detail below. Other useful guides include the FHWA Road Safety Audit Guidelines (2006; also see http://safety.fhwa.dot.gov/rsa/) and the Austroads Guide on Road Safety Audit (2009b). The African Development Bank (2014b) has recently released guidance that is specifically intended for use in LMICs.
A road safety audit may be undertaken through planning, design and operations, as well as, other circumstances, for example to assess the safety of proposed traffic management at roadworks, particularly in busy and complex situations.
As identified in Section Examples of Infrastructure Policies, Standards and Guidelines in Policies, Standards and Guidelines , the EU Directive on road infrastructure safety management states that road safety audit be conducted on all infrastructure projects on the trans-national highway in Europe, and suggests that these should also occur for all national roads. The Directive also states that such audits should be conducted at the draft design, detailed design, pre-opening and early operation stages.
The PIARC (2011) guide identifies three parts in the auditing process – commissioning, undertaking and completion. Details on each of these stages are provided in that document.
The selection of an appropriately skilled audit team is an important part of the commissioning phase of the audit process. It is essential that the team is independent of the design team. The size and make-up of the team will vary depending on the size and complexity of the project and the stage of audit being undertaken. It is important that the team members, and particularly the team leader, have the necessary training to undertake a road safety audit. Many countries have developed formal training requirements (sometimes referred to within national guidance on road safety audit) and registers of appropriately qualified auditors. For smaller projects, it may be possible for a single auditor to complete a ‘road safety check’, and although this is not ideal, it is certainly preferable to no audit at all.
The availability and development of suitably skilled road safety auditors is an important challenge for those in LMICs. Capacity can be increased in the short term by training of key staff (either within their own country, or through established courses in HICs). In the medium term it is desirable to establish capacity within a country to train auditors. This will typically require some form of longer term ‘train the trainer’ approach, whereby a small number of experts are provided with advanced training and on-going support. These experts then develop skills through experience to a point where they are in a position to train others.
Many countries have developed checklists for conducting road safety audits. These checklists provide examples and reminders of issues that should be assessed by audit teams during their assessment. They are useful to ensure that key issues are considered, but it also needs to be recognised that every situation differs, and therefore checklists should typically be used as guides only. This is because there may be other issues identified during an audit that were not anticipated by the existing checklist. Different checklists have been developed for different stages of the road safety audit process, or for specialist types of audit (for example, pedestrian and bicycle audits).
One criticism of road safety audits in the past is that the recommendations from the audit are not implemented. It is therefore critical that there be a process to complete the audit, including a formal response to the report. This should document a response to each of the actions recommended; and in cases where recommendations have not been accepted, the reasons for this and any other mitigating strategy that will be undertaken to help minimise risk should be stated. This written response to the audit report should become part of the project documentation.
Harwood et al. (2014) suggested that audit was a costly method for identifying interventions, and that there is potential to miss interventions that could be added that are cost-effective ways to improve safety. Also, economic assessment of interventions is typically not included unless conducted as an addition to the normal audit process. On the positive side, they suggest that audit is a useful way to identify safety features that are missing or in poor condition, and that they are a good way to bring together expert staff to review safety. They also identified advantages in conducting field reviews (i.e. site inspections), a process not always undertaken in other methods of risk assessment.
It is important to note that the road safety audit process has been around for many years. It was first established in the late 1980s, with documentation developed in many countries from the 1990s. However, there has been little recent adjustment of the road safety audit process to include Safe System concepts. In some countries, the focus is shifting to better capture issues related to eliminating death and serious injury, although this has always been an integral part of the audit process. The focus remains primarily on road-based deficiencies and the solutions are generally aimed at improving the road environment. In many situations, this approach may be adequate; however, to take a Safe System-based approach, some jurisdictions have developed assessment frameworks that could be considered Safe System audits. These differ to traditional audits because they focus attention on the reduction of fatal and serious casualties and/or take a more holistic view of problems (and solutions) involving each of the Safe System pillars (e.g. safe user issues such as fatigue, potential for speed related crashes). The Australia case study provides one such example.
A further example was developed by the Department of Planning, Transport, and Infrastructure (DPTI) in South Australia. This involved a full Safe System assessment for a major project and was used as part of a successful business case to government to secure funding. The approach differed from a typical audit because it assessed vehicle and behavioural issues as well as the typical infrastructure issues. Interestingly, some of the vehicle and behavioural issues identified were able to be addressed through infrastructure changes (also see the discussion in Designing Infrastructure to Encourage Behavior).
In a recent development, quantified audits have been undertaken to determine the impact of new design. Changes can be made to this design and likely safety improvements determined. An example of this approach is provided in Management Tools.

© ARRB Group
The PIARC Road Safety Inspection Guideline for Safety Checks of Existing Roads (2012a) defines a road safety inspection (RSI) as a systematic, on-site review of an existing road with the aim of identifying hazardous conditions, faults and deficiencies that may lead to serious crash outcomes. An RSI must be carried out by an independent, qualified individual or team with the relevant experience, and is specific to existing roads, not those under construction. It is also a proactive method in that the prevention of crashes is achieved through identification of potential safety issues, rather than responding to recorded crashes in a crash location investigation.
Road safety inspections are useful as they can:
The PIARC (2012a) guide identifies the following topics as necessary to be covered during an RSI, as well as some of the questions a safety check team should be considering during an investigation:
There are four main steps to a road safety inspection on an existing road.
An on-site field study component of RSI has evolved in recent years. Survey vehicles can be equipped with automated devices to measure and record design and road management elements (e.g. horizontal and vertical alignment, super-elevation, pavement surface condition, presence of roadside hazards, road inventory etc.). This information can be assessed to detect issues with routes, such as anomalies in curvature (e.g. unexpected severe curves); slippery road surface or presence of roadside hazards. Further details on this data collection can be found in Section 5.4.
A road safety inspection of an existing road aims to detect features that may lead to future crashes, and past crash information is not always a good indicator of this. Crash investigation and prevention programmes look at features that contribute to the occurrence and severity of crashes that have already happened. An RSI does not require crash data, but it can be a useful tool in terms of providing guidance towards prioritising which roads should be inspected. For instance, if the road authority only has enough funding to inspect a select number of roads, priority can be given to roads with a high number of crashes per kilometre, or crashes per traffic volume. More detail on prioritisation of policies, projects and treatments can be found in Priority Ranking Methods and Economic Assessment. Road safety inspections can be a useful complement to reactive approaches, such as high crash location investigations.
Sometimes RSI is undertaken on specific themes, for instance to identify issues relating to pedestrians or bicycles. This approach has been developed even further in France, where a method involving a specially equipped bicycle has been established to assess the bicycle network. Further information on this approach can be found at the following link: http://www.ouest.cerema.fr/IMG/pdf/120925_Securite-routiere_Velaudit_cle05dc7d.pdf.
An RSI is not the same as a routine maintenance check, where issues such as vegetation, road surface inconsistencies and poor quality signage are reviewed and remedied. However, an RSI can identify safety issues that are a result of poor maintenance, such as poor signing, line marking or visibility issues.
Road safety inspections can lead to:
Human factors are a crucial part of identifying hazards at a site. Further discussion on this issue can be found in Design for Road User Characteristics and Compliance.
Road safety inspections can be performed on the whole road network or on specific locations that are regarded as being the greatest risk. This is dependent on the road authority. It is important to note that road safety inspections of existing sites can result in a huge number of identified hazards and road safety issues. Under these circumstances, it is not economically viable to attend to all the issues listed. There is also little benefit to conducting an RSI on a site if the resources will not allow the majority of hazards to be addressed following the inspection. Sometimes it is more beneficial to invest in a maintenance programme to address a number of issues rather than conduct a formal RSI.
The PIARC Road Safety Inspection Guideline for Safety Checks of Existing Roads (2012a) provides a number of helpful checklists for different road types to ensure that each investigation of a site considers all the necessary elements. The checklists are similar in nature to those used for road safety audit. The guide also provides examples of appropriate RSI reports for both inter-urban and urban main roads. The African Development Bank (2014c) has recently released guidance on Road Safety Inspection that is specifically intended for use in LMICs.

© ARRB Group
Recognizing the critical need to improve pedestrian infrastructure quality and safety, PIARC developed the Walkability Checklist and the Checklist for Quality and Safety Inspections of Pedestrian Infrastructure. Both of these Checklists are discussed in detail in the following article: Pedestrian Audits - A Checklist for Safety and Quality Inspection of Pedestrian Infrastructure. The intent of these checklists are to find optimal solutions for walking and sojourning. The checklists incorporated Rumar's order of problems approach, where there orders of requirements are defined in three levels (Rumar, 2002). The first level requirements are those visible, tangible and concrete requirement concerning the physical environment, pedestrians, vehicles and the behaviours of other road users. The second order requirements concern the tactical level facilities and services, such as how the network is designed and operates, the traffic rules, and enforcement, management of the system and other like elements. The third order requirements allow the first and second order requirements to be met. These include land use characteristics, mode split, pedestrian quality, the culture, and other aspects that relate to the ease and desire to walk. The Walkability Checklist considers the design of the roadside environment as first order requirements, with traffic rules and traffic flow as second order requirements. The checklist recognise that requirements go beyond objects, facilities and services to consider context, process and procedures. The Walkability Checklist reviews pedestrian quality elements and whether general walkability requirements are fulfilled. The Checklist also helps define the stakeholders' responsibilities for the walkability requirements under consideration and what procedures need to be applied.
The Checklist for Quality and Safety Inspections of Pedestrian Infrastructure (CQSI) builds upon the Pedestrian Quality Needs (PQN) Inspection process. In general, the PQN is a systemic onsite expert review of the walking condition requirements through identification of hazardous conditions, faults and deficiencies that reduce pedestrian demand, conditions, comfort and safety. Because the PQN considers the quality and safety concerns of the pedestrian infrastructure, the CQSI was developed as the next step to the PQN. The checklist is intended to identify all of the relevant deficiencies of the pedestrian infrastructure. The photo below provides an example of a pedestrian deficiency that might be identified through the pedestrian audit process.
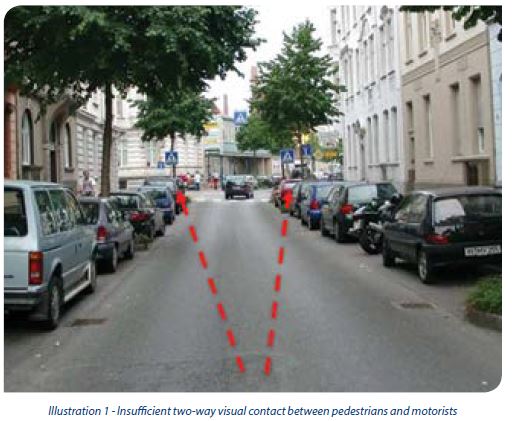
Example of pedestrian deficiency (Source: Routes/Roads 2018 - N 376 - www.piarc.org
The proactive approach has been extended with a method that takes a quantified approach to the inspection of existing roads and road designs. Although several approaches exist, the most commonly applied is the Road Assessment Programme (RAP). Different RAP programmes exist in different regions, including EuroRAP, USRAP, AusRAP, KiwiRAP and ChinaRAP. These all fall under the global banner of iRAP (the International Road Assessment Programme). PIARC (2012b) notes that the iRAP approach is of great benefit where crash data is unavailable or coverage is limited.
RAPs take the concept of road safety audit and inspection a step further by estimating the risk (based on likelihood and severity) for different road sections based on road and roadside characteristics. A number of road elements are collected (e.g. through video and subsequent desk-based assessment; also see Non Crash data and Recoding Systems). Based on research conducted over many years, a lot is known about each of these variables, and the level of risk each produces. As an example, a straight section of road is safer than a road with a severe bend, and this risk level can be quantified. Each of the variables is quantified and an algorithm determines the risk of a fatal or serious injury for each segment of road (iRAP uses 100 m segments).
Such an assessment can be used to identify the highest risk and lowest risk segments of a network or road. A five-star rating system is used, with a one-star road providing the poorest road infrastructure, while on a five-star road the likelihood of a crash occurring and the severity of those that do occur is lowest. This information can also be colour-coded to provide a quick visual indication of road infrastructure safety. The process also allows separate star ratings for different types of road user (e.g. the vehicle occupant, pedestrian, bicyclist and motorcyclist).
The information can also be used to identify safety improvements that may be implemented, both at specific locations and across a whole network. Calculations can be updated to determine the likely safety benefit from such improvements. With knowledge of treatment costs and their benefit, as well as estimates of fatal and serious crash outcomes for a road network, an economic calculation can be undertaken to determine the most beneficial group of treatments to be applied to a road network or at a location. The software for this analysis is available online, and is provided free to road authorities to use. Further details on this can be found in Intervention Selection and Identification while a detailed description of the iRAP approach can be found at www.irap.org.
Reflecting the strong empirical basis behind the iRAP model, there is a strong linkage between the star rating of a road and the actual safety performance. An analysis performed by McInerney & Fletcher (2013) based on star ratings and crash cost (the average vehicle occupant fatal and serious injury crash costs per vehicle kilometre travelled) for almost 1,700 km of highway provides an example of this relationship. For each reduction in star rating (i.e. improvement in safety), the crash cost roughly halved. When moving from 1 star to 2, the crash cost reduced by 40%; from 2 star to 3 costs reduced by 61%; and from 3 star to 4 costs reduced by 44%.
Harwood et al. (2014) assessed the US RAP tools and compared this approach to other methods of assessing risk. They suggested that the approach was the most robust and quantitative in selecting interventions to improve safety, and that the recommendations were accompanied by economic assessment often missing in other methods. However, the approach was also identified as being quite labour intensive, with reliance on collecting roadway data and the coding of this data by skilled staff. However, they also suggested that this could be accomplished in a reasonably efficient manner. The consideration of risks associated with specific road user groups (motorcyclists, pedestrians, bicyclists as well as vehicle occupants) was also seen as an advantage.
A similar approach was adopted in South Africa, with the use of Netsafe
Both the historical crash-based approach (reactive) and the assessment of risk through proactive means provide information on likely future crash locations. Combining these two approaches can provide a fuller picture of current risk locations, and where fatal and serious injury (FSI) casualties are most likely to occur in the future. Several approaches are emerging around the world that attempt to combine these methods to provide a fuller understanding of crash risk.
A ‘systemic’ safety project approach has been in the USA since the mid-1990s, first used in Washington State and recently throughout the USA (Preston et al., 2013). The systemic approach focuses on network-wide solutions and has been used by numerous states in the USA over the past decade. The System Safety Project Selection tool was developed by Federal Highway Administration in the USA. This approach involves several steps, drawing on both crash data as well as other sources of information to identify and treat risk. The steps are as follows:
— by selecting crash types and facilities with the greatest number of severe crashes across the system;
— by identifying and evaluating crash risk factors through examining the traffic volume, roadway/intersection features, posted speed limit, etc.
— by prioritising locations through conducting a risk assessment and prioritising roadway facilities.
The systemic approach identifies treatment sites that are not typically identified through traditional reactive analytical techniques (see Crash-based Identification (‘Reactive’ Approaches)). Central to this approach is the risk assessment approach, which involves the collection of roadway and traffic characteristics that relate to the selected risk factors and crash types. This is used to help identify the potential for locations or road segments to have severe crash outcomes. It is suggested that such information be collected either from existing road and traffic databases or collected as part of a field review. In an example provided by Preston et al. (2013), an assessment of curves on a rural network identified a number of sites that had common risk characteristics as locations with severe crash outcomes, but that did not have a documented severe crash. It should be noted that the approach can be used with or without crash data.
Harwood et al. (2014) reviewed the systemic approach, identifying several strengths as well as areas for potential improvement. They suggested that this approach required less roadway data than other tools, did not require crash data to identify specific crash locations, and provided greater flexibility for target crash types and risk factors. However, this flexibility was also seen as a possible weakness, as there is a reliance on users to identify potential risk factors, weight these risk factors, include issues such as traffic volume, and to conduct a cost-benefit analysis (an optional task) as part of intervention selection.
An approach has been developed in Australia that combines crash data with a more proactive approach. The Australian National Risk Assessment Model (ANRAM) provides road agencies in Australia with a nationally consistent system for identification, measurement and reporting of severe crash risk. ANRAM was developed in close consultation with road agencies and the Australian Automobile Association (AAA) to ensure that the system’s outputs could drive preparation of future road safety engineering programmes. This was especially important for rural and local roads where severe crashes are generally too scattered to attract traditional blackspot funding. However, it was also recognised that these scattered crashes form a large proportion of all fatal and serious injury crash outcomes.
ANRAM draws together a number of approaches, from traditional crash-based assessment, Road Assessment Programmes and the US Highway Safety Manual (HSM; AASHTO, 2010). The HSM proposes a method that identifies a level of safety performance for different types of roads. There will be individual variation from this mean crash frequency, which may be due to each location’s variation in road features and operational factors that differ from the mean represented by the model, and due to statistical error. This variation in road features can be measured and the effect of this variation calculated; and in the case of ANRAM, the iRAP model (AusRAP in Australia) is used to do this. The process leads to a predicted number of crashes based on road design elements and features. This ‘proactive’ assessment of risk forms one of the key inputs to the identification of fatal and serious injury crash locations.
The basic structure of ANRAM is provided in Figure 10.9. Further details on this approach can be found in Steinmetz et al. (2014).
")
Figure 10.10 Structure of the Australian National Risk Assessment Model (ANRAM)
In New Zealand, the High Risk Rural Roads Guide (NZ Transport Agency, 2011) provides guidance on the use of crash data and predictive risk approaches (such as KiwiRAP) to determine high risk locations.
The New Zealand approach involves calculation and assessment of collective and personal (or individual) risk. Collective risk indicates crash frequency as experienced by the community, i.e. annual average crashes per kilometre of road being assessed. Personal (or individual) risk indicates risk to an individual road user expressed per kilometre of travel by a vehicle, i.e. annual average crashes per vehicle-kilometres travelled (VKT). Historical crash data (reactive) and/or predictive risk assessment (proactive) is used. Both approaches use a scale to categorise the level of risk: high (black), medium-high (red), medium (orange), low-medium (yellow) and low (green).
Using historical crash data (reactive approach) to identify the highest risk sections along the road, the collective and personal risk is categorised into different risk levels. Using this information, the highest risk sections of the road can be identified.
Alternatively, or in addition, a predictive risk assessment approach can be used. KiwiRAP star rating and road protection scores assess road crash risk based on road infrastructure (engineering) features. Star ratings (which typically apply to five kilometre road sections) are derived from the road protection scores (which are calculated for each 100 m segment). Figure 10.10 provides an example of risk categorisations that may be applied.
 - Source: NZTA (2011).")
Figure 10.11 Example of predictive assessment (‘proactive’) - Source: NZTA (2011).
The New Zealand Guide (NZ Transport Agency, 2011) recommends crash data analysis and review of key risk factors to inform development of an appropriate treatment programme to address the identified risk. Consideration of a road’s collective and personal risk helps guide the approach to road safety investment (refer to Project-Level and Network-level Approaches).
AASHTO (2010) Highway Safety Manual, American Association of State Highway and Transportation Officials, Washington D.C.
African Development Bank, 2014a, Road safety manuals for Africa - Existing Roads: Reactive Approaches, African Development Bank, Tunis, Tunisia.
African Development Bank, 2014b, Road safety manuals for Africa - New Roads and Schemes: Road Safety Audit, African Development Bank, Tunis, Tunisia.
African Development Bank, 2014c, Road safety manuals for Africa - Existing Roads: Proactive Approaches, African Development Bank, Tunis, Tunisia.
Austroads 2009a, Guide to Road Safety Part 8: Treatment of Crash Locations, Austroads, Sydney, Australia.
Austroads 2009b, Guide to Road Safety Part 6: Road Safety Audit. Austroads, Sydney, Australia.
De Roos, M., Job, R.F.S., Graham, A. Levett, S. 2008, Strategic road safety successes from multi-disciplinary highway safety reviews. Proceedings of Safe Highways of the Future Conference, Brussels, Belgium, February, 2008.
Eenink, R, Reurings. M, Elvik, R, Cardoso, J, Wichert, S & Stefan, C (2008), Accident Prediction Models and Road Safety Impact Assessment: recommendations for using these tools. Deliverable D.2. Ripcord-Riserest.
ETSC 1997, Road Safety Audit and Safety Impact Assessment, European Transport Safety Council, Brussels, Belgium.
EuroRAP 2013, Development of a Safer Road Corridors Investment Plan World Bank project 1080490: Safer Roads Investment Plan, European Road Assessment Programme, Basingstoke, United Kingdom.
FHWA, 2006, Road Safety Audit Guidelines, Federal Highway Administration, Washington DC.
Harwood, D, Souleyrette, R, Fields, M, & Green, E 2014, Comparison of Countermeasure Selection Methods for Use in Road Safety Management, 93rd Transportation Research Board Annual Meeting, Washington DC, USA.
Macaulay, J & McInerney, R 2002, Evaluation of the proposed actions emanating from road safety audits, Austroads, Sydney, Australia.
Marsh, B (2012), Towards Zero Road Planning, Design and Construction, 25th ARRB Conference – Shaping the future: Linking policy, research and outcomes, Perth, Australia
McInerney, R and Fletcher, M 2013, Relationship between Star Ratings and crash cost per kilometre travelled: the Bruce Highway, Australia, International Road Assessment Programme, Basingstoke, United Kingdom.
NRA National Roads Authority of Ireland, 2012, Road Safety Impact Assessment (HD18), Dublin, Ireland.
NZ Transport Agency (2011), High Risk Rural Roads Guide. New Zealand Transport Agency, Wellington, New Zealand.
PIARC (2011) Road Safety Audit Guide, Report 2011R01EN, World Road Association, Paris, France.
PIARC (2012a) Road Safety Inspection Guideline for Safety Checks of Existing Roads, Report 2012R27EN, World Road Association, Paris, France.
PIARC (2012b), Comparison of National Road Safety Policies and Plans, PIARC Technical Committee C.2 Safer Road Operations, Report 2012R31EN, The World Road Association, Paris.
PIARC (2013) Road accident investigation guidelines for road engineers, Report 2013R07EN, World Road Association (PIARC), Paris, France.
Preston, H, Storm, R, Bennett, J D, & Wemple, B, 2013, Systemic safety project selection tool, FHWA, Washington DC.
RoSPA (2007).Road safety engineering manual, Royal Society for the Prevention of Accidents, Birmingham, UK.
Schermers, G, Cardoso, J, Elvik, R, Weller, G, Dietze, M, Reurings, M, Azeredo, S, and Charman, S, 2011, Recommendations for the development and application of Evaluation Tools for road infrastructure safety management in the EU, Deliverables Nr 7 of the European Road Infrastructure Safety Management Evaluation Tools (RISMET) project, Eranet Roads, Leidschendam, Netherlands.
Steinmetz, L, Jurewicz, C & Excell, R 2014, Implementation of Australia’s New Road Crash Risk Assessment Approach, Routes – Routes/Roads no 363, PIARC, Paris, France.
SWOV, 2007, The blackspot approach. SWOV Factsheet. SWOV, Leidschendam, the Netherlands. September 2007. http://www.swov.nl/rapport/Factsheets/UK/FS_Blackspots.pdf.
TRB, (2015), NCHRP Report 600: Human Factors Guidelines for Road Systems: Second Edition, Transportation Research Board, National Cooperative Research Program, Washington D.C., USA
Directive 2008/96/EC of the European Parliament and of the Council on road infrastructure safety management
WHO 2010, Data systems: a road safety manual for decision-makers and practitioners, World Health Organization, Geneva, Switzerland.
Once risk locations have been identified, and relevant information analysed to identify the likely causes, there is a need to select interventions and prioritise these for action. Figure 11.1 shows how these fit within the Road Infrastructure Safety Management process for managing safety.

Figure 11.1 Intervention selection and prioritisation within the Road Infrastructure Management process
There is a cost associated with every road safety infrastructure intervention. Every country has a limited budget available with which to make road safety improvements, and so it is important to ensure that reductions in deaths and serious injuries are maximised within the budget available. This requires good knowledge about the effectiveness of road safety interventions in different circumstances. It also requires a process to help prioritise the installation of safety treatments. Interventions are the individual and collective actions that are taken to address risk. The terms ‘countermeasures’ or ‘treatments’ are also used.
This chapter provides information on the selection and prioritisation of effective road safety engineering interventions. It provides advice on the types of options that are available, and the process and tools that can be used to decide upon the most appropriate options. Intervention options and selection are outlined in Intervention Option and Selection. In order to maximise safety outcomes, a priority ranking method is required, and this is typically based on economic assessment. This process is described in Priority Ranking Methods and Economic Assessments
Several guidelines exist on some of the key crash types that contribute most to death and serious injury. Some of these are aimed at addressing problems in LMICs, and provide information on effective interventions. These include:
PIARC has produced a guide to saving lives around the world with proven countermeasure (see https://www.piarc.org/en/order-library/). The countermeasures highlighted in this guide are notable because they have proven track records of success in multiple countries. Issues and priorities of low- and middle-income countries (LMIC) were inputs used to determine the list of proven countermeasures.
Other documents exist that provide more general advice for these and other key crash types (i.e. they are not specifically targeted at the issues in LMICs). Some of these documents are freely accessible and provide guidance on the following issues.
Run-off-road interventions:
Intersection crashes:
Head-on crashes:
Many other documents can be accessed via the Internet from a variety of sources on these and other crash types. However, care should be taken to ensure that documents accessed from this source have been produced by reputable agencies, and that they provide robust information. Other documents exist that provide advice on a range of crash types and appropriate interventions in an easy to access format. Key documents are listed later in this chapter.
The most cost-effective interventions to target key crash problems are well known. As a starting point, these interventions should be implemented in a targeted way on high risk routes. These include:
An ideal starting point is to implement multi-sector (e.g. including policing and education programmes) demonstration projects on key high-risk corridors utilising these effective interventions. For those just starting this is a useful way to ‘learn by doing’ in a way that is easy to manage.
Economic assessment procedures need to be established, and key staff trained in this process. This will help effectively prioritise limited budgets. It will also help prepare an adequate business case for investing in road safety.
Developing network-wide assessments to guide programme development is an essential part of a comprehensive road safety programme for a road authority. This should be based on a good understanding of system-wide risks and issues. Project-level identification of risk that is consistent with the higher level network-focused programme approach is also required. Both are discussed in Assessing Potential Risks and Identifying Issues. In a similar manner, network-level approaches can be taken to address this identified risk through effective infrastructure interventions. To address system wide issues, wide scale implementation of treatments can be undertaken. This implementation can be at the network, corridor, segment or spot location for differing timeframes.
Perhaps the best documented example of this approach is the implementation of the 2+1 road design scheme in Sweden, as described in the case study below.
As well as network-level implementation of specific treatments (such as the 2+1 design identified above), there is also scope to develop frameworks at that provide guidance on application of treatment types. As an example, a framework has been developed in New Zealand for guiding safety investment decisions based on the level of collective and/or individual crash risk. Figure 11.2 below draws on this approach and illustrates how collective and individual risk could be used to influence about cost effective outcomes. Individual risk refers to road safety risk as it applies to any one road user. It is often expressed as the chance of any given road user being involved in a crash (often in crashes per vehicle kilometre travelled, which takes into account traffic volume. Other metrics are also available. Individual risk is a useful measure for assessing the quality (in safety terms) of road infrastructure. Collective risk refers to the total expected crash outcome for all vehicles (e.g. crashes per kilometre), and is heavily influenced by traffic volume. Using information on collective and individual/personal risk the treatment types can be categorised into four groups:
.")
Figure 11.2 Framework for treatment selection on high risk rural roads - Source: Adapted from Durdin & Janssen (2012).
Roads with high traffic volumes have a high expected number of severe crashes; and those that include road engineering features which are substandard for the function, are likely to score highly in both collective and individual risk areas (the red area in Figure 11.2). Substantial investment into road safety treatments on such roads would often be justified via Safe System Transformation works, e.g. a major upgrade; provision of an alternative, higher quality route; freeway style interchanges, etc. Further examples of these higher cost, but highly effective treatments can be found in Effective Safe System Interventions in Intervention Option and Selection.
Roads that experience intermediate collective and individual risk outcomes fall in the Safer Corridors or Safety Management categories (orange and yellow areas in Figure 11.2). For example, highways in rural areas with moderate traffic volumes, some localised and scattered severe crashes, and compromised road design, may fall in the Safe Corridors area. The most effective treatment approach may be via corridor-wide improvements using a mix of high- and low cost solutions (e.g. safety barrier installations, line-marking, intersection upgrades, etc.).
Safety Management ideas may apply to roads with lower traffic volumes, more scattered severe crashes (e.g. local streets and roads) and consistently inadequate road standards. The best economic return on safety would be via network-wide and/or corridor-based application of low cost treatments, e.g. speed limit revisions, line-marking treatments, or targeted asset management (e.g. pavement resurfacing with associated safety treatments, including shoulder sealing). This group also includes roads with high collective severe crash risk due to high traffic volumes, but with a good overall road safety standard (e.g. urban motorways). The most cost-effective actions may be based on targeted systemic changes, e.g. managed freeways techniques and infrastructure supported enforcement.
Roads with low collective and individual risk (green area in Figure 11.2) are most likely candidates for Safety Maintenance activities. Safety Maintenance often involves incremental and systemic changes such as through road management (e.g. skid resistance management), improvements to signs and line-markings, and other good maintenance practices.
Figure 11.2 shows that as collective and individual risk increases, more extensive treatments are likely to be applicable. As risk progresses to higher categories, benefits from applying treatment options from the lower categories should also be considered.
Although developed and implemented in a HIC, the approach outlined is equally useful in LMICs, particularly in the upgrade of existing road infrastructure. The approach may form an effective way of helping to prioritise road safety activity.
The case study from the Czech Republic provides an example of improving safety through the use self-explaining roads.
Once the problem type has been identified (whether through crash analysis or other forms of risk assessment), the next step in the process involves the selection of an appropriate intervention. The main aims during this stage are:
There are a number of issues to consider when selecting interventions. Usually cost and economic efficiency are the first and foremost considerations, but there are also others. It is important to ensure that the intervention is cost-effective and gives a positive benefit-cost ratio, and that it can be implemented within the available budget. Based on issues identified by Ogden (1996) and BITRE (2012), other considerations include:
A ‘hierarchy of control’ is often used in risk assessment when selecting and prioritising interventions. As an example, Marsh et al. (2013) suggest that such a hierarchy helps identify a priority order for different types of road safety treatment based on outcomes. They suggested a road engineering hierarchy based on the Safe System approach to help address driver distraction and fatigue. The hierarchy has four levels, and it is suggested that level 1 equates to a level of risk where Safe System outcomes are likely:
There are a large number of safety interventions that can be used to improve road safety. Some have only a small impact on safety, while others can produce substantial reductions in death and serious injury. The concept of ‘high-performing’ infrastructure was introduced in The Role of Safer Infrastructure in Safe System Elements and application, and has been discussed in the context of the Safe System approach in several documents. For example,
Turner et al. (2009) present a framework for Safe System infrastructure solutions based on major crash types with a distinction between ‘primary’ and ‘supportive’ road safety treatments.
Primary treatments are those that have the potential to achieve Safe System outcomes or near-zero deaths and serious injuries. This can be achieved through reducing impact forces to safe levels or by separating different road users. A supportive road safety treatment is one that assists with the delivery of safety improvements, but only in an incremental way. For example, a hazard warning sign may reduce the occurrence of crashes (which can include severe crashes), but will have no impact on the severity of a crash, should one occur.
It is strongly recommended that primary treatments are employed where possible to reach the Safe System objectives. ‘Primary’ or ‘Transformational’ treatments should be presented as a first option. If these cannot be used, there would be a preference to next consider treatments that might be a stepping stone with minimal redundancy of investment, to future Safe System implementation. For example, a wide central painted median with audio-tactile lines may be installed with adequate width to allow future application of wire rope median barrier. Primary or ‘Transformational’ treatments to address key crash types are demonstrated in Table 11.1
Crash Type | Treatment “Primary” or“Transformational” | Influence (E = exposure L = likelihood S = severity) |
Head-on |
| L S S L, S |
Run-off-road |
| S S
L, S |
Intersection |
| L, S E L, S L, S L, S |
Pedestrian / Cyclist |
| E L S L, S |
Motorcyclist |
| E
|
(Source: Adapted from Austroads, 2016)
Below are some further examples of illustrated primary Safety System treatments (Figure 11.3)


Figure 11.3 Examples of Primary Safe System treatments - Source: Photos courtesy of ARRB Group Ltd unless otherwise stated.
Issues specific to LMICs regarding the use of such treatments are discussed further in Intervention Effectiveness in LMICs in Intervention Option and Selection.
NZTA (2011) refers to Safe System Transformation treatments for rural roads. These are defined as treatments that are likely to address high percentages of the fatal and serious injury crashes associated with of the three key crash types for rural roads (run-off-road, head-on and intersection crashes). It is recognised that these treatments are typically higher cost, and that they need to be implemented over a longer time period. Examples of such treatments include expressways (4-laning and 2+1 treatments), median and roadside barriers, grade separation (overpasses and interchanges), roundabouts, and effective speed management. New Zealand also provides a framework that encourages investment in Primary or “Transformational” treatments as standard safety interventions (NZTA, 2021).
The following case studies in Hungary demonstrate innovative use of primary Safe System treatments in a temporary, or low cost, application.
Where a primary solution is not feasible due to project constraints dictated by budget, site, conflicting road user needs, or the environment, the next safest “supporting” Safe System solution needs to be identified. Ideally, supporting treatments should act as stepping stones towards better Safe System alignment and be compatible with future implementation of Safe System options. In most cases, supporting treatments are those that reduce the likelihood of a crash but do little do reduce the severity outcome. For example, a wide centreline will help to reduce the probability of a crash by providing greater separation between opposing traffic flows. However, when a crash occurs the severity of injury is still likely to be high.
The case study from the Germany provides an example of a supporting Safe System treatmnt through the use a painted wide centreline to support overtaking and separate opposing traffic flows.
Supporting treatments that are compatible with future implementation of Safe System options are demonstrated in Table 11.2.
Crash Type | Treatment “Supporting” (compatible with future implementation of Safe System options) | Influence (E = exposure L = likelihood S = severity) |
Head-on |
| L L |
Run-off-road |
| S
L L, S |
Intersection |
| L, S
E L, S
|
Pedestrian / Cyclist |
| L, S L E L E, L
|
Motorcyclist |
| L
|
There are numerous additional supporting treatments that have little or essentially no effect on future implementation of primary Safe System options such as consistent delineation, skid resistance improvement, improved superelevation, audio-tactile edge and centre lines, vehicle activated signs, turning lanes, advanced direction signage and warning, improved site distance, traffic signals with fully controlled turns, skid resistance improvement, improved street lighting, pedestrian and cyclist signals, cyclist box at intersections, and motorcycle-friendly barrier systems (Austroads, 2016).
Where high risks are present for more than one crash type (as is often the case), combinations of one or more of treatment should be considered. In addition, combinations of supporting treatments, particularly in association with lower speeds, may be adequate to fully address specific crash risks.
Other measures that should also be considered to further mitigate crash risks, particularly in combination with supporting treatments, include speed enforcement, rest area provision, speed cameras combined with red light cameras, lane markings compatible with in-vehicle lane-keeping technology (Austroads, 2016).
One of the most important considerations in selecting interventions is knowledge of the safety benefit of that treatment. This benefit is often described as a crash reduction factor (the expected percentage reduction in crashes), or crash modification factor (CMF, which is the multiplier by which the crashes before treatment are adjusted; e.g. a CMF of 0.8 indicates that there will be an expected reduction of 20% in crashes). A number of sources exist that provide information on this issue (also see Box 11.1):
The Crash Modification Factor (CMF) Clearinghouse (http://www.cmfclearinghouse.org/) is one of the most comprehensive and advanced sources of information on road safety infrastructure effectiveness. Funded by the US Federal Highway Administration (FHWA), it provides a searchable database of information on infrastructure effectiveness. It is constantly updated, meaning that it is one of the most up-to-date sources of information on this topic. The CMF Clearinghouse applies a star rating (from one to five) according to the robustness of each CMF. This rating was updated to be based on study design, sample size, standard error, potential biases, and data source.
 Clearinghouse")
The Crash Modification Factor (CMF) Clearinghouse
Given the objective of the Safe System approach is to eliminate death and serious injury, it is important to understand the effect that different interventions have on fatal and serious outcomes. However, much of the research on intervention effectiveness provides information on casualty reduction (i.e. reduction in deaths, serious injury and minor injury combined) or on change in all crashes (including non-injury). This is an important distinction, and it is unfortunate that information on fatal and serious outcomes is so scarce. Although it is desirable to minimise all crash types, including crashes that do not result in injury, an overall reduction in fatal and serious injury is paramount. Safety professionals should not be put off using interventions that have a neutral effect on minor and non-injury crashes, and there may actually be situations where such crashes will increase (typically through a reduction in severity of the crashes that do continue to occur at a treated location).
In the absence of information on the effect of interventions on fatal and serious crash outcomes, information on casualty reduction should be used, although an element of engineering judgement may also be required when using this information. The expected reduction in fatal and serious crash outcomes is often higher than the reduction in all casualties. As an example, BITRE (2012) found the impact on crashes from installation of roundabouts to be greater for higher severity outcomes:
Similar trends were seen in a European study by Jensen (2013). Therefore, using the casualty reduction will often lead to a conservative value for the expected reduction in fatal and serious injury.
The following matrix (Table 11.3) provides a basic summary of road safety treatment options and their effectiveness on some of the key crash types that result in fatal and serious injury. Detailed information on each of these treatments can be found in the documents referenced in Selecting Interventions in Intervention Option and Selection. Broad indicative costs are also provided.
Table 11.3: Road safety countermeasures matrix
1. head on
2. Junction
3. rear-end
4. run-off-road
5.Motorcycle
6.pedestrians
| Treatment | Crash type | Cost | |||||
|---|---|---|---|---|---|---|---|
| 1. | 2. | 3. | 4. | 5. | 6. | ||
60% or more expected casualty reduction | |||||||
Intersection – roundabout | ✓ | $$ | |||||
Median barrier | ✓ | ✓ | $$ | ||||
Pedestrian crossing – grade separation | ✓ | $$$ | |||||
Pedestrian footpath | ✓ | $$ | |||||
Railway crossing control | ✓ | $$ | |||||
Roadside safety – barriers | ✓ | $$ | |||||
25–40% expected casualty reduction | |||||||
Additional lane | ✓ | ✓ | $$$ | ||||
Motorcycle lanes | ✓ | $$$ | |||||
Duplication | ✓ | $$$ | |||||
Intersection – grade separation | ✓ | ✓ | ✓ | $$$ | |||
Intersection – signalised | ✓ | $$ | |||||
Lane widening | ✓ | ✓ | ✓ | $$ | |||
One-way network | ✓ | ✓ | ✓ | $$$ | |||
Pedestrian crossing – unsignalised | ✓ | $ | |||||
Pedestrian crossing – signalised | ✓ | $$ | |||||
Pedestrian refuge island | ✓ | $ | |||||
Realignment – horizontal | ✓ | ✓ | $$$ | ||||
Restrict/combine direct access points | ✓ | ✓ | $$ | ||||
Roadside safety – hazard removal | ✓ | $$ | |||||
Service road | ✓ | ✓ | $$$ | ||||
Shoulder sealing | ✓ | ✓ | ✓ | ✓ | $$ | ||
Skid resistance | ✓ | ✓ | ✓ | ✓ | ✓ | $ | |
Speed management | ✓ | ✓ | ✓ | ✓ | ✓ | ✓ | $ |
Traffic calming | ✓ | ✓ | ✓ | ✓ | ✓ | $$ | |
10–25% expected casualty reduction | |||||||
Central hatching | ✓ | ✓ | $ | ||||
Central turning lane (full length) | ✓ | ✓ | $ | ||||
Delineation | ✓ | ✓ | ✓ | ✓ | $ | ||
Intersection – delineation | ✓ | ✓ | ✓ | $ | |||
Intersection – turn lanes (unsignalised) | ✓ | ✓ | ✓ | $ | |||
Intersection – turn lanes (signalised) | ✓ | ✓ | ✓ | $ | |||
Parking improvements | ✓ | ✓ | ✓ | $ | |||
Realignment – vertical | ✓ | ✓ | $$$ | ||||
Regulate roadside commercial activity | ✓ | ✓ | ✓ | $ | |||
Rumble strips | ✓ | ✓ | $ | ||||
Side-slope improvement | ✓ | $$$ | |||||
Note: $ = low cost; $$ = medium cost; $$$=high cost.
As can be seen from Table 11.3 speed management is a treatment that is able to address most key crash types. Where speed has been identified as an issue, speeds can be lowered using effective speed management. This will result in fewer fatalities and serious injuries, provided compliance is high or additional enforcement measures are utilised.
The following case studies from Puerto Rico, Portugal, Slovakia, Italy and Hungary all show examples of the effective use of interventions to improve safety.
As can be seen from Table 11.1 speed management is a treatment that is able to address most key crash types. Where speed has been identified as an issue, speeds can be lowered using effective speed management. This will result in fewer fatalities and serious injuries, provided compliance is high or additional enforcement measures are utilised.
Selecting Interventions
Interventions should be selected to suit a particular site, route or area, and to address the crash type occurring at that site, route or area. Crash types can be identified through reactive (crash based) or proactive identification methods (see Assessing Potential Risks And Identifying Issues).
Single interventions can be used, or more commonly combinations of interventions can be selected to combat a particular crash type or issue. The final intervention selection requires expert judgement about the factors that have contributed or may contribute to the occurrence of crashes.
A number of guides provide advice on appropriate interventions to address specific crash problems. PIARC (2023) provides details of road safety countermeasures based on the Safe System approach that have proven track records of success in multiple countries. The effectiveness of each proven countermeasure is noted including recommendations on crash reduction and strategies for practitioners to consider as part of implementation. The countermeasures have also been categorised based on how they address key Safe System principles, such as reducing severity, as well as targeting key crash types and vulnerable road users.
PIARC (2009) provides a detailed set of options in the Catalogue of design safety problems and potential countermeasures. Advice is provided for road function, cross-section, alignment, intersections, public and private services, vulnerable road users, traffic Signing and marking and roadside features. PIARC published The role of Road Engineering in Combatting Driver Distraction and Fatigue Road Safety Risks to highlight Driver Distraction and Fatigue from the view of the safe systems approach. Figure 11.4 shows an example of Hierarchy Level 1 Treatments. The document outlines a hierarchy of treatment approaches and provide engineering solutions to address the problem of driving distraction and fatigue road safety risks. To highlight the issue potential countermeasures for vulnerable road users the Vulnerable road users: Diagnosis of design and operational safety problems and potential countermeasures and appendix were published.
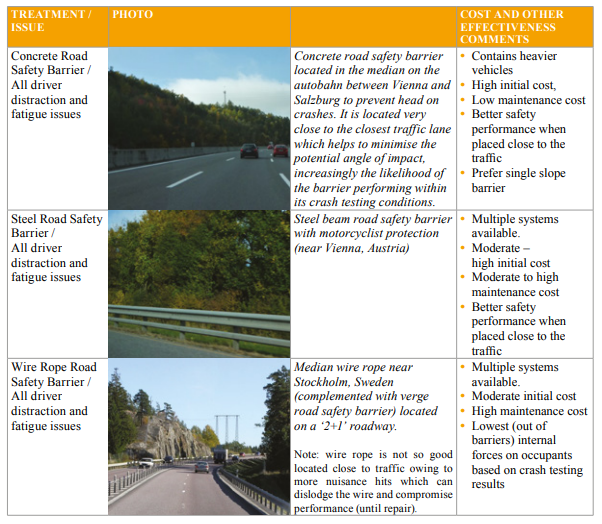
Figure 11.4 Example of Hierarchy Level 1 Treatments
A number of interventions are presented that address safety issues relating to each of these topics. In each case, information is provided on the road safety problem for each issue. Treatment types are then presented, along with photos of the treatment, basic descriptions, indicative costs, crash types addressed, and the affected road user groups. The example below (Figure 11.4) shows potential solutions for issues related to unforgiving roadsides (categorised under Roadside Features).
.")
Figure 11.5 Treatments for unforgiving roadsides from the PIARC catalogue - Source: PIARC (2009).
Several online tools exist that provide similar, and in some cases more detailed information. Some cover a wide variety of treatment types, while others concentrate on particular crash types. Both Austroads (engtoolkit.com.au) and iRAP (toolkit.irap.org) have developed online toolkits that provide guidance on treatment options to address different road safety issues. They are both regularly updated and revised, capturing the most recent findings in road safety. Each includes detailed information on crash problem types and treatments, including indicative costs, safety and other benefits, implementation issues, and references.
The Austroads toolkit is designed to address safety issues identified through crash investigation and road safety audit (safety deficiencies). Detailed information is provided on solutions, including links to relevant design documents. The Road Safety Toolkit is targeted to those working in LMICs, and has been translated into a number of languages, including French, Arabic, Spanish and Mandarin. An image from this toolkit is shown in Figure 11.5.

Figure 11.6 Pedestrian footpath treatments from the Road Safety Toolkit - Source: toolkit.irap.org.
The approach described here builds upon work completed by William Haddon who developed the Haddon Matrix (see Haddon, 1972, 1980). The Haddon matrix provides a tool for looking at factors related to personal attributes, vehicle attributes and environmental attributes before, during, and after a crash. The goal was to have the safety professional consider driver confusion, misperceptions, workload, distraction, and other factors.
The Haddon Matrix considers three phases of a crash 1) Pre-crash which includes those factors that influence whether a crash will occur and then result in injuries: 2) The crash event phase reviewing those factors that will influence crash severity during the crash event; 3) The post crash phase the influence the survivability of crash after the event. To this Milton and van Schalkwyk (2022) expanded on the matrix to provide a framework the directly considered all road users (e.g., the volume of biking and walking) as well as the supporting social safety environment -- consistent with the Safe System approach -- added user mix considerations and interactions between these factors to Campbell et. al., Human Factors Interaction Matrix (2018). The figure below shows the Modified-Haddon Matrix applied to motor vehicle crashes in the Safe System.
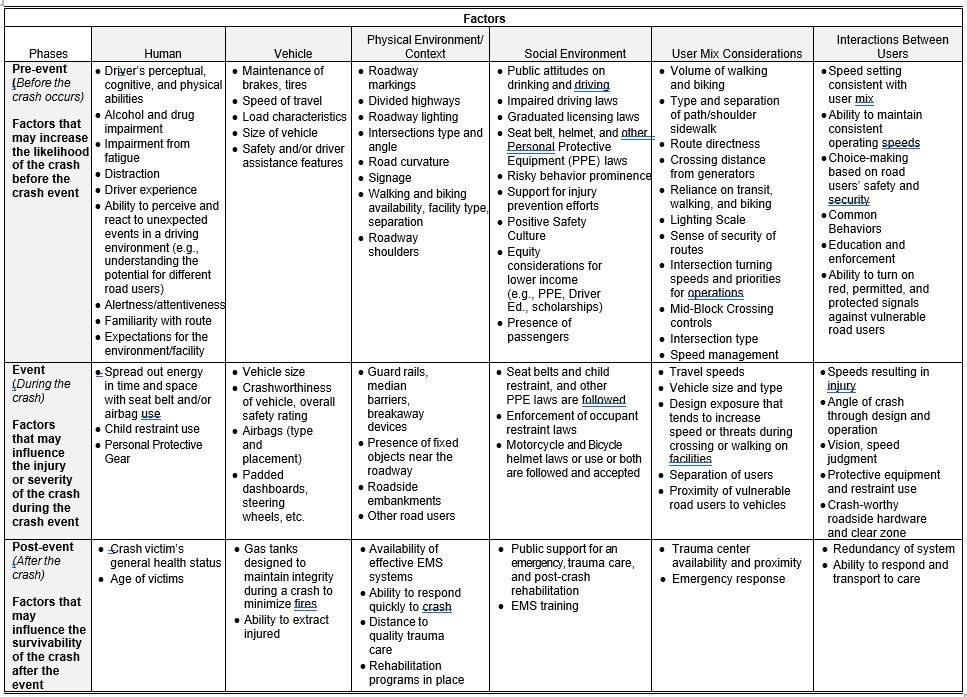
Figure 11.7 Modified-Haddon Matrix applied to motor vehicle crashes in the safe system
Campbell points out that by introducing social environment factors, safety professionals are asked to consider the implications of attitudes, biases and equity decision-making frameworks for humans operating in the roadway environment. Diagnostic assessments are expanded in the effort to incorporate this information. The assessment approach considers laws to reduce severity or frequency of crashes and the road user's willingness to accept those laws and how each of these can be used to address potential safety outcomes.
Equity is considered by assessing more than just vehicles, because one cannot always assume access to vehicles or personal protective equipment., especially within communities that might be lower income or overburdened, and where they cannot purchase a vehicle, bicycle or other protective devices. In many lower income and minority communities sidewalks and lighting may not exist, which leads to lower level of safety and security.
Road user mix is an important consideration as all road users must interact within the context and road environment. For instance, considering how a pedestrian ability to view closing distance and visibility on a rainy day may be negatively affected and lead to increased crash potential.
Although the focus of this manual is on infrastructure interventions, it is important to ensure that multi-sector approaches (e.g. those involving education and enforcement) are considered, as these will often have a greater impact on safety than infrastructure measures alone. This is especially the case in LMICs where there may be lower levels of compliance, or less understanding by the general public regarding the intent of safety interventions. Issues specific to LMICs and intervention effectiveness are discussed in Intervention Effectiveness in LMICs in Intervention Option and Selection while the following case study provides an example of a combined infrastructure and education programme to address pedestrian safety in South Africa.
As another example, the SURE handbooks (particularly the handbook ‘Plan d’actions et realisation des actions’) provide guidance on the French methods for selecting safety interventions on the network (see Box 9.8).
Most of the information on intervention effectiveness is based on research conducted in HICs. Aside from research on behavioural interventions in LMICs, there are very few studies on the effectiveness in these countries, especially the effectiveness of road safety infrastructure treatments. This issue is significant, as it cannot be expected that interventions used in HICs will have the same outcomes when used in LMICs.
This issue has been highlighted in several studies. OECD/ITF (2012) suggests that there are many context/environment-related elements that influence actual crash reduction, and that this is a more critical consideration in LMICs. For example, provision of a hard shoulder might improve safety in a HIC. However, in a lesser developed country it might encourage improper use, such as the installation of stalls for selling items to travellers, which could decrease the overall safety of the roadway. An understanding of these issues of context is obviously critical to the successful implementation of safety treatments.
There also appear to be several barriers to the successful implementation of road safety infrastructure treatments. Turner & Smith (2013) conducted a workshop to identify issues around the implementation of infrastructure treatments in LMICs. Several effective infrastructure treatments were discussed, and barriers for each explored. Although a number of issues were identified for each treatment type, many of these fell into similar categories. These included cost, issues with compliance, design and implementation issues, public acceptance and maintenance.
Cost was raised as an issue for many of the treatments, although interestingly not for all. For some of the highly effective treatments, cost does not appear to be a significant issue. Of greater interest is that issues relating to compliance and design/implementation were raised for more of the treatments than cost. Compliance of treatments by road users is a significant issue in LMICs, and it is very likely that the treatment effectiveness will be lower as a result. Issues that suffered from this compliance issue were:
This issue of compliance indicates the need for a multi-sector response to the road safety issue. The use of safer infrastructure needs to be supported by appropriate education and enforcement, as discussed earlier in this manual.
Design and implementation issues were also thought to have an impact on the effectiveness of treatments. If a treatment is not well-designed and the installation is not of a high standard, the crash reduction potential will not be met. This was considered an issue for all of the treatments discussed. This situation can only be improved through improving the skills and capacity of those working in LMICs, including the sharing of knowledge regarding good practice.
Lastly, maintenance is also an issue that will impact on the crash reduction effectiveness of treatments. It is common for treatments to deteriorate to levels where they become less safe (or possibly to a point where they are higher risk than if the treatment was not present). Appropriate funding is required to ensure that treatments are maintained. Training may also be required regarding the issue of maintenance.
Although all of these issues are likely to be concerns for HICs, they are possibly more pronounced in LMICs, and will certainly have an impact on treatment effectiveness. The extent of this effect is not known, but it can be expected that because of these issues, treatment effectiveness is likely to be different (typically less) than when the same treatments are used in HICs.
Given the absence of good information on treatment effectiveness in LMICs, it is recommended that crash reduction values from HICs be used as a starting point when selecting treatments. However, the issues discussed above need to be carefully considered, and appropriate revisions made to expected benefits. In the longer term it is hoped that the knowledge base regarding treatment effectiveness in LMICs will improve, but this will only occur if appropriate monitoring, analysis and evaluation occurs in these countries (see Monitoring, Analysis and Evaluation of Road Safety). The case study from Puerto Rico shows the effective use of rumble strips to lower roadway departure crashes.
They will be required in order to help eliminate death and serious injury. Many safety treatments currently result in some residual serious crash outcomes, and so improvements to current treatments will be required. As treatments are applied to new situations (including in LMICs) there will be a need to adapt them for better outcomes. There are also a number of highly effective interventions that exist and are used in some countries but not at all in others. There is a need for road agencies and supporting organisations to be innovative and adopt new approaches, provided these are implemented based on an evidence-led approach. It is recommended that road agencies investigate new interventions and learn from overseas experiences.
Reasons that some highly effective treatments are not used in some countries include:
Road agencies should be careful in their selection of new treatments, ensuring that they have been rigorously tested and have demonstrated safety benefits. Demonstration projects can be an effective way to assess promising treatments, and prepare for a wider roll-out (see Strengthening Capacity to Set and Deliver Targets.)
It is suggested that a methodological approach be taken towards innovation, outlined in the following steps:
A number of the reference documents highlighted earlier in this chapter provide innovative examples of road safety infrastructure treatments. Some agencies actively promote certain treatments (including innovative ones) that they would like to see used more often (e.g. FHWA, 2015, which documents and promotes proven safety countermeasures; while information on innovative intersection design including videos can be found here: http://www.fhwa.dot.gov/everydaycounts/edctwo/2012/geometrics.cfm). Many national and local studies have been undertaken to assess innovative treatments with promise. These studies are usually undertaken by universities and research institutes. Information on these trials can be found in international journals and at conferences, although care should be taken to ensure that such information is robust.
The case studies below provide an example of innovative use of intelligent transport systems (ITS) in Thailand and pedestrian and cyclist crossings at tram and transit lines in Germany.
The previous chapter discussed how to identify risk, while the earlier part of this chapter discussed the use of effective interventions to address the risks that have been identified. The next important step is to determine the priority of different treatments. In most situations, there are likely to be financial constraints, which means that not all worthy projects or programmes can be funded. Therefore, a method is needed to identify which projects/programmes should be undertaken as the highest priority. There are also likely to be several options for addressing a risk, and it is necessary to see which of these options will produce the best safety benefit for the cost. Economic appraisals or evaluations provide a comparison basis which can be used for prioritising, comparing and selecting road safety interventions. They help identify measures that yield the highest social return.
At the strategic level, it may also be necessary to establish the relative importance of proactive and reactive measures and decide on the budget proportion that will be allocated to each approach. The guidance provided in this chapter can be used at the strategic, programme or project level.
PIARC (2012) has produced the State of the practice for cost-effectiveness analysis, cost-benefit analysis and resource allocation document, which provides comprehensive advice on methods to appraise projects and allocate resources. This document defines project appraisal as an assessment of the value of a project in order to establish whether the project meets the country’s economic and social objectives. Evaluation approaches include cost-effectiveness analysis (CEA) and cost-benefit analysis (CBA) (also referred to as benefit-cost analysis (BCA)). The outcome indicators from this analysis (BCR, NPV, FYRR and IRR) are discussed in Assessment Criteria in Priority Ranking Methods and Economic Assessments. The following sections provide a summary of some of the key material on these issues.
Cost-effectiveness analysis involves comparing the cost of a proposed countermeasure with the outcome or effect it produces. Within cost-effectiveness, projects are ranked and screened according to their cost and effectiveness in improving road safety or achieving policy objectives. Effects are generally expressed in non-monetary units, e.g. the change in the number of crashes. Cost-effectiveness is mainly applied when comparing alternative projects, programmes and policies with a similar outcome. The cost-effectiveness is expressed as the cost-effectiveness ratio (CER), which is calculated by dividing the number of crashes prevented by the cost of the measure.
Cost-benefit analysis uses monetary values to compare total benefits with total costs of any given policy, programme or project. It is mainly used to determine the worth of an investment based on the total benefits and costs of the investment, and to compare a project with any alternative projects. Cost-benefit analysis is used in road safety economic appraisal to help build a business case and secure funding for different projects or programmes. It enables comparisons between alternative road safety measures, identifying both the cost and the benefits to society as a whole to determine if the project should be undertaken and to establish priorities for approved projects. This, in turn, encourages the efficient allocation of limited resources to competing policies.
Yannis et al. (2008) provide a useful summary of cost-effective infrastructure interventions in an analysis for the Conference of European Directors of Roads (CEDR). They examined 55 road infrastructure investments, including reviews of both the costs and benefits of each. Based on this analysis they identified several best practice examples that should be considered in the efficient planning of investments. The cost-effective intervention options were:
The key data requirements or parameters for estimating countermeasure benefits and costs are as follows:
Initial costs refer to implementation costs (e.g. installation, material and labour costs) for each countermeasure. The costs differ by road environment type, traffic volumes, local environment, local labour costs, and availability of materials. There is greater uncertainty surrounding implementation costs in most LMICs as the information is not readily available. The Road Safety Toolkit (http://toolkit.irap.org) outlines general cost levels for different countermeasures. These values can be used as indicative measures where the treatments have not been implemented before or in cases where the cost information is not readily available.
Annual maintenance and operating costs refer to routine and periodic maintenance costs and running costs. The level and regularity of maintenance and associated running costs depend on the countermeasure.
Some countermeasures may have a residual value if they are removed. For example, an intersection may be temporarily equipped with traffic signals for a number of years until a by-pass is completed, and after completion, lower subsequent traffic flows may warrant the removal of the traffic signals. If the countermeasure asset can be used elsewhere, the recovery of this cost should be taken into account. However, in most cases, any residual value is likely to be negligible.
A countermeasure’s service life refers to the time period over which a treatment will deliver safety benefits before major rehabilitation or replacement is required. It varies with:
For projects involving multiple treatments, e.g. network or national blackspot programmes, the service life applied is that of the longest-lived component. Table 11.4 gives example maximum treatment lives for different countermeasures. Given the issues listed above, this is likely to vary substantially for individual projects. As an example, in the US, the treatment life for line-marking is expected to be one year, especially in States that experience snow and ice conditions.
| Treatment type | Recommended maximum treatment life (years) |
|---|---|
Grade separation | 50 |
Realign curve | 35 |
Stagger or realign intersection | 35 |
Roundabout | 30 |
Median barrier | 30 |
Shoulder sealing or widening | 25 |
Add or widen lane (including overtaking lane) | 25 |
Provide acceptable superelevation | 25 |
Railway level crossing barriers | 20 |
Median island (or other island) | 20 |
Guardrail (roadside) | 20 |
Street lighting | 20 |
Remove roadside hazard (trees, pylons, etc.) | 20 |
New traffic signals (hardware and/or software) | 15 |
Improve sight distance by removing impediment on main road | 10 |
Edge marker posts (guideposts) | 10 |
Skid resistant surface | 10 |
Signs (advisory, warning, parking, speed limit, etc.) | 10 |
Raised reflectorized pavement markers | 5 |
Line-marking (thermoplastic) | 5 |
Line-marking (paint) |
Source: Adapted from Turner & Comport (2010).
The main benefits of road safety projects are expressed in terms of monetary savings from crash reductions or prevention of casualties (fatalities and injuries) over a given number of years.
Treatment effectiveness can be expressed as crash modification factors (CMFs). Several comprehensive resources that provide CMFs for different interventions are provided in Intervention Option and Selection, including the CMF Clearinghouse database (http://www.cmfclearinghouse.org/) and the Road Safety Toolkit (toolkit.irap.org). As also discussed previously, the effectiveness and magnitude of crash changes can vary according to their context/environment.
In cases where several treatments are applied at the same location (multiple countermeasures), estimates of overall benefits need to be made. Some approaches have only included the crash savings from the primary or main treatment, but it is preferable that total benefits be calculated. Care needs to be taken to ensure that benefits are not counted more than once for interventions that improve safety in similar ways. For example, to address crashes at a curve, interventions such as advanced warning signs, audio-tactile edgelines, and improved road surface friction may be applied. The total benefit of these treatments will not equal the sum of benefits for each treatment, as each is alike in terms of its effect on crashes. For situations where treatments are linked, an adjustment needs to be made. Although several complex approaches have been devised to calculate the total benefit from multiple treatments, the simple approach outlined by Shen et al. (2004) will usually suffice. They suggest a multiplicative formula similar in form to that shown below:
As an example, if three countermeasures are being considered in one location, with CMFs of 0.6, 0.75 and 0.8, the results would be as follows:
CMFt = 0.6 x 0.75 x 0.8
= 0.36, or 36% of crashes will remain (i.e. a 64% reduction in crashes).
A 64% reduction in casualties is obviously less than the 85% reduction that would be calculated if each reduction was added together.
Roberts and Turner (2007) were able to compare safety benefits at locations where packages of treatments were used, with locations where the same treatments were used but as single treatments. By applying the above formula, they identified that this approach tended to overestimate the true benefit of treatments. They suggested the results be multiplied by 0.66 to provide a more conservative approach (for the above example, this would produce a result of 42% reduction).
For a detailed discussion on the effectiveness of multiple treatment projects, see AASHTO (2010), iRAP (2013), and Elvik (2007).
The benefits resulting over time from safety countermeasures are estimated by placing an economic value on crashes and applying this to the expected reduction in crashes. Values should not be derived on a project-by-project basis but should be set at the national level by transport economists and updated annually.
This economic value, referred to as the social cost of crashes, is the value of property damage caused by vehicle crashes, medical and ambulance costs, insurance and administration costs, loss of output costs, police costs, and human costs associated with the pain and suffering caused by death and injury. The different cost components are outlined in Table 11.5.
| Costs per casualty |
|---|
Lost productivity (depending on the underlying hypothesis, gross loss of output or loss of output net of consumption) |
Human costs (loss of life expectancy, physical and mental suffering of the victim, mental suffering of the victim’s relatives and friends) |
Medical costs (medical rehabilitation) |
Non-medical rehabilitation |
Other economic costs. |
| Costs per crash |
Damage to property (including environmental damage) |
Administration costs |
Other costs (e.g. congestion costs, vehicle rental costs). |
Source: PIARC (2012).
There have been many projects and considerable debate about the best way to determine crash costs (Hills & Jones-Lee, 1983; Alfaro et al., 1994; Jacobs, 1995), but it is now generally accepted that only two methods should be considered – the willingness-to-pay (WTP) approach and the human capital (HC) approach. These approaches are summarised in Table 11.6.
| Approach | Description |
|---|---|
Human capital approach (HC) | Measures the impact of crash fatalities and injuries on present and future national output. The main attribute of HC is the present value of gross earnings (before tax). Direct costs such as vehicle costs, medical and emergency services costs are also added to the earnings estimate. In other cases, costs of human pain, suffering and grief are also included in the value of fatalities and injuries. |
The attributes can therefore be summarised as the value of future output loss due to casualties sustained in road crashes and the cost of resources spent to attend to the effects of the crashes. | |
Willingness-to-pay approach (WTP) | The estimates under the HC approach are average values rather than individual ones. |
Measures the amount individuals are willing to pay in order to reduce the risk of death and/or injury. Estimates are obtained from either revealed preferences (observing situations where individuals trade-off wealth or income for risk of death or injury) and stated preferences (individuals indicate how much they are willing to pay in order to reduce risk of death or injury based on hypothetical situations or questions). |
Source: Based on Hills and Jones-Lee (1983).
For a detailed description and discussion of the HC and WTP approaches, see PIARC (2013), HEATCO (2006), Transport Research Laboratory (1995), and Asian Development Bank (2005). Although both approaches are widely used, the willingness-to-pay (WTP) assessment method is generally recommended (DaCoTA, 2012; FHWA 2018; McMahon & Dahdah, 2008).
Costs must be determined for crashes of varying levels of severity, usually fatal, serious, slight or minor, and property damage only. These severity levels have been defined in Effective Management And Use Of Safety Data where it was indicated that a fatal crash involved a situation where at least one person died within 30 days of a crash; while a serious injury crash involved at least one person admitted to hospital, but there were no deaths. A minor crash indicates that at one person received some form of injury, but no one was killed or seriously injured.
For the purpose of prioritising actions aimed at reducing crash frequency, a single average cost for all injury crashes is generally considered sufficient, particularly since it is difficult to predict the specific severities of accidents that might be prevented.
Costs are always based on average values, and in some countries, are also determined for broad road categories (e.g. urban, rural, freeway). The social cost of crashes provides an estimate of the economic burden that different crash and injury types place on the economy. For illustrative purposes, an example of costs by road category and accident severity for the UK in 2012 is shown in Table 11.7.
Costs increase from built-up roads to non-built-up roads to freeways, indicating the effect of greater speeds on crash severity levels. It can also be seen that there are approximately ten-fold increases in costs between severity levels. That is, the cost of a slight crash is about ten times that of a damage only crash, a serious crash is about ten times that of a slight crash, and a fatal crash is about ten times that of a serious crash.
| Cost per casualty UK £ (US$) | Cost per crash UK £ (US$) | ||||
|---|---|---|---|---|---|
| Crash/casualty type | All roads | Urban roads | Rural roads | Motorways | All roads |
Fatal | 1,703,822 ($2,650,064) | 1,914,229 ($2,977,322) | 1,920,372 ($2,986,877) | 1,924,341 ($2,993,051) | 1,917,766 ($2,982,825) |
Serious | 191,462 ($297,793) | 218,109 ($339,238) | 220,524 ($342,998) | 229,358 ($356,735) | 219,043 ($340,697) |
Slight/ minor | 14,760 ($22,957) | 22,773 ($35,421) | 24,559 ($38,199) | 27,857 ($43,328) | 23,336 ($36,296) |
All injury crashes | 50,698 ($78,853) | 62,250 ($96,821) | 109,415 ($170,180) | 74,471 ($115,830) | 72,739 ($113,136) |
Damage only | 1,935 ($3,010) | 2,830 ($4,402) | 2,720 ($4,230) | 2,048 ($3,185) | |
Source: Adapted from Department for Transport (2013).
Calculation of crash costs is generally undertaken at the country level, and development of an accurate figure can be a complex process regardless of which method is used. If no figure is available at the country level, a simple method for obtaining the value of crashes, especially in the absence of the data required for the HC and WTP approaches, is the iRAP ‘rule of thumb’ (McMahon & Dahdah, 2008). This method uses the information from countries that have already carried out WTP calculations, and analyses the relationship between the value of statistical life (VSL) and gross domestic product (GDP) per capita.
The assumptions are (McMahon & Dahdah, 2008 Table 10):
The approach was originally developed using WTP values from a limited number of LMICs. These values were recently updated using a larger dataset (Milligan et al., 2014). The update showed that the rule of thumb tends to underestimate VSL for countries with GDP per capita above $7000 (Milligan et al., 2014).
Generation of crash costs can be a significant issue in LMICs, even with the availability of crash cost estimates, or when using the ‘rule of thumb’. Due to low GDP per capita in many countries, the crash costs can be low, while the cost for installing engineering treatments can remain high. The example (Box 11.5) below illustrates this issue using an example from Papua New Guinea.
When compared with a ‘base option’ that involved minimum surface repairs only and had an almost six-month delay in response between the emergence of serious pavement defects and their repair; the combined NRRSP/KRGMP inputs, if continued over a twenty-year period, could deliver economic benefits of approximately K1.15 billion (approximately US$0.5 billion) with a marginal BCR of approximately 5, excluding crash cost savings. This resulted from prompt pavement repairs, with a monthly cycle of reactive surface maintenance, drainage and shoulder maintenance, and periodic resurfacing, and localised pavement repairs. Where the base option was changed to incorporate pavement strengthening or reconstruction when conditions were seriously deteriorated, the net benefits declined to between approximately K87 million and K629 million, with a maximum marginal BCR of 4.6.
Crash rates were also investigated and revealed a potential for reduction in crash risk by up to 30% from the current figures of approximately 4,000 casualties per year. This reduction was based on an assumed 15% reduction due to improved road surface condition, and a combination of factors such as improved visibility and shoulder conditions.
The total cost of crashes is given by the number of crashes of each type, multiplied by their unit cost of crashes. On this basis, the total cost of crashes is K24.4 million annually. To place this in proportion, it is equivalent to approaching a 2% reduction in all other costs; i.e. crash reductions will boost the cost saving due to improved maintenance by up to 2%.
The above figures are clearly impacted by the value of statistical life applied, noting that the value used is considerably less (by a factor of 42) than that applied in Australia. Furthermore, the relative crash rate for the Highlands Highway is approximately four times the base crash rate of typical Australian roads with similar operating conditions (McLean, 2001; Turner et al., 2009), which is not unexpected.
Consequently, the estimated gross crash costs are approximately 10% of those calculated for similar conditions in Australia. This is likely to have significant consequences for the economic justification of crash mitigation measures, and warrants closer study.
Aspects that require consideration include: a) the value of statistical life, with the possibility that current ‘lost output’ methods take insufficient account of the extended family who are often supported by a ‘bread-winner’ in traditional societies in PNG and elsewhere. The loss of income has potential to affect the education and income-earning opportunities of a generation ; b) the need to account for real increases in income growth in LMICs, and the consequent increase in ‘real’ crash costs; c) the challenge of identifying affordable engineering treatments to mitigate crash risks, noting that the actual cost of road treatments delivered in LMICs and HICs are almost comparable (probably a maximum of 2 to 3 times different), whereas the value placed on the social cost of crashes is some 40 times less.
Alternatively, the value of different injury severities can be derived using quality adjusted life years (QALYs) and disability adjusted life years (DALYs). QALYs measure the value of a fatality prevented, taking into account the quantity and quality of life. They place a weight of one for a year of perfect health and zero for death. DALYs on the other hand, measure the quality of life lost or loss of life years due to illness or injury. They account for the burden of injury or illness and can also be used to measure property damage. DALYs and QALYs are widely used in health economics and very rarely in road safety. An example application of DALYs and QALYs in Colombia road safety is outlined in Box 11.6.
Using the well-established relationship between the value of statistical life and GDP per capita, they used different rules of thumb to estimate the cost of crashes using DALY estimates. These rules are outlined below.
.")
Figure 11.4.Box6 Relationship between VSL and GDP capital - Source: Bhalla et al., (2013).
The unit costs used in the estimation are outlined below.
.")
Figure 11.4.Box6 Relationship between VSL and GDP capital losses - Source: Bhalla et al., (2013).
In any economic road project assessment, it is important to identify a base year from which all future costs and benefits can be assessed. This is because the value of a dollar received in the future is less than the value of a dollar now (also referred to as the ‘time value of money’). The discount rate is used to compare benefits and costs received at different points in time over a project’s treatment life, converting future benefits and costs to present values.
The choice of discount rate can have significant effects on the desirability and selection of projects, especially where benefits and costs accrue later in the treatment’s life. A higher discount rate reduces the value of benefits and costs occurring later in the treatment’s life, favouring projects where benefits occur early in the project. The World Bank recommends present value calculations at 12% discount rates (2014 values) be included in road project business case submissions (see PIARC, 2012; AASHTO, 2010). It is important to note, however, that this value is not necessarily relevant for every country, and the discount rate actually used can be significantly different. For instance, the discount rate is close to 5% in several western European countries.

© ARRB Group
As indicated above, the standard approach for the ranking of treatments is to carry out a cost-benefit analysis, i.e. to compare the estimated benefits of each scheme (in terms of the value of crashes that will be prevented) in relation to its costs (implementation, maintenance, etc.). The treatments are then prioritised in accordance with the best economic returns.
As previously mentioned, estimating likely crash reductions resulting from remedial work is often difficult, because it can only be based on previous experience with similar schemes (Turner & Hall, 1994; Kulmala, 1994; Mackie, 1997).
The selection of countermeasure options is based on the first year rate of return (FYRR), the internal rate of return (IRR), the benefit-cost ratio (BCR), and the incremental benefit-cost ratio (IBCR), as well as net present value (NPV). However, the two main indicators in assessing a project or treatment are the BCR and the NPV. These measures indicate whether the benefits of the proposed treatment outweigh the costs, and if the preferred treatment has the greatest net social benefit.
This is simply the net monetary value of savings and drawbacks anticipated in the first year of the scheme, expressed as a percentage of the total capital cost.

Note that the last two elements might be considered to be small, particularly for low-cost schemes, and are often ignored.
This is not a rigorous evaluation criterion for prioritisation since it ignores any benefits or changes in maintenance costs after the first year. However, it is very simple to calculate, and given that road safety engineering schemes often produce first year rates of return in excess of 100%, more sophisticated decision criteria may not be necessary. This method usually yields high values with low-cost schemes but with relatively small crash savings, and for this reason it is less consistent with the Safe System approach.
The FYRR can also be used to assess the timing of a particular project by comparing it with the discount rate. If the FYRR is greater than the discount rate, the project can, in theory, proceed. This says nothing, however, of how it compares with other projects. If the FYRR is less than the discount rate, the project should, at the very least, be postponed.
More detailed assessments will be needed for schemes where crashes and traffic levels are expected to change substantially from year to year. For example, a scheme with an 80% FYRR may not be worthwhile if subsequent road closures due to the construction of a new road limit the benefit to just one year.
Another important criteria used for assessing costs and benefits of highway schemes is the internal rate of return (IRR). This is the discount rate that makes the NPV equal to zero or makes the BCR equal to one. A theoretical example of how the discount rate affects the NPV of a project is shown in Figure 11.6
.

Figure 11.7 An example of the influence of discount rate on NPV
At discount rates of 8% or 10%, the project has a positive NPV, while it is negative at 12% or 14%. The NPV is zero at 11% discount rate, which is known as the internal rate of return (IRR). The IRR is preferred by multilateral aid agencies, such as the World Bank, because it avoids the use of local discount rates which, depending on their value, can significantly affect the NPV or NPV/PVC ratio. The IRR is not particularly useful for ranking projects, but is included for comprehensiveness.
Benefit cost ratio (BCR) is defined as the present value of benefits (PVB) divided by the present value of costs (PVC):
")
When the NPV of any given project is positive, the BCR is greater than one. The greater the BCR, the higher the benefits are. The BCR is used to rank projects where there is a budget constraint, and it serves as an indicator of a project’s economic efficiency.
The IBCR involves ranking a pairwise comparison of all alternatives with a BCR greater than one in order to determine the marginal benefit obtained for a marginal increment in cost. Then, after eliminating all schemes with a BCR of less than one, the schemes are listed in order of ascending cost and the marginal BCR is determined by a pairwise comparison of alternatives, starting with the lowest and second-lowest cost alternatives. That is:

If the IBCR is greater than one, the alternative x+1 is preferred, since the marginal benefit is greater than the marginal cost. Conversely, if the IBCR is less than one, alternative x is preferred. The preferred option is then taken and the pairwise comparison is continued until only a single alternative remains, which should then be the most economically desirable of all the options considered.
However, Ogden (1996) concludes that the BCR approach is more cumbersome to use than the NPV approach and may produce more ambiguous and misleading results depending on how benefits and costs are defined. It is of particular note that low-cost measures are typically favoured when using BCR as the basis for selection. For example, installing advanced warning signs are likely to have a limited (but beneficial) effect on severe crash outcomes, but due to the low cost of installation, they are likely to produce a high BCR. In contrast, roadside barriers are likely (in the situation) to have a significant effect on reducing fatal and serious crash outcomes. However, given the greater cost for installation and maintenance, the BCR is likely to be lower. The aim of road safety is to produce a net reduction in fatal and serious injury. Using solely the BCR approach may produce outcomes that are inconsistent with this objective. Therefore the NPV/PVC approach in association with BCR is much preferred.
This type of evaluation expresses the difference between discounted costs and benefits of a scheme, which may extend over a number of years. As stated earlier, future benefits must be adjusted or discounted before being summed to obtain a present value. Changes may also take place over the life of the scheme which will affect benefits in future years.
Let us assume (for ease of calculation) that the current rate used by the government for highway schemes is 10%, which in the prevailing economic climate might be considered as somewhat high in most countries. This means that $100 in benefits accruing this year will be worth 10% less if it accrues next year. A further year's delay will reduce the benefit again, and so on. These figures can be summed over the life of the scheme to obtain the present value of benefits (PVB).

Net present value is defined as the difference between the discounted monetary value of all the benefits and costs of a particular project or measure. The NPV is expressed as the PVB minus the PVC. A positive NPV indicates an improvement in economic efficiency compared with the base case.
With respect to implementation priorities, the economic criteria for scheme assessment using the NPV approach are:
Care needs to be taken in using NPV as the only investment criterion, since it tends to indicate projects with higher costs.
The choice of assessment criteria depends primarily on available data, as well as the scope of the treatment. The different assessment criteria provide information on the project. The NPV provides information on the total welfare gain over a project’s treatment life; the BCR highlights the relationship between the present value benefits and implementation costs of a project; while the IRR shows the rates at which benefits are realised after investing in a countermeasure (PIARC, 2012).
The NPV is the preferred criterion as it provides an estimate of the absolute size of the treatment’s net social benefit. The BCR on the other hand provides the relative size of the costs and benefits of a treatment and depends on the classification of the project’s impacts. Table 11.8 provides guidance on when to use the different criteria.
| Criterion | ||||
|---|---|---|---|---|
| Budget | Decision context | Net present value (NPV) | Benefit-cost ratio (BCR) | Internal rate of return (IRR) |
Unconstrained budget | Accept/Reject decision | Accept if NPV is non-negative ✓ | Accept if BCR exceeds/equals unity ✓ | Accept if IRR exceeds/equals the hurdle rate ✓ |
Option selection | Select project with highest non-negative NPV ✓ | No rule exists ✘ | No rule exists ✘ | |
Constrained budget | Accept/Reject decision | Select project such that NPV of project set is maximised subject to budget constraint ✓ | Rank by BCR until budget is exhausted or BCR cut-off reached ✓ | No rule exists ✘ |
Option selection | Highest NPV subject to budget constraint ✓ | No rule exists ✘ | No rule exists ✘ | |
Source: Austroads (2005).
For a comprehensive step-by-step approach on economic appraisals or evaluation, as well as a summarised discussion of the assessment criteria, see PIARC (2012), EU (2006), and HEATCO (2006). Box 11.9 provides an example economic evaluation from Belize.

Summary of the three investment options of a Road Assessment Programme
The development of several options as in this example is fairly typical for road safety projects. This will help determine which combination of treatments will deliver the greatest benefit for the available funding. In this case, and following discussions with the project stakeholders, the options were adjusted with a lower cost option selected, and the benefits and costs recalculated. The estimated NPV of the project, using very conservative crash cost values, is US$6.1 m and the economic rate of return (ERR) is 28.8%. The ERR is well-above the Caribbean Development Bank’s cut-off rate of 12.0%

© ARRB Group
A variety of tools assist with the economic appraisal process in road safety. Some examples are provided below.
SafetyAnalyst (also discussion in Management Tools) includes an economic appraisal tool developed by the American Association of State Highway and Transportation Officials (AASHTO; see Harwood et al., 2010). It assesses whether countermeasures for a specific highway site are economically efficient. The tool allows the user to specify the costs, traffic volumes, and all other data inputs. It also provides default values for the specified treatment, which can be used in the estimation. The user can specify the economic appraisal to be performed, with options for cost-effectiveness analysis, benefit-cost ratio or net present value. The effectiveness measures are obtained from observed, expected and predicted crash patterns at the specific site. The countermeasures and sites are ranked using the Priority Ranking Tool component of SafetyAnalyst, which uses the same measures obtained by the economic appraisal tool and also provides the optimal option given budget constraints. The choice of prioritisation criteria lies with the user.
COBALT is an economic appraisal tool developed in 2012 by the UK Department for Transport. It was derived from the broader transport appraisal tool, COBA (Cost Benefit Analysis tool). COBALT focuses solely on road safety appraisals using the same CBA approach as COBA as outlined in DfT (2011).
While New Zealand does not have a dedicated road safety economic appraisal tool, the Economic evaluation manual (EEM) (New Zealand Transport Agency 2013) provides clear guidance and templates that can be used in the evaluation process. The EEM is a guidance tool outlining procedures for economic evaluations of transport investment proposals. It provides descriptions of basic concepts in economic evaluations and simple and detailed procedures for evaluations. The simple procedures are aimed at low cost activities while the detailed procedures are for large scale evaluations. Step by step methodologies for evaluating benefits and costs are also provided through downloadable spreadsheets.
There are different spreadsheets for different evaluations. The road safety promotion spreadsheet contains six procedural worksheets and four other worksheets for working notes, cost estimates and sensitivity analysis. Worksheet 1 is a summary of general project information and data used for the evaluation. Worksheet 2 is used for calculating the present value of project costs, worksheet 3 is used for calculating the social cost of crashes per person and worksheet 4 is used for calculating the present value of project benefits. Worksheet 5 is used to calculate the BCR per head. The cover worksheet is a summary of all the information and calculations in the spreadsheet. For each of the steps, there is guidance offered on the necessary information and input data.
European guidance on economic appraisals and prioritisation of road safety countermeasures is also available to practitioners. Examples of this include European Road Safety Observatory (ERSO- http://www.erso.eu/), Developing Harmonised European Approaches for Transport Costing and Project Assessment (HEATCO- http://heatco.ier.uni-stuttgart.de/), and Road Safety and Environmental Benefit-Cost and Cost-Effectiveness Analysis for Use in Decision-Making (ROSEBUD, http://partnet.vtt.fi/rosebud/).
The process applied by iRAP (Section 10.4.4) not only identifies problems and effective interventions, it also produces detailed business plans, including the cost-effectiveness of the interventions identified. An example from the Ukraine of one such investment plan is provided in Figure 11.7
.")
Figure 11.7 A road assessment programme investment plan - Source: EuroRAP (2013).
AASHTO, (2010), Highway Safety Manual, American Association of State Highway and Transportation Officials, Washington, USA.
Asian Development Bank, (2005), Costing of Accidents (10 reports on crash costing from the Asia region). Comprehensive guidance on crash costs.
Austroads (2005), Guide to project evaluation: part 2: project evaluation methodology, by N Rockliffe, S Patrick & D Tsolakis. AGPE02/05, Austroads, Sydney, New South Wales.
Bahar, G, (2011), Estimating the Costs to State Governments Due to Highway-Related Injury and Fatal Crashes, Transportation Research Board, NCHRP, Project 20-24 (068) Final Report
Bergh, T & Petersson, M (2010), ‘Roadside area design: Swedish and Scandinavian experience’, International symposium on highway geometric design, 4th, 2010, Valencia, Spain, Polytechnic University of Valencia, Valencia, Spain, paper 14.
Bhalla, K, Diez-Roux, E, Taddia, A, Mendoza, S, & Pereyra, A (2013), The Costs of Road Injuries in Latin America, Inter-American Development Bank, Washington D.C.
Bureau of Infrastructure, Transport and Regional Economics (BITRE), (2012), Evaluation of the national black spot program. Volume 1, BITRE Report 126, Canberra, Australian Capital Territory.
DaCoTA (2012), Cost-benefit analysis, Deliverable 4.8d of the EC FP7 project DaCoTA, Brussels
Department for Transport, (2011), Transport Analysis Guide (TAG): Cost benefit analysis, TAG unit 3.5.4 viewed 23 April 2014 www.dft.gov.uk/webtag
Department for Transport, (2013) UK, Road accidents and safety statistics, Accident and casualty costs (RAS60), September 2013 https://www.gov.uk/government/publications/reported-road-casualties-great-britain-annual-report-2012
Durdin, P & Janssen, K (2012), SafetyNET: breathing life into road safety analysis, Australasian Road Safety Research Policing Education Conference, Wellington, New Zealand.
Elvik, R, (2007), State-of-the-art approaches to accident blackspot management and safety analysis of road networks. TØI Report 883/2007. Institute of Transport Economics, Norwegian Centre for Transport Research.
Elvik, R, Hoye, A, Vaa, T & Sorensen, M, (2009), The handbook of road safety measures (2nd ed.). Emerald, Bingley, United Kingdom.
EU, (2006), Examples of assessed road safety measures - a short handbook. Output from European Union Rosebud project. Available from http://ec.europa.eu/transport/road_safety/projects/doc/rosebud_examples.pdf.
EuroRAP (2013), Development of a Safer Road Corridors Investment Plan World Bank project 1080490: Safer Roads Investment Plan, European Road Assessment Programme, Basingstoke, United Kingdom.
Harwood, D Torbic, D. Richard, K. & Meyer, M, (2010), SafetyAnalyst: Software Tools for Safety Management of Specific Highway Sites. Federal Highway Administration, McLean, Virginia.
HEATCO, (2006), Developing Harmonised European Approaches for Transport Costing and Project Assessment, viewed 24 April 2014 http://heatco.ier.uni-stuttgart.de
Hills, P. J., and Jones-Lee, M. W. (1983) The role of safety and highway investment appraisal for developing countries, Accident Analysis and Prevention, 15, pp. 355-369.
International Road Assessment Programme (iRAP) (2013), Multiple countermeasures, iRAP Methodology Fact Sheet #12.
Jensen, S (2013), Safety effects of converting intersections to roundabouts. Transportation Research Record 2389, 22-29.
Larsson, M, Candappa, N, & Corben, B (2003), Flexible barrier systems along high-speed roads: a lifesaving opportunity, Report 210, Monash University. Accident Research Centre (MUARC), Clayton, Australia.
Mackie, A. (1997) Molasses: Monitoring of local authority safety schemes, County Surveyor's Society/Transport Research Laboratory, United Kingdom.
McLean, J (2001), Economic evaluation of road investment proposals: improved prediction models for road crash savings, AP-R184/01, Austroads, Sydney, Australia.
McMahon K and Dahdah M, (2008), The true cost of road crashes: valuing life and the cost of a serious injury, International Road Assessment Programme (iRAP), Basingstoke, United Kingdom.
Milligan, C, Kopp, A, Dahdah, S & Montufar, J, (2014), Value of a statistical life in road safety: A benefit-transfer function with risk-analysis guidance based on developing country data, Accident Analysis and Prevention, 71, 236-247.
New Zealand Transport Agency (NZTA), (2011), High Risk Rural Roads Guide. New Zealand Transport Agency, Wellington, New Zealand.
New Zealand Transport Agency (NZTA), (2013), Economic evaluation manual (volume 2). Wellington, July 2013.
OECD/ITF (2012) Sharing Road Safety, Organisation for Economic Co-operation and Development (OECD), Paris, France.
Ogden, K. W. (1996) Safer Roads: a Guide to road safety engineering, Avebury Technical, 516 p.
PIARC (2009) Catalogue of design safety problems and potential countermeasures, Report 2009R07EN, World Road Association, Paris, France.
PIARC, (2012), State of the practice for cost-effectiveness analysis (CEA), cost-benefit analysis (CBA) and resource allocation. Report 2012R24EN, World Road Association (PIARC), Paris, France.
PIARC, (2016), The Role of Road Engineering in Combatting Driver Distraction and Fatigue Road Safety Risks. Report 2016R24EN, World Road Association (PIARC), Paris, France.
PIARC, (2017), Vulnerable road users: Diagnosis of design and operational safety problems and potential countermeasures. Report 2016R34EN, World Road Association (PIARC), Paris, France.
PIARC), (2023, Saving lives around the world with proven countermeasures. Report 2023R32EN, World Road Association (PIARC), Paris, France.
Roberts, P & Turner, B, (2007), Estimating the crash reduction factor from multiple road engineering countermeasures, International road safety conference, Perth, Australia.
SafetyAnalyst Economic appraisal tool (http://www.safetyanalyst.org/eatool.htm) and Priority ranking tool (http://www.safetyanalyst.org/prtool.htm)
Shen, J, Rodriguez, A, Gan, A, & Brady, P (2004), ‘Development and application of crash reduction factors: a state-of-the-practice survey of State Departments of Transportation’, Transportation Research Board Annual Meeting, 83rd, 2004, Washington, DC, USA, Transportation Research Board (TRB), Washington, DC.
Transport and Road Research Laboratory (1991) Towards safer roads in developing countries: A guide for planners and engineers, TRRL & Overseas Development Administration, Crowthorne.
Transport Research Laboratory (TRL), (1995), Costing road accidents in developing countries. Overseas Road Note 10. Crowthorne, UK.
Turner B and Comport L, (2010), Road safety engineering risk assessment part 4: treatment life for road safety measures. Austroads, Sydney, Australia.
Turner B & Smith G, (2013), Safe System Infrastructure: Implementation Issues in Low and Middle Income Countries. Research Report ARR 383, ARRB Group Ltd, Vermont South, Australia.
Turner, B, Tziotis, M, Cairney, P & Jurewicz, C (2009), Safe System Infrastructure – National Roundtable Report, Research Report ARR 370, ARRB Group Ltd, Vermont South, Australia.
Turner, D. S. and Hall, J.W. (1994) Severity indices for roadside features, NCHRP Synthesis of highway practice 202, Transportation Research Board, Washington, DC.
Yannis, G, Evgenikos, P & Papadimitriou, E (2008), Best Practice for Cost Effective Road Safety Infrastructure Investments, Conference of European Directors of Roads, Paris, France.
The final step of the risk assessment process is the monitoring, analysis and evaluation of interventions (Figure 12.1)

Figure 12.1 Monitoring and evaluation within the risk assessment process
As described in The Road Safety Management System, monitoring, analysis and evaluation is the ‘systematic and ongoing measurement of road safety outputs and outcomes (intermediate and final), and the evaluation of interventions to achieve the desired focus on results’ (GRSF, 2009). These tasks are often overlooked, but are essential for the effective management of road safety.
Earlier chapters have provided information on the role of monitoring, analysis and evaluation in road safety management, including its importance as part of road safety targets and programmes (The Road Safety Management System, and to a lesser extent, Road Safety Targets, Investment Strategies Plans and Projects and Design for Road User Characteristics and Compliance); and the role it plays in data requirements (Identifying Data Requirements). This chapter concentrates on the evaluation process at the network and project level, and includes information on the importance of this process as well as how to undertake monitoring and evaluation.
Monitoring refers to the systematic collection of data regarding the performance of a road safety programme or intervention during or after its implementation. Analysis involves the study of data in order to interpret it and its parts, such as determining the contributing factors to crashes. Evaluation involves the analysis of this data to determine the effect of the treatment or programme.
The purpose of the monitoring and evaluation process is to:
A successful evaluation process requires careful planning, which includes collecting baseline data, identifying the aims before implementation, and considering the different methods of analysis that could be used for the evaluation. It is also essential that the results and feedback of the evaluation study are properly circulated amongst stakeholders and other interested agencies.
There are three main types of evaluation. One or more may be appropriate for a study, and this is dependent on the aims of what needs to be evaluated. The three main types of evaluation are:
Both qualitative and quantitative methods can be used for an evaluation study. Qualitative questions are more useful in process and outcome evaluations in the form of focus groups, or open-answer questionnaires, and can be insightful as to why an intervention may not have been successful. Quantitative studies produce more rigorous outputs through the use of controlled trials or before-and-after studies.
As identified in Priority Ranking Methods and Economic Assessment, information on intervention effectiveness is also important in assessing the likely benefits of safety improvements. The evaluation process is important for improving knowledge regarding the effectiveness of different road safety interventions in different types of environments. The use of such information in the selection and prioritisation of interventions is discussed in Intervention Selection And Prioritisation, while this chapter concentrates on methods for monitoring and evaluation. However, agencies must be cautious about generalising the results of an evaluation.
Processes should be established for the collection of relevant data. For those just getting started, this collection could be undertaken as part of a corridor or area demonstration project.
Staff and financial resources need to be provided for monitoring, analysis and evaluation, and key road agency staff and stakeholders should be trained in basic analysis and evaluation methods. Consideration should be given to the storage and maintenance of the data over time.
With limited budgets, it is very important to demonstrate that road safety interventions are effective, and of value. This is particularly important in LMICs where comprehensive action plans have been developed fairly recently with limited funds from central governments and aid agencies. Good information is required on the effectiveness of interventions to ensure that limited available funding is spent in the most effective way. There is currently a large gap in our understanding of how different interventions improve safety in LMICs. Intervention Effectiveness in LMICs in Intervention Options and Selection highlights some of the difficulties in using information from HICs on treatment effectiveness in LMICs. An evidence-based approach is required to improve knowledge on effectiveness of interventions in LMICs, and this can only occur through monitoring and evaluation of interventions in these countries.
Even worse than the inefficient use of limited funding is the possible use of interventions that lead to an increase in crash risk. Unfortunately, this situation does occur in public policy decision making, including those regarding road safety, often as the result of poor information, as a result of behavioural adaptation from road users, or from a poor implementation process. It may also occur due to trade-offs in decision making, whereby safety considerations are not given as high a priority as other issues (such as mobility).
One example that illustrates how a ‘safety’ intervention can produce an increase in risk comes from driver education programmes. Although it may seem unlikely that increased driver training and education would have either no effect or even moderately increase crash risk, this is exactly what has been found. Various studies exist on driver education program. From these studies driver education program may not always have a clear positive effect. These examples indicate the importance of having information on effectiveness before spending limited resources. (Helman et al., 2010, cited in McKenna, 2010; and Williams, 2006, cited in McKenna, 2010).
Monitoring, analysis and evaluation is an important component of infrastructure safety management, it need not be undertaken to the same extent for each project. For example, if a safety intervention is implemented in a particular locality that has already been thoroughly evaluated and deemed beneficial then the requirement for further evaluation may be more limited. Safety treatments that have had little or no use in the locality will need to follow a more thorough evaluation process.
Road Safety Targets, Investment Strategies Plans and Projects described the process required to set quantifiable road safety targets as part of policy development and plans. As discussed in that chapter, there is a requirement to constantly monitor and analyse progress against these targets. As well as monitoring long- term targets, there is also a need to ensure that relevant agencies and government departments are implementing the improvements outlined in the plan through monitoring of intermediate targets. As an example, the State of Washington in the United States, previously used the Holt Method to forecast data trends to set near term targets and to set intermediate targets for the strategic highway safety plan.. The figure below shows a visual representation. The standard deviation is shown to report a range of what can be expected in the near-term. Also see: Effective Management And Use Of Safety Data.
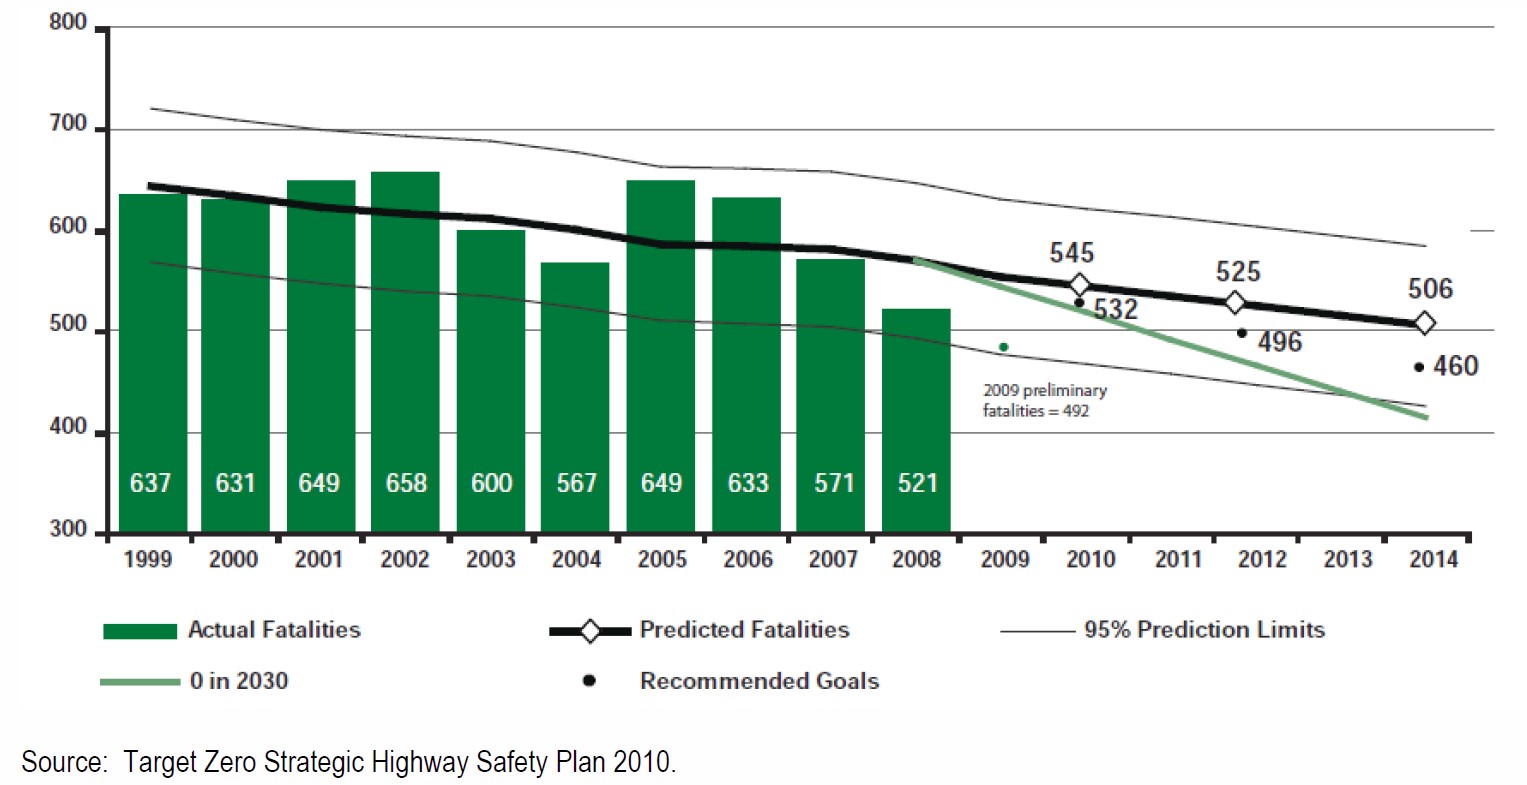
Figure 1: Setting Intermediate Targets in Washington State, USA
Such monitoring can also help establish whether these activities are having the desired effect on safety outcomes. In many cases, this monitoring will identify adjustments that can be made to help improve safety outcomes. Data requirements for these activities have been outlined in Effective Management And Use Of Safety Data.
The following section provides guidance on how to analyse and evaluate road safety infrastructure interventions. Some of these approaches can be used to help evaluate performance against targets. However, evaluating the success of interventions in meeting targets can be a more complex task because there are often many changes taking place simultaneously. Solutions to this issue include the evaluation of ‘packages’ of treatments (i.e. determine the effect of the combined activities that are related), or the application of statistical modelling to try to determine the impact of individual measures. Whichever approach is taken, the creation of a strong data collection and analysis process is required to ensure that adequate data is collected. This will include the need for data on final outcomes (crash data) and intermediate measures (safety performance indicators, e.g. various behavioural measures, attitude survey information, and infrastructure measures). For further information on data requirements see Chapter 5. For information on evaluation of non infrastructure interventions, there are a number of important reference documents. These include the UK website and toolkit on evaluation of education, training and publicity programmes (http://www.roadsafetyevaluation.com), as well as global good practice documents on helmets (GRSP, 2006) and drink driving (GRSP, 2007), speed (2008), seatbelts and child restraints (GRSP, 2009), two and three-wheeler safety (WHO 2017), road safety legislation (2017 WHO). The Czech Republic case study shows an example of setting and monitoring targets for the countries efforts to reduce number of people killed and injured on its roadways.
Effective decisions regarding the use of road safety infrastructure interventions can only be made with adequate knowledge regarding its effectiveness. The key measure that is used for this assessment is the expected reduction in crashes, expressed as a crash modification factor (CMF) for the intervention. This indicates the degree to which the intervention is expected to reduce crashes. CMFs are also described in detail in Effective Safe System Interventions in Intervention Options And Selection. CMFs help policy-makers in the decision-making process, and the results from previous studies are typically used to provide a realistic estimate of the expected effect (SafetyCube, CMF Clearinghouse). However, there are many gaps in knowledge regarding the effectiveness of interventions.
An international collaboration on effective evaluation for road safety infrastructure interventions has recently been completed. The OECD/ITF (2012) document Sharing Road Safety provided the following key messages:
Some of the key recommendations from this work were that:
The ultimate measure of the success of a road safety policy or intervention is the effect that it has had on crash reduction, particularly the reduction in fatal and serious injuries. Unfortunately, difficulty arises in considering crashes on their own, as it may be necessary to wait several years after the countermeasure or package of measures has been introduced to be able to validate the changes in crash statistics. Given an indication of effectiveness is often required in a shorter timeframe, particularly to determine that nothing has gone wrong, more immediate feedback may be required. Proxy measures for safety might be useful to monitor the effectiveness of schemes (see also Identifying Data Requirements) for the link between intermediate and final outcome measures). These proxy measures are usually observational-type measurements. It is often recommended to conduct an evaluation in two stages: a short-term phase (e.g. 6 months) and a longer-term phase (e.g. 3 to 5 years).
Where practical, the treated site, route or area should be observed immediately after completion of the construction work; with regular visits made in the following days, weeks or months after completion until the team is satisfied that the scheme is operating as expected.
It is recommended that any earlier behavioural measurements made at the investigation stage be repeated later (e.g. traffic conflict counts, speed measurements), as this will help determine/support the need for any further changes, or may in fact prove the success of the intervention. This behavioural study is also required because some features of an intervention may, for instance, produce an unforeseen reaction in road users and subsequently create a potentially hazardous situation. Monitoring and analysis should highlight this problem at an early stage so that appropriate action can be taken quickly to remove this hazard.
At best, it may be possible to alleviate this hazard easily, e.g. by realigning the kerb lines to prevent a hazardous manoeuvre. At worst, it could lead to the complete withdrawal of a scheme and the need to reassess alternative schemes.
Some of the issues that may be relevant to assess include:
It would be impractical to carry out detailed behavioural studies for all minor alterations, but such studies may be particularly important for expensive schemes such as area-wide or mass action treatments.
It may be preferable to allow the scheme to operate for about two months before conducting a behavioural ‘after’ study. This should serve as a ‘settling-in’ period, during which regular users get used to a new road feature and any learning effects have largely disappeared. The evaluation should verify the impacts in terms of safety for all users. The overall effects of a project should be understood as a whole. For example, the implementation of a bike lane can be dangerous if used by motorcyclists.
The following six case study from Malaysia, Puerto Rico, Portugal, Slovakia and Italy provides a number of excellent evaluations on the safety effects of various treatment.
The case study describes a set of safety countermeasures in via Pistoiese (Firenze – Italy), that is an urban collector road classified as a high accident concentration section. A detailed safety study has been undertaken to identify the possible applicable safety countermeasures. Accident analysis, road safety inspections and driving simulation studies were performed. The intervention to be implemented combines physical and perceptual treatments. Read more (PDF, 869 kb).

© ARRB Group
The most important form of evaluation of any safety measure is determining its effect on crashes, and whether the intervention has reduced the number of crashes (particularly fatal and serious injury ones) by the expected amount. Evaluation involves the analysis of crash data by comparing the safety performance before a change was made to the safety performance afterwards. This often involves statistical analysis. To be reasonably sure that the random nature of crashes has been taken into account, it will normally be necessary to wait for several years for a valid result to be available. As mentioned earlier, more immediate feedback is often necessary and sometimes a shorter-term monitoring method may be applied.
Apart from the time-scale issue, there are other factors that complicate the (apparently straightforward) process of assessing the effectiveness of crash changes at treated sites, routes or areas. The main ones to consider are:
Each of these is discussed below.
This effect complicates evaluations at high-crash locations. Crash locations for treatment are typically chosen because they were the scene of numerous crashes. In some cases, the high crash numbers may be the result of just one particularly bad year, and this may have happened purely by chance. Crash numbers at such sites will tend to fall in the next year even if no intervention is applied. Even if a three-year period is used, crash occurrence may be due to random fluctuations, and in subsequent years these sites will experience lower numbers. This is known as regression to the mean. It is believed that the regression to the mean effect can overstate the effectiveness of a treatment by 5% to 30%. Figure 1 shows a graphical representation of regression to the mean.
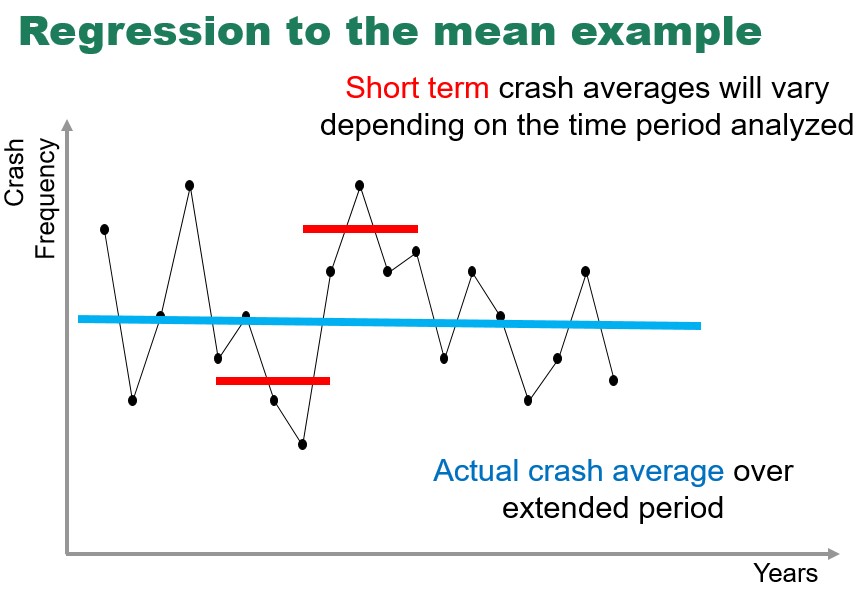
Figure 1: Graph Showing Regression to the Mean
Mountain, Maher and Fawaz (1998) provide a clear example of regression to the mean that can result in overestimation of intervention effectiveness. In a large study covering over 900 sites and 13 612 crashes, they compared crashes occurring during the site identification ‘before’ period, the lag period (the period between a site being selected for treatment and the actual installation of the treatment), and the ‘after’ period. The crash numbers were adjusted to take the different period lengths into account, and the data is summarised in Table 12.1. The difference between the number of crashes occurring in the lag period and the number of crashes occurring in the before period was taken as a measure of the regression to the mean effect.
| Treatment | Biased estimate of reduction due to the treatment (%) | Unbiased estimate of the treatment effect (%) | Estimated reduction due to regression to the mean (%) |
|---|---|---|---|
Surface treatments | 46 | 23 | 23 |
Surface treatments – wet road crashes only | 67 | 27 | 40 |
Mini-roundabouts | 68 | 65 | 3 |
Other junction improvements | 42 | 27 | 15 |
Link realignment | 63 | 37 | 26 |
Other link improvements | 34 | 10 | 24 |
Street lighting schemes | 27 | 5 | 22 |
Traffic management schemes | 41 | 22 | 19 |
All treatment types | 43 | 23 | 20 |
Source: Adapted from Mountain, Maher and Fawaz (1998).
The most robust way of accounting for both the regression to the mean effect and changes in the environment may be through the use of control sites that have been chosen in exactly the same way as the treated sites and have been identified as having similar problems, but have been untreated. The choice as to whether a site is treated or is untreated is based on a random allocation. This type of controlled experiment (or randomised control trial) is rare in road safety infrastructure projects as it is difficult to justify not treating a site that has been identified as high risk.
In recent years, the Empirical Bayes approach has emerged as an effective way of minimising the impact of regression to the mean. Although the Empirical Bayes approach is recognised as good practice in road safety evaluation, not all countries (especially those in LMICs) will have experience in using this technique. If not using this recommended approach, at the very least, a before-and-after analysis using comparison sites should be undertaken, with at least three (but preferably five) years of data collected for the before period. This is because the regression to the mean effect does tend to diminish if considered over longer periods of time. For example, in a study conducted in two counties in the UK, Abbess et al. (1981) calculated that regression to the mean had the following effects:
Where the Empirical Bayes approach has not been used, the above allowances could be made when calculating the reduction in crashes produced by the countermeasures.
When evaluating changes in crashes (or for most of the monitoring measures described in Observation in 12.4 Evaluating Road Safety Infrastructure Interventions), other factors not affected by the treatment might still influence that measure, and therefore will have to be taken into account. Examples include a change in the speed limit on roads that include the treated crash site; national or local road safety campaigns; or traffic management schemes that might affect traffic volume (e.g. closure of an intersection near the site, producing a marked change in traffic patterns). Changes related to external factors may be compensated for by comparing the site under study, for the same before and after periods, with comparison sites (sometimes termed ‘control’ sites) that have not been treated. In order for this data to be valid, it is important that these other sites experience exactly the same changes as the site under evaluation.
Comparison data can be collected either by matched pairs or area controls. A matched pair control site involves finding a site that is geographically close to the treated site (but not close enough to be affected by any traffic diversion), and has similar general characteristics. This is so that the control site will be subject to the same local variations that might affect safety (e.g. weather, traffic flows, safety campaigns, etc.).
In practice it may be difficult to find other sites with similar safety problems that will be untreated purely for the sake of statistical analysis. Area comparisons comprising a large number of sites are, therefore, frequently used.
Comparison group sites should be as similar as possible to the treated sites and they should not be affected by the treatment.
There is still some controversy over whether or not the ‘crash migration’ effect exists. It has been found that crashes tend to increase at sites adjoining a successfully treated site, producing an apparent crash transfer or ‘migration’. Why this effect occurs is unclear, but one hypothesis is that drivers are ‘compensating’ for the improved safety at treated sites by being less cautious elsewhere.
Obviously, to detect such an occurrence, the crash frequencies in the surrounding area of the treated sites before and after treatment need to be compared with a suitable comparison group. In other words, the area of an evaluation study needs to be expanded to include routes that may be impacted by the project, and comparison sites must be identified that have not been affected.
However, there are no established techniques yet available to estimate such an effect for a particular site. The first reported occurrence of this feature (Boyle & W, 1984) found an overall crash increase in the surrounding areas of about 9%, and a later study (Persaud, 1987) of a larger number of sites estimated the increase to be 0.2 crashes per site per year.
A study by Austroads (2010) identified the effects that certain interventions have on the redistribution of traffic, and suggest that this may be a cause of migration. If traffic is reduced at the treated location, it is likely that it will be increased at a nearby location (this is likely in all situations, except the rare circumstance where trip numbers are reduced). It is suggested that this redistribution is more likely for certain types of treatments. For these interventions, evaluation of the effects should include a broader geographic area to capture locations where exposure (and therefore risk) may be increased. Interventions identified as potentially causing such an effect included:
There are several key documents that provide detailed accounts of evaluation methods for road safety infrastructure. These include:
One or more of these documents should be consulted for a full account of how to conduct a road safety evaluation.
The ‘gold standard’ in evaluation methodology is a ‘controlled experiment’ or randomised control trial (RCT). As indicated earlier, this approach is very rare in evaluation of infrastructure interventions. This is mainly due to concerns with leaving high risk sites untreated, but is also due to issues such as lack of knowledge regarding this approach. By randomly allocating sites to a treatment or control group, any biases which arise from treating sites with the worst crash history should be eliminated. External factors which come into play as the evaluation proceeds (such as unforeseen enforcement programmes in the area of the trials) are also catered for, as the external factors can be assumed to affect the treatment and control sites equally. The difference between the treatment and control sites in the after period is a true reflection of the influence of the treatment.
The currently recommended approach for evaluation of infrastructure interventions is the Empirical Bayes (or EB) method. Hauer (1997) explains this procedure in its simplest form, which is recommended reading for those wishing to understand the logic behind this approach as it applies to road safety. T
The approach uses the concept of an ‘expected’ number of crashes, or the long-term average, calculated over as long a period as is considered useful. The second concept is the ‘reference population’, or a set of similar sites or routes for which data is available (e.g. all intersections of a certain type in a network). The reference population acts like a comparison group. In the classical version of EB, the number of crashes which would be expected at a treatment site if no intervention had taken place is estimated and compared with the number of crashes that actually occurred. The comparison of the actual number of crashes with the expected number of crashes indicates the extent of the CMF.
A commonly applied method for the evaluation of infrastructure safety is the before-and-after study utilising a comparison group. Even though this approach does not fully address the issue of regression to the mean (although as indicated above, using a longer ‘before’ time period can reduce this effect), it does limit the impact of external factors. The approach compares the outcomes at the treatment sites with the outcomes at a set of comparison sites (sometimes termed ‘control’ sites), which have similar characteristics to the treatment sites in all important aspects, except that the treatment is not installed. This approach assumes that external factors act on both the treatment sites and the comparison sites in an identical way, and so can be measured and allowed for. Since the treatment sites and the comparison sites are subject to the same sets of external variables, any difference in safety outcomes must be due to the treatment.
The most basic form of evaluation (and one that has often been applied) is to simply compare crashes in the period before an intervention is installed with the crashes after (termed a simple or naïve before-and-after study – i.e. without a comparison group). This approach is not recommended, as it does not adequately account for regression to the mean or external variables.
Cross-sectional studies have also been used to try and identify the effects of safety interventions. These studies compare safety performance of sites with a particular safety feature (or features) with sites that do not have the same feature. It is assumed that the difference in safety performance is due to this feature. There are many issues with using this approach (particularly differences between sites other than the feature of interest; and differential crash rates that may have led to the installation of the feature in the first place), therefore it should not be used for this type of evaluation (however, if it is used, the limitations should be well-understood and documented).
In evaluating a particular treatment, the answers to the following questions will usually be required:
The rare and random nature of road crashes can lead to fairly large fluctuations in crash frequencies at a site from year to year, even though there has been no change in the underlying safety level. This extra variability makes the effect of the treatment more difficult to detect, but a test of statistical significance can be used to determine whether the observed change in crashes is likely to have occurred by chance or not.
The main problem with using crash data for evaluation (even assuming high recording accuracy) is distinguishing between changes due to the treatment and changes due to other sources. As explained earlier, even if the selected sites are good comparison groups that take into account the environmental influences, there are other confounding factors that need to be considered.
There are a number of points to take into account when choosing time periods used to compare crashes occurring before and after treatment; these include:
As identified throughout this chapter, there are a number of documents that provide a detailed guide to evaluating intervention effectiveness. There are also various tools to help with this task. Box 12.2 provides a summary of the Countermeasure Evaluation Tool from SafetyAnalyst.
Developed by the American Association of State Highway and Transportation Officials (AASHTO), the Countermeasure evaluation tool is part of the SafetyAnalyst suite of tools. It provides step-by-step guidance for conducting evaluation of the benefits of safety interventions using the Empirical Bayes approach. Therefore, it is able to account for the effect of regression to the mean (see above). As well as detecting the overall change in crashes (the CMF), the tool can also identify the effect on specific target crash types. For further details see Harwood et al. (2010) or http://www.safetyanalyst.org/evaltool.htm.
Source: Harwood et al. (2010).

© ARRB Group
AASHTO (2010) Highway Safety Manual, American Association of State Highway and Transportation Officials, Washington, USA.
Abbess, C.D. Jarrett & W, C.C. (1981) Accidents at blackspots: estimating the effectiveness of remedial treatment, with special reference to the “regression to the mean” effect. Traffic Engineering & Control, V22, N10., pp. 532-542
Austroads, (2010), Road Safety Engineering Risk Assessment, Part 2: Crash Risk Migration, Austroads Technical Report AP-T147/10, Sydney, Australia.
Austroads (2012) An Introductory Guide for Evaluating Effectiveness of Road Safety Treatments. Austroads, Sydney, Australia.
Boyle, A.J. & W, C.C. (1984) Accident ‘migration’ after remedial treatment at accident blackspots, Traffic Engineering & Control, V25, N5, pp. 260-267.
Global Road Safety Facility GRSF (2009), Implementing the Recommendations of the World Report on Road Traffic Injury Prevention. Country guidelines for the Conduct of Road Safety Management Capacity Reviews and the Specification of Lead Agency Reforms, Investment Strategies and Safe System Projects, Global Road Safety Facility World Bank, Washington DC.
Gross, F Persaud, B and Lyon, C (2010) Guide to developing quality crash modification factors, Federal Highway Administration (FHWA), Washington, DC.
GRSP (2006), Helmets: a road safety manual for decision-makers and practitioners, WHO, Geneva, Switzerland.
GRSP (2007), Drinking and driving: a Road Safety Manual for Decision-makers and Practitioners, Global Road Safety Partnership, Geneva, Switzerland.
GRSP (2008), Speed management: a road safety manual for decision-makers and practitioners, GRSP, Geneva, Switzerland.
GRSP (2009), Seat-belts and child restraints: a road safety manual for decision-makers and practitioners, FIA Foundation for the Automobile and Society, London, United Kingdom.
Harwood, D Torbic, D. Richard, K. & Meyer, M, (2010), SafetyAnalyst: Software Tools for Safety Management of Specific Highway Sites. Federal Highway Administration, McLean, Virginia.
Hauer, E (1997), Observational before-after studies in road safety, Pergamon, Oxford, UK.
Hauer, E. & Byer, P. (1983) Bias-by-selection: the accuracy of an unbiased estimator, Accident Analysis & Prevention, V15, N5, pp.323-328
Kulmala, R. (1994) Measuring the safety effect of road measures at junctions. Accident Analysis & Prevention V26, N6, pp. 781-794.
Maher, M.J. & Mountain, L.J. (1988) The identification of accident blackspots: a comparison of current methods, Accident Analysis & Prevention, V20, N2.
McKenna, F, (2010), Education in Road Safety: Are we getting it ? RAC Foundation, London, UK.
Mountain, L, Maher, M & Fawaz, B, (1998), ‘Improved estimates of the safety effects of accident remedial schemes’, Traffic Engineering and Control, vol. 30 no.10, pp. 554-8.
OECD/ITF (2012) Sharing Road Safety, Organisation for Economic Co-operation and Development (OECD), Paris, France.
Persaud, B. (1987) Migration of accident risk after remedial treatment at accident blackspots, Traffic Engineering & Control, V28,N1, pp. 23-26.
Radin Umar, R.S., Mackay, G.M. & Hills, B.L. (1995) Preliminary analysis of motorcycle accidents: short term impacts of the running headlights campaign and regulation in Malaysia, Journal of Traffic Medicine.
W, C.C & Boyle, A.J. (1987) Road accident causation and engineering treatment: a review of current issues. Traffic Engineering & Control, V28, N9, pp. 475-479.
Washington State, Washington State Target Zero Strategic Highway Safety Plan, p. 7
World Health Organization (2017)