


1.3 Socio-economic costs of road traffic crashes
Evaluating costs and the value of injury prevention
Evaluation of the direct and indirect socio-economic costs of the outcomes of road traffic crashes is important. This allows measurement of the burden that road traffic crash injury imposes on society and highlights the return on investment in road safety and the relative benefits and costs of different policy options in the allocation of resources.
Inadequacies in data collection, serious under-reporting of road traffic injuries, and the lack of an adopted global method in valuing the prevention of death and serious injury, do not allow precise estimates to be made of the socio-economic value of their prevention in LMICs. However, approximate and conservative estimates have been made at global and regional levels. In many HICs, effective practice provides more reliable estimates involving periodic updating of economic values for preventing different injury severities using the willingness to pay method (see Section 11.4. Priority Ranking Methods and Economic Assessment for further discussion).
Global estimates
Road traffic crashes cost most countries around 3% of their gross domestic product. Low-and middle- income countries are estimated to experience even greater economic losses, losing up to 5% of their gross domestic product (GDP) each year (WHO, 2015). Global costs are even higher if under representation of deaths and injuries in available statistics and the social costs of pain and suffering are fully accounted for. The International Road Assessment Programme (iRAP) has calculated that serious road trauma now costs the world more than US$2.2 trillion per year, or US$6.1 billion every day (iRAP, 2023) (see Box 1.4).
BOX 1.4: ROAD DEATHS ARE JUST THE TIP OF THE ICEBERG
More than 3600 people are killed in road crashes every day. Road crashes are the leading cause of death for young people.
But this is just the tip of the iceberg. More than 100,000 people suffer injuries every day, including severe brain injury, quadriplegia, fractures, internal injuries and burns. Road crashes often result in life- long suffering and disability and place a huge toll on families and communities.
Apart from the emotional impact of serious crashes, the cost of emergency response, trauma wards and long-term health care is immense. Australia's Transport Accident Commission (TAC) claim data shows that more than half of all cost occur more than two years after a crash, buried deep within health and social welfare systems.
However, there is a significant gap in evidence and data about road crash injuries and their costs worldwide. To help support debate about the scale of response to this enormous level of trauma and cost, iRAP has drawn on data from the WHO, TAC, Institute for Health Metrics and Evaluation, and the International Monetary Fund (IMF) to make simple, high-level estimates of global injury types and their costs.
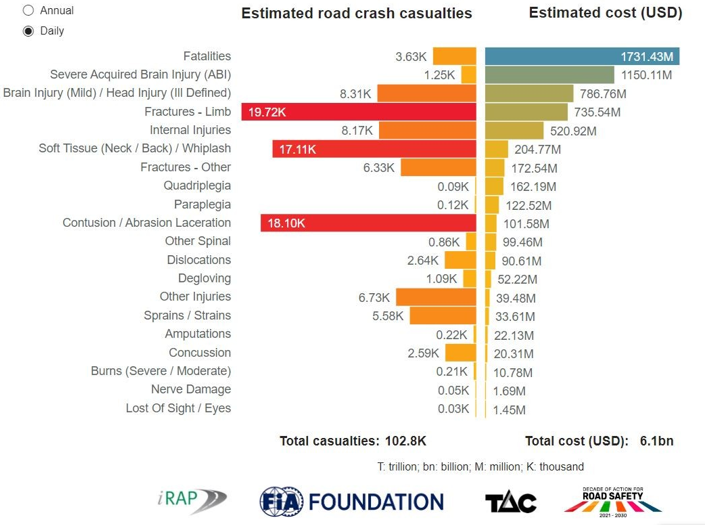
FIGURE 1.6: ESTIMATED DAILY ROAD CRASH DEATHS, INJURIES AND COSTS
who BEARS THE COST?
The large burden of costly injuries is borne by society in general. However, a large part of the burden is particularly within the health sector in terms of costs to the emergency medical system, with employers in terms of premature loss or disablement of the world’s most economically active citizens, and with households in terms of loss of the main wage earner. A summary of some of those directly bearing the cost of road injury and death is provided below:
- Health system: In LMICs, road traffic-related injuries represent a particularly heavy drain on emergency medical system resources. For example, in India, road traffic injury patients represent between 20–50% of emergency room registrations, 10–30% of hospital admissions and 60–70% of people hospitalised with traumatic brain injury (Gururaj, 2008). Despite continuing progress in HICs, involvement in road crashes continues to be a leading cause of death and hospital admission, and a significant drain on emergency medical systems. For example, road traffic injury is the leading cause of hospital admission for citizens of the European Union aged 45 years or below (European Commission, 2009)
- Employers: Work-related road crashes and injuries present substantial costs for employers (DaCoTA, 2012b). The real costs of road crashes to organisations are nearly always significantly higher than the resulting insurance claims (ORSA, 2011). Crash costs include lost work time, lost orders and production losses; emergency medical costs; vehicle repair and maintenance costs; damage to employer reputation – especially when vehicles bearing the company name are involved; and environmental costs due to spillages of dangerous substances.
- Households: Research shows that road traffic crashes have disproportionate costs for low-income households (Aeron-Thomas et al., 2004; Graham et al., 2005). The loss of the major family wage earner because of a road traffic crash can push households into poverty and limit the ability of victims to cope with the consequences. Costs can include immediate and long-term costs associated with medical treatment and care, and the value of lost earnings where a family member must give up paid work and care for the crash victim. The financial impact on families has been shown to result in increased financial borrowing and debt, and even a decline in food consumption (WHO, 2013a).
A high price in socio-economic terms is being paid for motorised mobility in all countries of the world. In particular, road traffic injuries in LMICs are a financial drain they can ill afford, which inhibits their desired social and economic development (FIA Foundation, 2005). Road safety investment in both LMIC and HICs needs to be scaled up to match the high socio-economic values of preventing death and serious injury in road crashes (WHO, 2009; DaCoTA, 2012c).