


1.2 The impact on public health
This section describes the current and forecast burden of road traffic injuries in more detail, both globally and regionally.
The Global Status Report on Road Safety (WHO, 2023) is the central publication for periodic monitoring and evaluation of the Decade of Action for Road Safety goals. While crash injury data is incomplete and often substantially under-reported in many countries in both the health and transport sectors, the latest available estimates referred to in this manual provide a comprehensive strategic overview of the emerging crisis in LMICs.
The Global Status Report brings together data based on survey information collected for 170 countries, and makes estimates, where appropriate, to account for varying levels of data quality in order for data to be comparable across countries. This includes use of the 30-day definition of a road traffic death and involves point estimates of road traffic deaths in LMICs, which are sometimes far in excess of officially reported deaths. Data have been extrapolated for all 196 countries and territories in the world. Full details of the methodology used to develop comparative estimates are provided in WHO (2023, p. 59).
The Global Status Report notes the urgent need for standardised data collection on road traffic fatalities and the need for improvement in the quality of safety data on road traffic deaths, disability and other non- fatal injuries. See Chapter 5. Effective Management and Use of Safety Data for full discussion and guidance on the establishment, management and use of data, and determining levels of under-reporting.
Global estimates
In 2021, the number of road traffic deaths was estimated 1.19 million (WHO, 2023). Road traffic injury is a leading cause of death and serious health loss (expressed in terms of disability adjusted life years lost (DALYs, i.e. the sum of years lost due to premature death and years lived with disability, also defined as years of health life lost) (see Box 1.3). For every road traffic death, at least 20 people sustain non-fatal injuries (ranging from those that can be treated immediately and for which medical care is not needed or sought, to those that result in a permanent disability (Peden et al., 2004). On an annual basis, between 20 and 50 million people are disabled or injured as a result of road traffic crashes (WHO, 2018).
Box 1.3: Road traffic injury as a leading cause of death and serious health loss
Key insights from the Global status report on road safety 2023:
- Approximately 1.19 million people die each year as a result of road traffic crashes.
- Road traffic injuries are the 12th leading cause of death, overtaking HIV/AIDS, tuberculosis.
- Road traffic injuries are the leading cause of death for children and young adults aged 5-29 years.
- More than half of all road traffic deaths are among vulnerable road users: pedestrians, cyclists and motorcyclists.
- 92% of the world's fatalities on the roads occur in low- and middle-income countries.
Source: WHO, 2023
In some regions, road traffic injury was the leading cause of death for certain age groups, as shown in Table 1.1. For HICs in general, road traffic injury was the leading cause of death for children aged 5-14 years (IHME, 2013). A study in four LMICs indicated that 17% of children attending an emergency department following a road traffic crash sustained disability lasting six weeks or more (WHO, 2008).
| Region | 1–4 years | 5–9 years | 10–14 years |
|---|---|---|---|
| North America | 1 | 1 | 1 |
| Central Europe | 3 | 1 | 1 |
| Australasia | 2 | 1 | 1 |
| Western Europe | 2 | 2 | 1 |
| North Africa and Middle East | 4 | 1 | 1 |
| Latin America | 4 | 1 | 1 |
Death rates
In 2021, the global road traffic fatality rate was 15 per 100,000. With an average of 21 deaths per 100,000 population in low-income countries. The risk is more than three times higher in low-income countries than in high-income countries where the average rate is 8 deaths per 100,000 (WHO 2023).
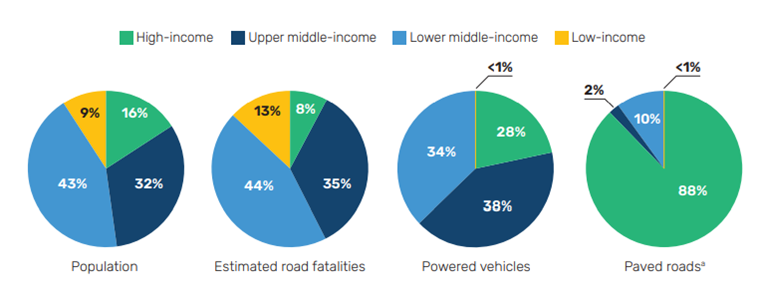
Many road traffic deaths, 92%, occur in upper-middle, lower-middle, and low-income countries combined, which account for 84% of the world's population, 73% of the world's powered vehicles and less than 13% of all paved inter-urban roads. As shown in Figure 1.2, these countries have a high proportion of road traffic fatalities relative to their level of motorisation (WHO, 2023).
There has been more progress in reducing the number of road traffic deaths among middle- and high- income countries than low-income countries. (see Figure 1.3).
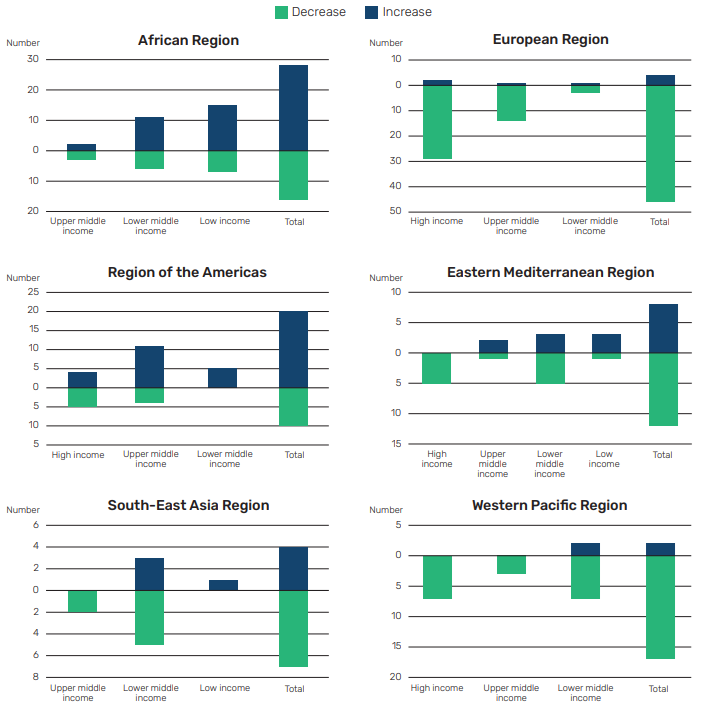
The reductions of road traffic deaths have been observed across four regions, ranging from a 36% decrease in the European Region to a 0.1% decrease in the Region of the Americas, a 2% reduction in the South-East Asia Region; and a decrease of 16% in the Western Pacific Region. In contrast, the number of deaths rose in 66 countries (WHO, 2023).
The main road casualty groups
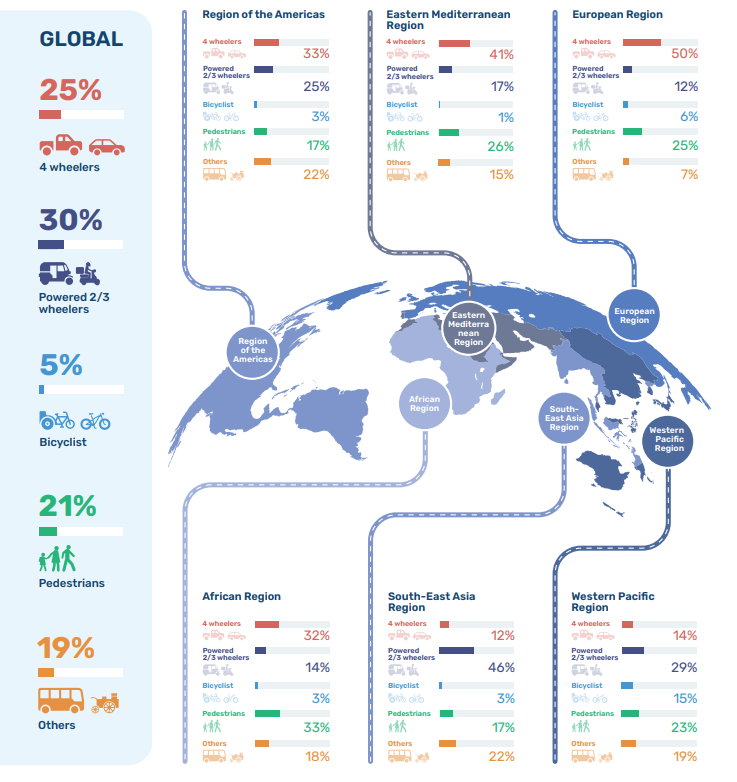
In most LMICs, a much higher proportion of road users are pedestrians, cyclists and users of motorised two- or three-wheeled vehicles when compared with HICs. Over half of the global road traffic deaths occur among vulnerable road users – pedestrians and cyclists represent 26% of all deaths with those using motorized two- and three-wheelers comprising another 30%. Car occupants make up 25% of all deaths and the remaining 19% are occupants of vehicles carrying more than 10 people, heavy goods vehicles, ‘other’ users and ‘unknown’ user types (WHO, 2023).
Even in HICs, vulnerable road users are often vastly over-represented when rates of death and serious injury are compared. For example, when the distances travelled (billion miles) by different modes of road use were compared, more than 10 times as many pedestrians and cyclists than car drivers lost their lives on Great Britain’s roads in 2011. For motorcyclists, the rate was around 40 times higher (Department for Transport, 2012). The gap is even wider when considering the risk of death or serious injury by billion vehicle miles. For each car driver in Great Britain, more than 20 times as many pedestrians and around 40 times as many cyclists were killed or suffered a serious injury from a road traffic crash. Motorcyclists were exposed to the greatest risk, as they were 75 times more likely to be killed or seriously injured than a car driver (Department for Transport, 2012).
Regional analyses
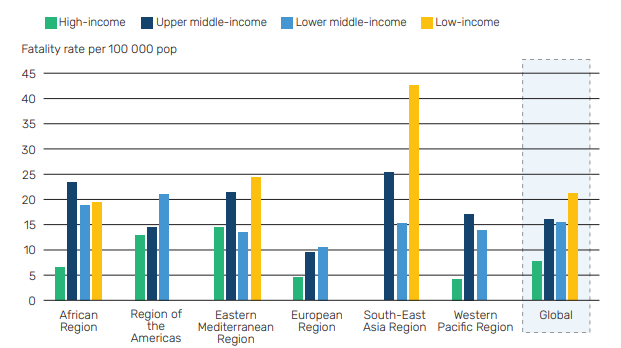
There is substantial variation in the road traffic death rates between different regions and within regions (see Figure 1.4). The reported risk of fatal injury is greatest in Africa at 19 per 100,000 populations and lowest in the European region at 7 per 100,000 population (WHO, 2023). Within regions, taking under-reporting of road fatalities into account, it is estimated that over half of African countries may have death rates of 30 per 100,000 population or more (AfDB, 2012).
As shown in Figure 1.5, in four out of six WHO regions, car occupants are the largest fatal casualty group.
Future trend forecasts
Modelling of historic global trends indicates that if LMICs choose to follow the costly evolutionary path of HICs in reducing deaths and serious injuries as they built knowledge, then the road death toll in LMICs is likely to increase very substantially (Kopits and Cropper, 2003; WHO 2013b). Latest forecasts indicate that, based on current trends, 96% of the global total of road deaths by 2030 are likely to occur in LMICs (WHO, 2013b).
The highest projected regional death rates (deaths per 100,000 persons) to 2030 are in Sub Saharan Africa (38), South Asia (29) and the Middle East and North Africa region (28) with decreasing rates between 2015 and 2030 in the East Asia and Pacific and Latin America and Caribbean regions and, most sharply, in the European and Central Asia regions (see Table 1. 2). There is large regional variation in LMICs in the number of deaths per 100,000 persons with the highest rates being 4 times higher than the lowest. By 2015, the death rate from road traffic crashes was forecast to be around 8 per 100,000 persons in HICs decreasing to 6 by 2030 but nearly 20 in 100,000 persons in LMICs (WHO, 2013b).
| World (World Bank regions) | Deaths per 100,000 persons | |
|---|---|---|
| 2015 | 2030 | |
| South Asia | 21 | 29 |
| East Asia and Pacific | 22 | 18 |
| Sub-Saharan Africa | 25 | 38 |
| Middle East and North Africa | 26 | 28 |
| Latin America and Caribbean | 20 | 19 |
| European and Central Asia | 14 | 9 |
| High-income countries | 8 | 6 |
| Global total | 20 | 22 |
The relative importance of road traffic injury to other disease burdens is also predicted to increase steeply. Forecasts of global mortality trends to 2030 indicate that road traffic injury is set to increase from the 9th to the 7th cause of death, as shown in TABLE 1.2 (WHO, 2013b).
Where do deaths and serious injuries occur?
Country road safety management capacity reviews and other studies reveal that most road deaths and serious injuries occur on a relatively small proportion of the road network. Such roads usually have both urban and rural sections. In India, around two-thirds of deaths occur on national and state highways, which account for just 6% of the network (Mohan et al., 2009). In Bangladesh, just 3% of arterial roads account for 40% of the road deaths (Hoque, 2009). Statistics from a wide range of countries show that typically, around 50% of deaths occur on just 10% of the road network (McInerney, 2012). These roads have high strategic priority, attract large investment, and are particularly amenable to targeted road safety treatments (Bliss & Breen, 2013).
Typically, in the main road network, traffic volumes and vehicle speeds are high, with a mix of motorised traffic and non-motorised users, and mixed speed road environments (Commission for Global Road Safety, 2011; GRSF, 2006–2013; UNRSC, 2011b). A key problem is that many road standards used in road projects in LMICs do not provide for the degree of human vulnerability involved in the use of the road network. Furthermore, the efficient and effective police enforcement of safety behaviours, which contribute to the overall safety performance of road safety engineering standards in high-income countries, is lacking. Junction design standards and the management of road use from low- to high-speed environments expect vulnerable road users to compete successfully against faster, bigger vehicles, with tragic consequences (GRSF, 2010, 2011 ). While new roads bring new opportunities for development, many increase the risk of death and serious injury where roads are not restricted to through-traffic, where linear settlements are not avoided, and where there is no first class provision for pedestrians, cyclists and other vulnerable road users (UNRSC, 2011b). Specific global guidance to assist with project design for the road safety management of corridors is provided in Chapter 6. Road Safety Targets, Investment Strategies, Plans and Projects and in Part 3 Planning, Design & Operation of this manual as well as global references on this issue (e.g. UNRSC, 2011b; Bliss & Breen, 2009, 2013; Breen et al., 2013).
What are the main road traffic crash types?
The main crash types on the world’s roads have been identified as follows (UNRSC, 2011b):
- Walking and cycling across or along the road. A vulnerable road user’s risk increases steeply in mixed speed traffic when traffic speeds are greater than 30 km/h.
- Head-on crashes typically kill and seriously injure occupants even in the best designed vehicles at speeds greater than 70 km/h.
- Side impacts at intersections typically kill and seriously injure occupants even in the best designed vehicles at speeds greater than 50 km/h.
- Run-off-road crashes into rigid fixed objects produce a high number of fatal and serious outcomes at speeds greater than 70 km/h for frontal impacts and 50 km/h for side impacts even in the best designed vehicles.
Further information is provided on the main crash types in Section 4.4. Reassessing Crash Causation Factors and Crash Types and in Part 3 Planning, Design & Operation.
What are the key road safety problems?
Road safety problems in low-, middle- and high-income countries are found across road safety management systems, including in:
- The quality of institutional management arrangements: in leadership and results focus, coordination, legislation, funding, promotion, monitoring and evaluation, research and development, and knowledge transfer, which provide the foundation for producing intervention and improved road safety results.
- The scope and quality of the intervention set: in the planning, design, operation and use of the road network; in the safety quality of vehicles and emergency medical response; insufficient attention to the evidence-base or to addressing the needs and vulnerabilities of all users.
- The level of road safety results achieved for final outcomes: e.g. levels of deaths, serious injuries, costs; intermediate outcomes (e.g. level of safety quality of roads and vehicles, emergency medical system response, levels of drinking and driving, speeding, seat belt and crash helmet use); and institutional outputs (e.g. numbers of speed checks, breath tests).
LMICs present some particularly complex challenges for road safety work. Weak road safety management capacity as well as the lock of road safety research facilities in many countries presents a large barrier to road safety progress (GRSF, 2006–2013; PIARC, 2023). Road safety progress will be linked to other development priorities such as:
- Broad institutional development and governance.
- The establishment or improvement of health systems.
- Infrastructure network development.
- Police and judicial reform.
Country road safety investments in LMICs will have to be sustained over a long period and across a range of sectors, directed by appropriately resourced governmental lead agency arrangements. Such government-led road safety policy may find its foundation in strong local academic research. Universities and institutes play a critical role in transforming international knowledge about Safe System concepts and principles towards evidence-based measures for the local LMIC context, taking into account local traffic conditions and safety culture (PIARC, 2023).
Full discussion and guidance are provided in subsequent sections on critical success factors for addressing key road safety problems. This will address the needs of LMICs with their own special challenges. It will also provide guidance for HICs that are currently in the process of addressing strict Safe System parameters, which include new speed thresholds as well as the broader environmental and public health drive for more active transport solutions.