


5.3 Establishing and Maintaining Crash Data Systems
This section provides guidance on the establishment and maintenance of crash data systems. Information on the collection and use of other sources of data can be found in the following sections. Full details on the establishment and maintenance of crash data systems can be found in WHO (2010). The following is a summary of key issues.
Sources of Crash Data
Identified effective practice acknowledges that no single crash injury database will provide enough information to give a complete picture of road traffic injuries or to fully understand the underlying injury mechanisms (IRTAD, 2011). A number of countries which have improved their road safety performance use both crash injury data collected by the police as well as health sector data.
National crash data are typically collected by police (WHO (2023) reports that over 70% of countries use police data as the primary source), and entered into crash database systems for easy analysis and annual reporting. In some circumstances, data are collected from hospitals, or from both of these sources. The use of health sector data for meaningful injury classification at country level is necessary to complement police data and to provide an optimal means of defining serious injury. IRTAD (2011) recommends that police data should remain the primary source of road crash statistics, but that this should be complemented by hospital data due to data quality issues and to identify levels of under-reporting (see Section 5.4 Non-Crash Data and Recording Systems ). Furthermore, in-depth data is needed from crash injury research to lead to meaningful conclusions concerning crash and injury causation.
National police-reported crash data
The police are well placed to collect information on crashes as they are often called to the scene. Alternatively, they may receive information about the crash following the event. Attendance at the crash scene allows for collection of detailed information that is useful for identifying crash causes and possible solutions.
A crash report form is typically completed to document the detail of a crash. These forms can be a traditional papers-based form or computer-based systems like:
Portable computers: that can enhance the legibility of crashes reports, reduce input errors, and ease the workload on report-processing personnel. However, they may increase the burden on police officers at the scene, where they should be ensuring safety and minimizing road closures. To address this, it is crucial to optimize the interface capabilities of portable computers, allowing officers to complete reports efficiently and reduce the time spent on data entry at crashes scenes.
Pen-based computers: (or clipboard computers) permit data entry in the old-fashioned way (pen and form), while their character or pattern recognition features convert marks made on an electronic screen table into recognizable characters, thus generating an electronic database at the same time. Customized software can be developed specifically to assist in the completion of crash report forms.
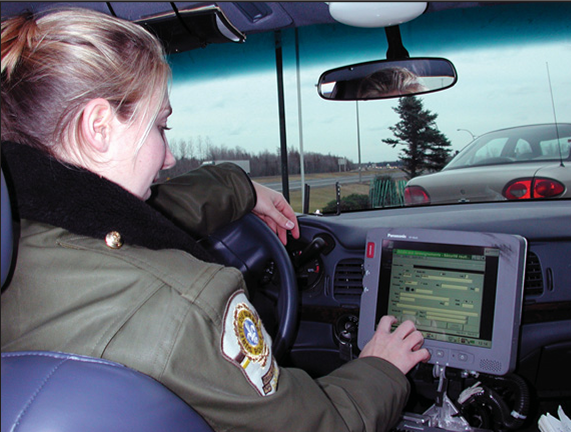
Palmtop computers: are ideal for simple data collection tasks, using either a pen-based screen or a small keyboard. Palmtop computers may be very useful in police cars, where they can be mounted on the dashboard, taking up little space.
Magnetic stripe: systems work by using a magnetic field to record data as magnetic signals (called flux reversals) on a magnetic strip, similar to what’s used in audio or video tapes. When read by a decoder, these signals are converted into letters and numbers. A magnetic stripe can store a decent amount of data-about 120 bytes.
Bar codes: consist of black and white patterns that represent letters or numbers, allowing officers to quickly scan and retrieve vehicle and driver information, reducing transcription errors. These barcodes can be found on vehicle labels, registration certificates, and driver’s licenses, and can include details like vehicle type, safety features, and even the license photograph.
Radio frequency: modems can be used to relay digital data communication between a portable computer and a mainframe computer. A police officer may retrieve data on a vehicle or its owner within seconds by simply entering the licence plate data into a portable computer or terminal carried in the patrol car. Electronic report forms can be forwarded by modem to a data centre.
‘Smart’ cards are electronic cards, similar to credit cards, that store and transmit information. Smart cards could be used to store all vehicle status and operational data.
Digital cameras can produce excellent-quality pictures in digitized format, which can then be copied into a computer and easily attached to a crash database or electronic report form. Digital cameras are useful tools for an investigating police officer.
At a crash location, collecting crash data is not the only task of police officers, they have also to secure the site, care for injured persons and re-establish traffic flow. On-scene data collection systems must consider the officers needs and work constraints when implementing new technologies. Expert systems developed for crash data collection can ease the workload of police officers on-site in addition to increasing the accuracy and consistency of reported data. Expert systems are computer programs that contain knowledge in a specific field. While collecting the necessary information on the circumstances of a crash, a police officer has to make certain judgments such as: Did the driver/passengers really wear their safety belts as stated? What is the extent of vehicle damage? How should the severity of the crash be classified? Answering these and other questions not only takes valuable time at the scene but may also lead to inconsistent statistics as officers may judge situations differently. Expert systems can embed rules that help police officers in providing more accurate answers to such questions. Such systems also allow them to collect both state-required data and specific pieces of information that are particularly relevant to a given road context (e.g. roadside conditions in the case of a single vehicle crash or lighting conditions in the case of a night crash).
Key variables typically collected include:
- Crash location (including geographic coordinates).
- Time of day, day of week, month of year, year.
- Information on those who were involved (including road user type, age, gender, injury sustained).
- Details regarding the road (whether at an intersection, speed limit, curvature, traffic control, markings).
- Details on the environment (light conditions, weather, road surface wet or dry).
- Information regarding what happened in the crash (vehicle movement types, objects struck (including off-road), and contributory factors such as speed, alcohol use or driver distraction).
- Vehicle factors (type of vehicles involved).
Examples of crash report forms, including the types of detail that should be collected as a minimum can be found in WHO (2010). The advice provided in the WHO document is based on the European Common Accident Dataset (CADaS). Similarly, the World Bank Guidelines for Conducting Road Safety Data Reviews (Martensen et al., 2021) refer to a set of 28 road crash attributes derived from CADaS. In addition, a number of countries have developed their own minimum criteria. For example, the US has a Model Minimum Uniform Crash Criteria (NHTSA, 2025).
A balance needs to be reached between collecting the required information, and the time it takes to perform this task. If too much burden is placed on the police, it is less likely that the crash report form will be completed. Police are key stakeholders in the establishment and continued collection and use of crash data and should be included at each stage of the process.
Others modern technology may help to collect data in case of crashes:
Crash data recorder
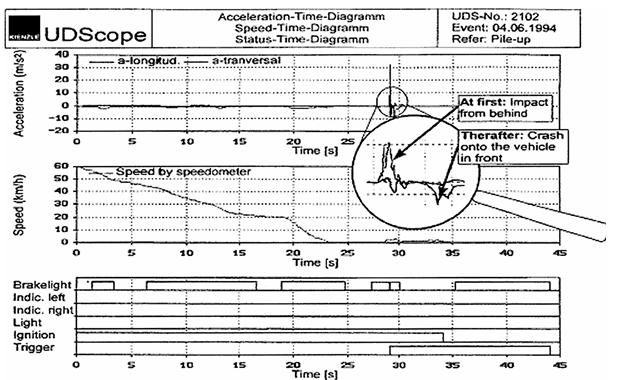
In crash investigations, the absence of traditional evidence like skid marks can complicate the process of determining what actions the driver took before the crash. But modern vehicles equipped with Anti-lock Braking Systems (ABS) can prevent visible skid marks from appearing on the road surface. As a result, investigators may lack critical visual clues. To overcome this challenge, Accident Data Recorders (ADRs) or ‘black boxes’ are increasingly used in vehicles, much like flight recorders in airplanes. These devices capture and store crucial data about the vehicle's behaviour just before and during a crash. The data recorded can include:
In crash investigations, the absence of traditional evidence like skid marks can complicate the process of determining what actions the driver took before the crash. But modern vehicles equipped with Anti-lock Braking Systems (ABS) can prevent visible skid marks from appearing on the road surface. As a result, investigators may lack critical visual clues. To overcome this challenge, Accident Data Recorders (ADRs) or ‘black boxes’ are increasingly used in vehicles, much like flight recorders in airplanes. These devices capture and store crucial data about the vehicle's behaviour just before and during a crash. The data recorded can include:
- Transversal and longitudinal acceleration: Measures the speed changes of vehicle along different axes, which can help understand the vehicle's movement and forces during the crash.
- Speed: Gives the exact speed at the moment of or just before the collision.
- Vehicle rotation: Captures the angular momentum of vehicle, indicating if and how the vehicle spun or rolled.
- Skidding: Tracks if the vehicle entered a skid, which could indicate loss of traction or control.
- Activation of ignition, lights, flashers, and brakes: Monitors whether critical vehicle systems were engaged or disabled at the time of the crash.
The crash recognition is fully automatic, and the data are recorded with precision from 30 seconds before until 15 seconds after the crash. The device can be installed in any kind of vehicle and is able to store data for more than one crash.
Photogrammetric measurement
This involves taking a standard set of pictures of the exterior and interior of the vehicle with specially adapted small-format cameras. The pictures are then used to create three-dimensional images. Fieldwork is completed in a few minutes. Evaluation is done separately using the data collection and involves experts when needed. This device can be used to determine the efficiency of restraint equipment.
Hospital data
Hospital data is used to identify levels of under-reporting or to obtain better injury information, particularly when police report data is not available or is inadequate. IRTAD (2011) suggests that because of under-reporting of crash data, hospital data should also be collected and is the next most useful source of information for crash statistics.
Encouraged by the WHO and other institutions, medical authorities have established international recording systems that include road traffic injury. In particular, the International Classification of Diseases and related Health Problems (ICD) and the Abbreviated Injury Scale (AIS) coding systems are used widely. IRTAD (2011) recommend that an internationally agreed definition of ‘serious’ injury be developed, and that the Maximum Abbreviated Injury Scale (MAIS) be used as the basis for defining crash injury severity. This scale is based on maximum injury severity for any of nine parts of the body. A score of 3 or greater for one or more regions of the body (MAIS3+) is recommended as the point at which an injury is considered to be serious. An example of the use GIS analysis and hospital data from Thailand is provided below.
CASE STUDY - Thailand: Khon Kaen Province: GIS spatial analysis of hospital data
Although information on crashes existed from other sources, it was not sufficient to adequately manage safety in Khon Kaen province, Thailand. An alternative source of information existed from hospital data, but this did not provide information on crash locations. Khon Kaen Regional Hospital in the northeast of Thailand has had its own Trauma Registry since 1989 and added additional information on road crashes through the use of an ‘Accident Report’ form and also developed GIS mapping. This information has allowed detailed analysis of crash data, including the identification of high risk locations. A number of detailed studies on specific road safety issues have been undertaken over recent years based on this rich source of information. Read More.
A further example is provided in the case study from Egypt, demonstrating the integration of data from different sources, as well as the use of this data by various key stakeholders.
CASE STUDY - Egypt: EU twinning project on enhancing road safety
The need for a centralised and accurate accident data system occurred in Egypt. The National Accident Management system is intended to be built as a new system for both investigating and analysing road crash data and it is intended as a shared ‘space’ for all parties responding to different kinds of road crashes, such as medical rescue services, police forces, fire brigades, hospital personnel and the road administration. The main outcome was that underreporting was successfully diminished and a close cooperation between the key stakeholders and a detailed system of information for crash investigations was achieved. Read More.
Registration systems
‘Vital registration’ data can be used as a source of information on road deaths. This information comes from death certificates completed by doctors which state the cause of death. WHO (2010) reports that around 40% of WHO member countries collect vital registration data of the detail required for monitoring road traffic deaths. WHO and other organizations have instituted an international registration system that includes those injured in traffic crashes.
Other crash data sources
Other sources of data on crashes can come from emergency services, tow truck drivers, members of the public, insurance companies, etc. However, it is important to recognise that the quality and extent of this information may be limited when compared to police and hospital reported data.
Establishing or Improving Crash Databases
Before establishing a new crash database system (or improving a current system), it is recommended that a situational assessment be undertaken (WHO, 2010 and Martensen et al., 2021). This involves:
- Stakeholder analysis.
- Assessment of data sources and existing systems/quality.
- End user needs assessment.
- Environmental analysis.
These same steps are also required when establishing or improving on the collection of non-crash data (see Section 5.4 Non-Crash Data and Recording Systems ).
A stakeholder analysis involves identifying organisations and individuals who have (or should have) a role in the collection and use of road safety data. Critical stakeholders will include police, transport agencies and health departments, but there are likely to be many others.
An assessment of data sources is required to determine what information is already collected, and the quality of the data. This is often a significant problem in many countries.
An end user assessment involves understanding who the key users are and, how these key stakeholders use the information. This knowledge will help improve the usability of the data.
An environmental analysis involves understanding the political environment and critical partnerships required for the successful collection, analysis and use of the data. Without this understanding and appropriate collaboration, it is likely that collection and use of crash data will be severely hindered. There are many examples where expensive crash data systems have been established, but data has not been entered into the system due to inadequate communications and poor cooperation.
Following this situational assessment, the recommended process for establishing a crash database system is to:
- Establish a working group (typically drawn from the stakeholder analysis).
- Choose a course of action.
- Recommend minimum data elements and definitions.
- Design and implement the system (or improve the current system) (WHO, 2010).
Crash location is a key element in collecting and analysing data, particular for road engineers. Without this information, it is not possible to determine what locations to treat in the future. In addition, if the crash location is known (whether from police reports or other sources of data), there is potential to link this crash data to asset or other data sources (see Section 5.6 Analysis and Use of Data to Improve Safety ). This information may be of use in identifying other road-based elements that may have contributed to the crash risk.
Several methods are available for the accurate location of crashes, including the use of global positioning systems, reference to a local landmark (e.g. a link-node system), or reference to a route kilometre marker post (a linear referencing system).
Historically, crash data records were kept in paper-based filing systems, but now computerised database systems are used to store information on crashes. This allows relatively easy analysis of data, and is particularly useful in the identification of trends, high risk locations or areas, key crash types, etc. There are a number of computer software packages available for this task. At a minimum, such a system should have the capacity to:
- Produce quick summaries on key crash variables (e.g. total crashes; crashes by different severity; crashes by different user groups, such as pedestrians; trends over time).
- Allow cross-tabulations (i.e. analysis of two or more variables at a time (e.g. change in fatal pedestrian crashes over time).
- Identify hazardous locations (e.g. locations, routes or areas with concentrations of crashes, or crashes of a particular type).
Crash data systems have become very advanced in recent years, with features added that allow quicker and more useful analysis. WHO (2010) and Turner & Hore-Lacy (2010) provide a list of other desirable features of crash data systems. These include:
- Built-in quality checks (algorithms and logic checks).
- GIS linkage to allow accurate identification of crash location.
- Ability to add new data fields without re-developing the database.
- Database navigation features such as drop-down menus, clickable maps.
- Pre-defined queries and reports.
- Options for customised, user-defined queries and reports.
- Mapping ability for data entry, crash selection and presentation of aggregated crash information.
- Ability to export data to third-party applications (e.g. Microsoft Excel, Statistical Analysis Software (SAS)) for further statistical analysis.
- Inclusion of crash narrative, sketches of crash scene, photographs and videos linked to crash.
- Automatically generated collision diagrams.
- Site ranking based on crash rates, numbers, costs.
- Ability to monitor sites of interest, i.e. before and after treatments.
An example of the successful implementation of a crash data system is provided in the case study below from Cambodia.
CASE STUDY - Cambodia, Road Crash Victim and Information System
The database system for Cambodia was inadequate to manage effective road safety outcomes. Since 2002, three different ministries were involved in road crash data collection in Cambodia (Ministry of Public Works and Transport, Ministry of Interior (MoI), and Ministry of Health (MoH)). While these databases provided some relevant information on the road safety, improvement was needed as the databases were not compatible and had major discrepancies between them. Handicap International Belgium and the Cambodian Red Cross proposed a new system, based on a standardised and more detailed data collection form. The new system provides accurate, continuous and comprehensive information on road crashes and victims for the purposes of increasing understanding of the road safety situation, planning appropriate responses, and evaluating impact of the road safety initiatives. Combining both data sources has enabled the system to cover more elements on detailed crash information (from police) and casualty information (from hospitals). This has led to higher levels of reporting. Read More.
The Swedish Strada system is a unique database that integrates police and hospital data. It is important to recognise that although this linkage provides valuable additional information, it does occur at additional cost. Further details are provided in the Swedish case study.
CASE STUDY - Sweden: Swedish traffic accident data acquisition (STRADA)
In October 1996 the Swedish Road Administration was commissioned by the Swedish government to initiate a new information system covering injuries and accidents in the entire road traffic system. Strada is based on information reported from two sources: the Swedish police and hospitals. By bringing together data from two sources – the police and the hospitals – Strada provides more detailed information, thus increasing the knowledge of road traffic injuries and accidents. Read More.
Some countries have undertaken in-depth studies of serious crashes to provide a more thorough understanding of crash causation factors and possible solutions. Such studies typically investigate a sample of high severity crashes. As an example, in the UK, the ‘On the Spot’ project collected detailed and high-quality crash information over two regions. More than 2000 variables were collected for each incident based on scene investigation soon after the crash occurred, as well as follow-up communication with medical services and local government. The information was analysed to provide insight about human involvement, vehicle design, and highway design in crash and injury causation. Mansfield et al. (2008) provide an initial analysis of around 2000 incidents from this program. Such investigation can provide far more detail than what is typically available through a crash report, and to a higher degree of reliability.
Similar examples can be found in many other countries, including the USA, Germany, France, Malaysia, India and Australia. Some of these programmes have been in place for many years and have produced large amounts of valuable information. One of the key outputs from the EU DaCoTA project (which collected and analysed data from European countries on various road safety topics) was guidance on the collection of such data, as well as standardised procedures (Thomas et al., 2013). A Pan-European In-depth Accident Investigation Network has been established, and tools such as an online manual for in-depth road crash investigations have been developed (see DaCoTa ).
The US has established the second Strategic Highway Research Program (SHRP2). SHRP2 is perhaps the most comprehensive database of information on factors occurring before and during crashes and near- crash events. The information collected includes data from the Naturalistic Driving Study (NDS) database. This dataset includes information from over 2300 drivers, collected through equipment installed in their own vehicles, and through normal driving. The massive amount of data collected through the NDS is supplemented through the Roadway Information Database (RID) which includes comprehensive information on road elements in the study areas as well as other relevant data (including crash data). This globally significant database is expected to provide the research basis for studies on driver performance and behaviour.
UDRIVE is the first large-scale European naturalistic driving study using cars, trucks and powered-two wheelers. The acronym stands for ‘European naturalistic Driving and Riding for Infrastructure & Vehicle safety and Environment’. Whilst road transport is necessary for the exchange of goods and people. There are significant negative consequences to road safety and the environment. To meet EU Target crashes and vehicle emissions will need to be reduced, with new approaches to achieve these targets developed. It is the aim of UDRIVE to provide a better understanding road user behaviour leading to crashes and wasted vehicle emissions.
Data sharing
Sharing of data from different sources is required for the comprehensive collection, analysis and integration of data. Efficient data sharing, particularly between the police and the highway authority, is essential for good practice road safety management.
However, it is important to note that some organisations may be reluctant to share certain data, particularly personal identifiers, due to the issues it poses surrounding the privacy and anonymity of those involved. One response is to collect the personal details on a separate page of the crash report form (e.g. name and address information). This page can then be removed before sending the remaining pages on to partner agencies. In some cases, it may be necessary to develop appropriate privacy policies to ensure this issue is addressed, or for certain variables to be removed to prevent the identification of individuals.
Crash data on its own is a valuable source of information on crash risk, and when combined with other sources of data, this value can be greatly increased.
Crash data is highly valuable for various stakeholders:
- Traffic engineers: They can use this data to identify and address hazardous conditions on existing roads and prevent similar issues when designing new roads.
- Police forces: Crash data helps law enforcement in planning their activities and concentrating on high-risk locations and traffic situations.
- Researchers: They utilize this information to conduct studies on crash prevention, make recommendations to improve safety at similar sites, and propose restrictive measures for specific road users, such as graduated driver licensing for young drivers.
- Policy-makers: They rely on this data to set crash reduction goals and develop road safety action plans at national, regional, and local levels based on safety analysis findings.
- Prosecutors: They use crash-related information, including eyewitness statements, police reports, and evidence provided by the parties involved.
- Insurance companies: This data helps insurers determine premiums and rates based on factors like driving history, vehicle type, safety measures, and risks posed by specific road networks.
- Vehicle manufacturers: They use crash data to design and produce safer vehicles.
Other user groups at both national and local levels make use of crash data occasionally or frequently. These include politicians, decision-makers, civilian agencies, education boards and the press. These groups play a key role in keeping the public informed about road safety and highlighting the need for preventive actions.
The following section discusses some of the other data sources, while Section 5.6 Analysis and Use of Data to Improve Safety discusses combining these sources.