


4.6 Safe System – Scientific Safety Principles and their Application
The Safe System approach marks a shift from focusing solely on crashes to reducing fatalities and serious injuries. Well-established safety principles underpin the Safe System approach as set out in Chapter 2. Key Developments in Road Safety . Further principles include the following:
- The combination of infrastructure safety features, vehicle safety features and travel speed(s) of crash-involved vehicles determines the impact forces that humans are subjected to in any crash. These interactions are to be managed to avoid fatal or serious injury outcomes.
- Safety levels are to be the key determinant of sustainable mobility levels. Travel speeds require management to target levels below those known speed thresholds that deliver fatal or serious injury crash impact energies (based on the level of vehicle safety and mix, and the nature of protective infrastructure characteristics) (see also Section 4.6. Safe System – Scientific Safety Principles and their Application and Section 4.7. Safe System Elements & Application ).
- Safe System approaches typically aim to develop a road transport system that is better able to accommodate human error by providing a safe operating environment - despite human fallibility - and providing effective post-crash care.
- A system-wide intervention strategy addressing all crash-phases and all Safe System elements is to be adopted, which addresses the safety of all road users.
- Legislative and enforcement strategies that achieve widespread user compliance with road rules and laws are necessary, as are strategies which deter the entry and exit arrangements of users and vehicles to the road system.
Development of the Safe System Approach
As noted earlier, the Safe System approach builds upon the ground-breaking road safety efforts of the Netherlands and Sweden.
Netherlands sustainable safety
Wegman and Aarts (2006) outlined a set of guiding principles (based on the Dutch Sustainable Safety Vision) considered necessary to achieve sustainably safe road traffic. The principles are based on scientific theories and research methods arising from disciplines including psychology, biomechanics and traffic engineering, and are set out in Table 4.4 below.
| Sustainable Safety Principle | Description |
|---|---|
| Functionality of roads | Single function of roads as either through roads, distributor roads, or access roads, in a hierarchically structured road network. |
| Homogeneity of mass and/or speed and direction | Equality in speed, direction, and mass at medium and high speeds. |
| Predictability of road course and road user behaviour by a recognisable road design | Road environment and road user behaviour that support road user expectations through consistency and continuity in road design. |
| Forgiveness of the environment and road users | Injury limitation through a forgiving road environment and anticipation of road user behaviour. |
| State of awareness by the road user | Ability to assess one’s task capability to handle the driving task. |
In 2018, SWOV (2018) recalibrated this vision and the five road safety principles are now strengthened with new insights, thereby providing a basis for specialized solutions:
- Three of the five principles are design principles:
- FUNCTIONALITY of roads.
- (BIO)MECHANICS: limiting differences in speed, direction, mass and size, and giving road users appropriate protection.
- PSYCHOLOGICS: aligning the design of the road traffic environment with road user competencies.
- The other two principles are organization principles now:
- Effectively allocating RESPONSIBILITY.
- LEARNING and INNOVATING in the traffic system.
Sweden’s vision zero
Tingvall (2022) commented on the challenges Sweden faces in redefining transport policy principles to reflect Vision Zero (or the Safe System approach):
- Sweden has found a new way in recent years to express transport policy. In summary, ‘accessibility can only be developed within the framework of safety and environment’.
- While mobility and accessibility make up the functionality of the transport system, the safety parameter (like many other elements in a society) is not a variable in an equation, but has threshold limits that cannot be exceeded.
- This shift is gradual. The new Swedish speed limit system is a good demonstration of how mindsets shift over time, with 80 km/h now the maximum speed for an undivided road (unless there are low traffic volumes), and this is intended to be absolute.
- While obtaining public acceptance is challenging, Sweden is gradually changing its approach to permissible travel speeds, and therefore to the setting of speed limits on new roads, or determining the investments necessary to modify existing roads to allow higher limits, based on the new speed limit system. This is where the safety benefits will be realised.
- The mobility needs will then be the deciding parameter for the infrastructure investment necessary to have safe higher travel speeds. Is it worthwhile to invest in safety solutions to increase mobility? This is the question, but it has taken many years to have this rather natural logic understood and accepted (see Box 4.2 below).
BOX 4.2: FUNDAMENTAL SHIFT IN THINKING: SAFETY AS THE LIMITATION MOBILITY – INHERENT TO A SAFE SYSTEM APPROACH
- Traditional approach – road authorities have striven to specify desired mobility (travel speeds) while doing what they can to improve safety on a length of road.
‘You can travel from A to B at 100 km/h and we will make some improvements to these two lanes two-way rural road to improve your travel safety’
- Safe System thinking – achieve safe travel, by determining the travel speed which can be adopted without risk of death or serious injury on this length of road.
‘You can travel at this safe speed from A to B based on the Safe System elements that work and that will avoid fatal and serious injuries in the event of a crash. You can only travel faster if infrastructure safety is improved.’ (e.g. median barriers so that head-on collisions are prevented, grade-separated intersections so that the likelihood of side-on crashes is minimised, etc.).
Understanding the Safe System Model
The elements of the integrated, human-centric Safe System model for safe road use and their interactions can be depicted as follows (Figure 4.2):
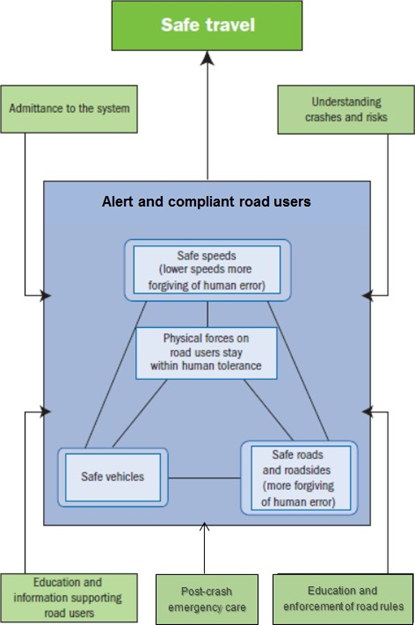
The Safe System design model has four main elements (including alert and compliant road users) plus five supporting activities that can be adjusted and applied in agreement with the four main elements to assist in making crashes more likely to be survivable.
The four main design elements are:
- Safe roads and roadsides – that are predictable and forgiving of mistakes. They are self-explaining in that their design encourages safe travel speeds and help avoid errors.
- Safe speeds – travel speeds that suit the function and level of safety of the road. People understand and comply with the speed limits and drive according to the conditions.
- Safe vehicles – that prevent crashes and protect road users, including occupants, pedestrians and cyclists, in the event of a crash.
- Safe road users – road users that are alert and unimpaired, and who comply with road rules. They take steps to improve safety, and demand and expect safety improvements.
The key supporting Safe System elements include:
- Emergency medical management for post-crash care (the fifth UN Decade of Action pillar).
- Understanding of crashes on the network, which requires good data to enable risks across sections of the network to be accurately identified.
- Control of admittance (entry and exit) of drivers to/from the road transport system (licensing arrangements including graduated licensing arrangements).
- Effective legislation and systems, enforcement and justice system support.
- Educating and informing the public.
The last three elements in the list above support achieving road user compliance with the road rules.
In summary, for alert and compliant road users, a combination of vehicle safety features, safety characteristics of the infrastructure and travel speed are required, together with effective emergency medical post-crash care, in order to avoid a fatal or disabling serious injury outcome in the event of a crash.
THE CRITICAL ROLE OF TRAVEL SPEED IN ACHIEVING A SAFE SYSTEM
Travel speeds are a critical variable within a Safe System with allowable safe speeds on any part of the network being dependent upon vehicle types (and their protective features), the forgiving and protective nature of the infrastructure and roadsides, the restrictions upon roadside access to the roadway and the presence of vulnerable road users. All these factors will determine a maximum vehicle speed on each section of the network above which an unacceptable probability of death is likely from any collision.
Injury outcomes and the creation of an inherently safe road system are largely dependent on the kinetic energy in the system. At the moment of impact, the force on the body can exceed the body's tolerance.
The amount of kinetic energy (Ek) is calculated according to the following formula:
Ek = 1/2 mv2
where m = mass (kg) and v = velocity (m/s)
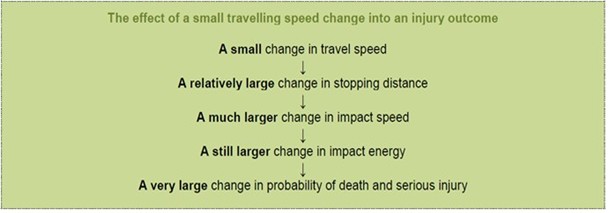
The formula shows that kinetic energy does not increase linearly with speed, but with the square of the speed. This has important implications for how speed affects the road safety. A small increase in travel speed can significantly increase the probability of a serious injury outcome (Figure 4.3).
SPEED MANAGEMENT IS ALSO CRITICAL TO OTHER SOCIETAL GOALS
Reducing speed is one of the most effective ways to improve safety, saving lives and debilitating injuries. However, the opportunities that lowered travel speeds offer to other societal goals are generally under-appreciated. Reducing speed also generates multiple other benefits fundamentals to sustainable mobility: reduced climate change impacts of road transport, increased efficiency (fuel and vehicle maintenance), improved inclusion and walkability (Job & Mbugua, 2020).
Job and Mbugua (2020) highlighted that when considering the full range of economic impacts (GHGs, emissions, fuel, etc.), economically optimal speeds are lower than expected and typically lower than prevailing speed limits compared to limited evaluations of impacts based on travel time savings alone.
In Oslo (Norway), the effects on human health and the environment were assessed by comparing lower speed limits to higher ones. During periods when lower speed limits, also known as Environmental Speed Limits (ESL), were implemented, there were significant reductions in PM10 (particulate matter) emissions, a type of air pollution and noise levels. When speeds were dropped from 80 km/h to 60 km/h, research showed ‘that whilst emissions of NOx and CO2 do not seem to show significant changes with ESL implementation, PM10 emissions are reduced by 6–12% and annual concentration levels are reduced up to 8%, with a subsequent reduction in population exposure.’ (Lopez-Aparicio et al., 2020). The benefits of decreasing PM emission levels include lower cases of asthma, irregular heartbeats and decreased lung function when related to air pollution.
Research conducted across Australia provides scientific evidence supporting the lowering of speed limits and its positive impact on mobility and liveability costs. Liveability costs are impacted by speed limits due to the frequent need to accelerate and decelerate in urban areas. ‘Further, reductions in speed bring about a reduction in vehicle operating costs with less wear and greater energy (fuel) efficiency, and less pollution and noise’. Additionally, research shows that aggressive driving behaviours, such as constant and quick lane changes, providing little headway, and speeding from traffic lights, can lead to fuel consumption and CO2 emissions ‘as much as four times that of non-aggressive drivers’ (Archer et al., 2008).
In São Paulo (Brazil), research determined that progressively lowering speed limits not only impacts traffic congestion but also reduces vehicle crashes. Research ‘provides evidence that speed limit reductions can be rationalized in cities that are concerned about severe congestion problems’. Moreover, evidence was found that ‘the speed limit reduction likely had strongly progressive impacts’ (Ang et al., 2020). In many large cities, higher speeds lead to a higher number of vehicle crashes, many of them fatal. The more vehicle crashes there are, the more congestion results. Lower speeds lead to fewer crashes, less road congestion, and trips with reduced overall delay.
Speed management can be achieved through a range of interventions including road infrastructure and in-vehicle technologies, as well as enforcement and education of road users.
Mean speed and crash risk
Crash outcomes, especially fatal crash outcomes, are influenced directly by the travel speed of vehicles at the time of impact.
Figure 4.4 shows the ‘Power Model’ of speed, developed as a result of reliable research establishing the relationship between speed and crash outcomes by comparing safety outcomes before and after speed interventions (Nilsson, 2004; Turner at al., 2024). Based on the model, a 1% increase in average speed is associated with a 2% increase in injury crash frequency, a 3% increase in severe crash frequency, and a 4% increase in fatal crash frequency.
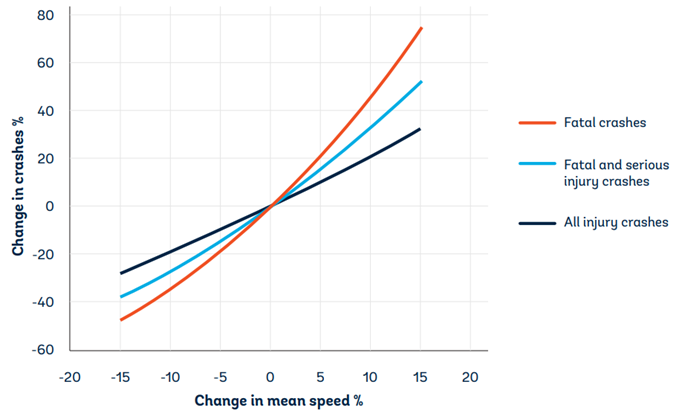
More recent research (Elvik, 2013; Elvik et al., 2019) suggests that the relationship between speed and crash risk is exponential. The revised model reveals a greater impact of vehicle speed on high-speed roads than on lower-speed roads. The GRSF Speed Impact Tool is designed to help calculate the change in crash risk due to a change in speed.
INFLUENCING KINETIC ENERGY LEVEL IN CRASHES
As indicated in the safety principles above, an important way to reduce fatal or serious injury crash outcomes is through better management of crash energy, so that no individual road user is exposed to crash forces that are likely to result in death or serious injury.
Conditions that support limiting crash energy to levels below which fatal or serious injury crash outcomes are relatively unlikely, are now becoming better understood, but are still not well recognised or applied system-wide in most countries.
A key strategy is therefore to move (over time) to set posted speed limits in response to the level of protection offered by the existing (or improved) road infrastructure and the safety levels of the vehicles and vehicle mix in operation on sections of the network.
Mobility needs to be constrained by Safe System compliance. Future safe infrastructure investment will often be necessary before considering raising the speed limits on sections of the network in order to avoid increased fatalities or serious injuries.
BOX 4.3: AN ALTERNATIVE ROAD INFRASTRUCTURE DESIGN APPROACH
Tingvall (2005) notes that while infrastructure design has previously been built on crash prevention, the alternative Safe System philosophy is built on kinetic energy management and injury prevention (secondary prevention rather than primary prevention). Speed is now more related to the crash outcome rather than the driver’s ability to keep the vehicle in control. This has led to more extensive use of roadside and median barriers, while intersections are redesigned to roundabouts, and roadside access (and development) needs to be more fully controlled. These are examples where the number of crashes might increase, but where the outcome is controlled so that human tolerance to serious health losses is not exceeded.
McInerney et al. (2018) state that the discipline of managing energy exchange and related forces currently exists in the fields of structural engineering for buildings and mechanical engineering for machines but is rarely sighted in the design of roads. For infrastructure to provide the key building blocks for a Safe System, road engineering design practice worldwide must include provision for the management of kinetic energy. For example, there are simulation programs that examine an errant vehicle departure into a roadside environment, which calculate the change in kinetic energy as the errant vehicle encounters roadside hazards. The rate of kinetic energy dissipation can then be translated into differing collision severity potential.